
We’ve still got 2 more preseason games and a couple of weeks before the official start of the season, but I think it’s time to actually game out what this season might look like. I’ve said several times that I think this is a “natural” 8-9 win team (closer to 8). However, that prediction was essentially made in a vacuum. Now it’s time to put some real evidence behind it. To do this, I’m going to use Pythagorean win probability, using base-case/upside/downside assumptions for both the offense and defense.
Tomorrow, I’ll take a look at the actual schedule and try to discern where, exactly, the Eagles wins SHOULD come from, setting benchmarks along the way so we can check in during the season and see how the team is doing (rather than overreact to short 2-3 game stretches).
For this analysis, we need to project how good both the Eagles offense and defense will be. I’m going to discuss this in terms of percentage +/- league average (same look we’ve talked about before). In both cases, we’re looking at Points (points for and against).
First, the offense. How good can the Eagles be?
Let’s start by looking at the team’s recent performance. Here is a table showing the previous 5 seasons:
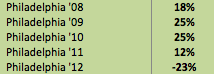
As you can see, the Eagles offensive production was very good over that time period. Last season was very bad, but it stands out as an anomaly. The offensive line was destroyed by injuries, and the Eagles best offensive player (Jason Peters, maybe 2nd best) was hurt before the season even started. This year, the O-Line looks to be healthy (crossing fingers), plus the team has added Lane Johnson, the 4th overall pick in the draft. Couple that with Chip Kelly’s expertise and the performances we’ve seen in the preseason thus far, and I think it’s fair to say we expect the offense to be closer to the ’09 and ’10 teams than last year’s.
Remember, we’re using 3 different cases here to get a range of expected win values. For the offense, I’m going to set them as follows:
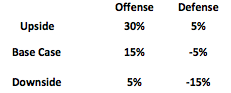
Upside – +30%. Not expected, but that’s why it’s the UPSIDE case. The 2010 Eagles were +20%, and with Chip Kelly at the helm and many of the same skill players, it’s not ridiculous to think the team could be slightly better.
Base Case – +15%. This might be too aggressive, but I think it’s fair as a base-case expectation. The offense is clearly the strength of this team. Chip Kelly + Shady + DeSean + the O-Line SHOULD mean a very good offense. I think, regardless of the Vick/Foles debate, that this team will be very good on offense. Given that the team was +12% in 2011 and +25% in both 2009 and 2010, I think +15% is a reasonable expectation.
Downside – +5%. Note that we are looking at the “Downside”, not the “disaster” case. Simply put, unless the team suffers injuries to multiple offensive stars, I don’t see any way it finished below league average in points scored. The team finished below average (<0%) just 3 times during Andy Reid’s tenure, and I expect that type of consistent offensive output to continue with Kelly.
Now the Defense.
As every fan knows, this is the side of the ball that will likely determine whether the Eagles are a playoff contender or not. As I showed on offense, here is the defensive performance, relative to league average, over the last 5 years:

Obviously, the defense is much harder to project. Last year was terrible, but remember that was also greatly effected by the historically bad turnover results as well as awful special teams. Special teams looks to be improved, and, statistically speaking, it’s close to impossible for the team not to rebound significantly in turnover margin. That’s a long way of saying that we should expect improvement from last year, though how much improvement is a big question. As it is, my assumptions are:
Upside – +5%. Not likely, but it’s within the realm of possibility that the Eagles will be slightly above average on Defense this year. While preseason isn’t always a great indicator, it looks like the D-Line will be a bit better than I expected it to be. The LBs are a question, but Mychal Kendricks could certainly take a big step forward this year. Also, it looks like Patrick Chung has plugged one of the gaping holes at Safety (for at least part of the season while he’s healthy). Bradley Fletcher looks good at CB, as does Brandon Boykin, who’s positioning himself as a contender for the biggest surprise on the team. If what we’ve seen so far continues, then average-slightly above average is a reasonable upside case.
Base Case – -5%. Slightly below average. Say the words while picturing this year’s defense and I think you’ll agree it sounds about right. If we start from last season’s performance (-22%) and factor in improved field position and turnovers, then add a less than catastrophic defensive backfield, and it’s reasonable to expect the team to move from very bad on defense to purely mediocre (on the negative side).
Downside – -15%. This one’s easy. Last year the Eagles were -22%. Just about everything that could go wrong, did. I just don’t see any reasonable scenario that results in the team being as bad or worse than it was last season. In fact, taking the exact same quality of performance and adjusting for better turnover luck would itself lead to relatively large improvement, hence the downside case of -15%.
So where does that leave us? Here’s the summary matrix:
Now we need to translate that into points, then we’ll use the Pythagorean Win Probabilities to calculate or expected win range. What should we expect the league average to be?
Here is a chart showing scoring per team, per game from 2003-2012:
Last year the average was 22.7, but as the chart shows, we should expect an increase this season. The average annual increase over that time period is approximately .2 points per game. Therefore, we’ll use 22.9 as our expected average for this season.
So, using the values in our matrix, we get the following:
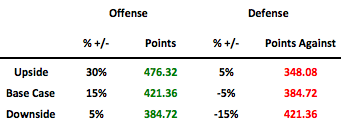
This chart gives us 9 potential values given our assumptions for this season. Here they are, with expected wins included.

The average win expectation is 9.1. I guess I need to shift my expectations upwards. Tomorrow, I’ll use the actual schedule to see whether the Eagles will win as many games as this analysis suggests. However, the overall message is this: the proper expectation for Eagles fans is a team that contends for the division and at least wins a Wild Card spot.

Checking out where the wins will come from is a kinda fun exercise; the Eagles seem to have a ‘below average’ schedule this year (I didn’t have much time for fancystats, so I used the draft order from April as a ‘ranking’ of teams last season – not great, but the best I had to hand) with an average opposition ranking of 17th in the league.
I’d expect the Eagles to win against SD, KC, TB, OAK, ARI and DET with the Tampa game being the only one really in question as it comes at the end of a 3-game road stretch. I also don’t think it’s unreasonable to think the Eagles will manage 3 division wins (the other teams are ranked 11th, 14th and 15th by draft position) especially since Chip will have a number of weeks to prepare for an RG3-less Redskins and the Giants and Cowboys have been notoriously up and down over recent years.
I think your numbers seem pretty solid and that 9 wins is a reasonable number for this team to aim for/expect and sneaking an extra division win or a game that they probably shouldn’t take on paper (Vikings, Packers, Broncos) would likely be a division win.
Isn’t it exciting!
I haven’t finalized mine yet, but as you suggested, getting at least 3 wins from the division is going to be a big key for the overall record (and obviously for a division title).
RG3 is supposed to play week one, so that might need to be adjusted in your analysis, but even with him for 2 games, I think the Eagles can win one of them.
Apologies, my previous comment wasn’t entirely clear – my point about RG3 was supposed to be that he hasn’t played any preseason games and, supposedly, won’t play in the final two. He’ll at least be rusty and, that tweet from Eskin the other day (where Andrews had apparently said he doesn’t think RG3 should be playing before the Redskins bye week (week 5) suggests he could be seriously limited to the point he shouldn’t be playing (a la the Seahawks playoff game) which is essentially the same as if he doesn’t play.
This type of analysis is only as accurate as it’s assumptions which are subjective in nature. However, while predicting football on a year to year basis is an imperfect science, I completely agree with your optimistic assumptions. The Eagles were a 8-8 team in 2011 despite a DVOA of 10 and a weighted DVOA of 5. Last year, we beat the former and future Super Bowl champs in the first 4 weeks (on our defense’s shoulders ironically) before injuries and quitting in the second half. There is talent on this team combining with a fresh scheme, and hopefully improved health (4 torn acl’s already not withstanding). Sure, the Eagles this year may be the toughest team in the NFL to predict, and this uncertainty creates a lot of variance in Eagles win prediction. I agree though the mean is in the 8-9 win area not the 5-6 win area I see far too many ‘analyst’ claim.
Side note I really think what you are doing with this site is admirable and congrats on joining BGN. I’m a 27 year old math geek for a financial software company in Manhattan and I think we share a similar perspective in our views/love of the Eagles. I hope to comment more regularly and look forward to reading the analytical research your doing in the future.
Glad to hear there’s a fellow “geek”, though I’d classify myself as more of an investment geek than “math”. If you look at the table, it’s fairly similar to an options pricing tree (I thought about taking it further in that direction but figured Id lose 99% of the audience’s interest).
I tried to be as objective as possible with the assumptions. Obviously if there are injuries or bad luck the downside case could be worse, just as if everything goes perfectly they could win 12-13 games. I’ll post tomorrow using the schedule as context, but lets just say that 9 wins looks very reasonable.
Agreed you would of lost 99% but I’m signed up for the CFA level one and I’m technically a quant with a master in mathematical finance (not UPenn though good luck there) so whatever that classification is I’m in that 1% audience.
And yes obviously you could become more granular with your upside and downside as opposed to just using one test case for each, however I agree with your objective assumptions creating reasonable conclusions.
Again, I think your bringing a logical, yet technical approach to your posts and I look forward to tomorrow’s. I’m going to go ahead and assume it will be better than this:
http://www.bleedinggreennation.com/2013/8/6/4596496/a-deeper-look-at-projecting-the-eagles-2013-season
I also just wanted to say that I really appreciate the analysis on this site. Like probably many of the other readers, I have a background in social science – I conduct research on education law and policy. At least in my field, much of the top research (on the policy side) comes from a mixed methods approach that combines qualitative and quantitative data (if not other kinds of data, like historical). The quantitative analyses here fill a gap for sure.
One analysis I’ve always wondered about for football (and the Eagles in particular) would use hierarchical linear modeling. I’m not sure if you’re familiar with it, but it’s basically a multi-level regression (think of multiple units nested within each other and an ability to account for the influence of different levels). Many analyses focus on individual players, units in a team, or a team as a whole. But I haven’t seen any analyses that seriously account for the influence of some levels on other levels. If we conducted this kind of analysis, this would help us understand how player performance is influenced by unit performance (e.g. offense, defense, ST) is influenced by team performance, is influenced by team performance, etc. In my field, organizational culture is an important variable that has a demonstrable influence on individual performance. I’d love to see this kind of variable, along with similarly broad variables, effectively operationalized.
All that said, I was left wondering about the influence of special teams on projected W/L, along with other types of variables like team culture, new coach, new system, etc.
Again, great work.
Glad you like it, the mixed method is definitely what I’m going for. I think I understand what you’re saying re the nested regressions. I don’t know if anyone has done it.
It sounds like you have some experience. If so, feel free to design a system. I can help you with the data and publish it here and on BGN (if it amounts to something). If you don’t have the time, no worries. I’m hoping to find a few people at school (I start in 2 weeks) to help me with more in-depth analyses like that. I don’t do regression models here because they take too long (I like to have 4-5 posts per week). I’d definitely like to start incorporating that though, since I know have a good idea of what variables are most important.
Not sure about the overall effect of Special teams. My guess is, if we visualize it as normally distributed, it would be somewhat leptokurtic. I think, at the extreme ends, Special Teams can have a large effect. However, within a normal range, I think it likely has little overall effect. Just a guess, obviously, I’ll have to do some research to see if that’s borne out.
Anyway, thanks for the comment. At the very least, it tells me this site is reaching the people I’m aiming for (educated, higher-level fans).
On Mon, Aug 19, 2013 at 7:52 PM, Eagles Rewind
As another fellow geek, I find this fascinating. Did you ever explain how you got from point differential to expected wins?
Damn. Should have (I did on the BGN repost) but didn’t. I used the Points For and Against values in the Pythagorean Win probability formula, using an exponent of 2.67 (that part I took from AdvancedNFLStats.com).
Pingback: Iggles Blitz » Blog Archive » How Good Can the Eagles Be?
Pingback: Let’s Party Like It’s 1999 FEATURED LINK | Eagles Nest Online | Philadelphia Eagles Blog
Pingback: Checking in with Preseason projections | Eagles Rewind
Pingback: Projecting the Eagles’ 2014 Record | Eagles Rewind