They’re here. Below you’ll find the TPR rankings for the 2014 draft. Scroll down if you don’t just want to see the numbers, but there are a few things we have to discuss before getting there.
As you know from my most recent posts, I’ve had to change the formula this year. Part of that was by design; I always intended to tweak it over time in order to provide a better representation of what I think is, conceptually, the right way to think about the draft. So what’s different this year?
– I’ve dropped the individual standard deviation. In theory, I still like this variable as a proxy for each prospect’s individual risk. If scouts widely agree on a prospect’s ability (i.e. rating), that prospect should represent less risk than a prospect for whom there is wide disagreement. Unfortunately, the change in grading scales has made using StDev much more complicated. That, combined with the fact that I only have three different scouting ratings for each prospect, means StDev, as I can currently calculate it, is probably not a reliable proxy for idiosyncratic risk. However, I still hope to use it in the positional ranking charts.
– Without StDev, we’re left with two factors: Systematic Risk and Positional Value. This year, I’ve combined them into one factor, an overall Risk/Reward Multiplier. Our stand-in for Systematic Risk is the Positional Hit rate I calculated for each position when I put together my “Hack the Draft” cheat sheet. I’ve taken that measure, and multiplied it by the PVM values I posted yesterday. Basically, we’ve now got an “Expected Positional Bonus” that combines positional impact with historical positional risk. Make sense?
Just to recap, our formula now looks like this:
Consensus Rating * (1 + (Positional Hit Rate * PVM))
Also, I want to remind everyone what the goal is. We are NOT trying to predict the draft. Every team has it’s own scheme, for which different players fit and do not fit. Additionally, while Relative Value (BPA+) is the best drafting strategy, you can’t be 100% blind to need. For example, the Seahawks aren’t taking a QB in the first round. The rankings below tell us, in a probabilistic sense, what the default ranking of prospects SHOULD be if we wiped everyone’s roster clean.
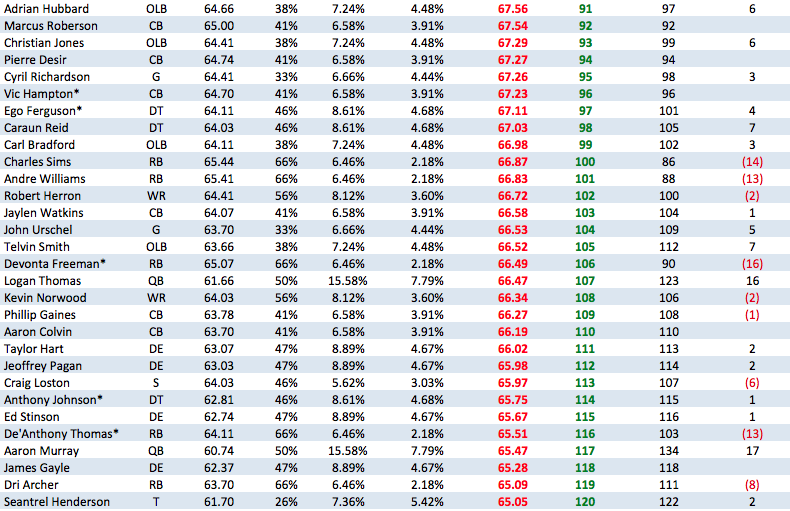
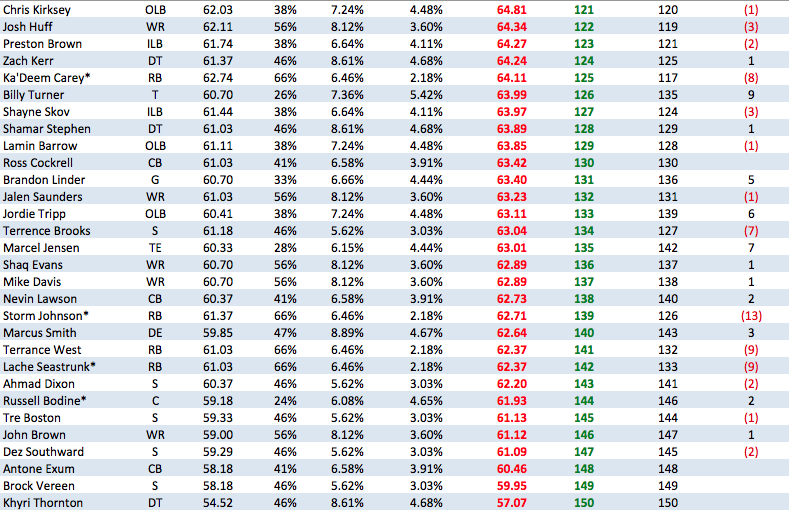
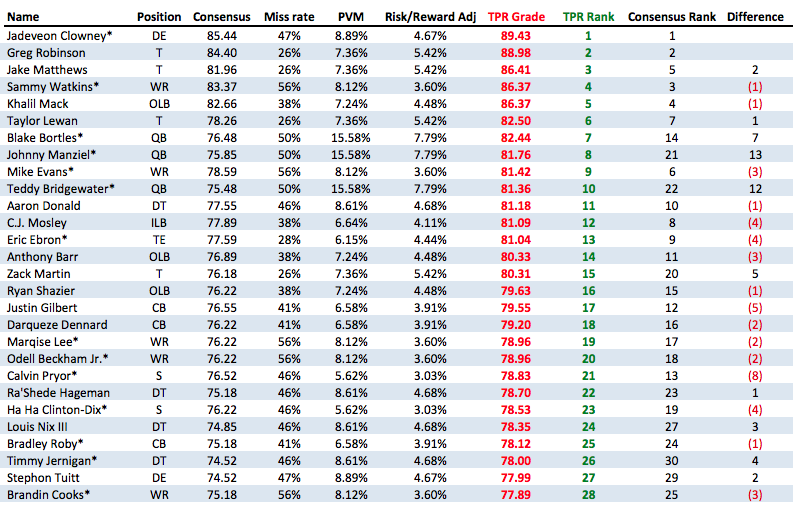
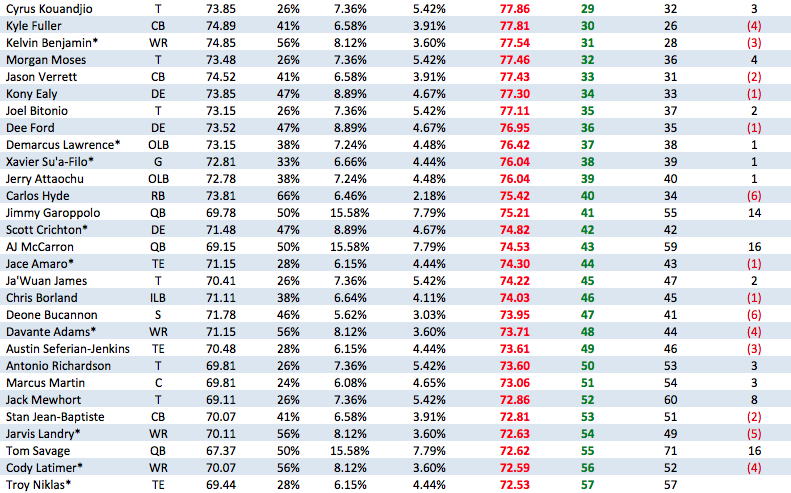
In other words, if the league was starting from scratch, this is how I would rank the players. Note that I’ve shown each factor. Miss rate does indeed show the miss rate by position. I’ve adjusted that in the calc (to flip it to Hit Rate), so it’s not a mislabel or mistake. Also, for the consensus ratings, if NFP did not rate a player, I plugged in a score of 5 for him (which is a very bad score). NFP claims to not rank anyone they rate as 4.9 or below. In the far right column, you can see the players for whom the Risk/Reward adjustment made the biggest difference; a positive number means they were helped by the adjustment.
Here’s the top 150, sorted by TPR Rank:
![]()