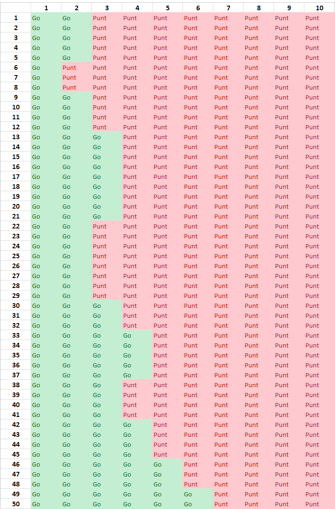
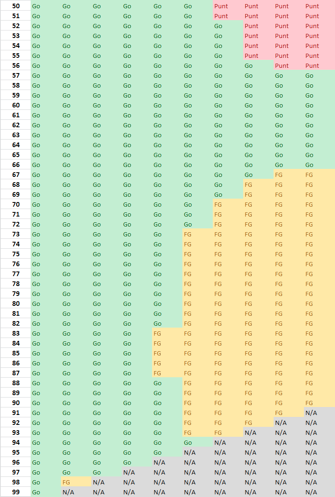
Here is the 4th down “default” strategy chart. The columns illustrate the yardage to go (so 2nd column is all 4th and 2 scenarios). The rows illustrated the location on the field, starting from the offense’s own end zone (so the 10th row shows scenarios for being on the 10 yard line.) There are a few cells that looks like statistical anomalies, so don’t get too hung up on those, they’d likely change with more data.