Andy Reid Era Stats: Part 2

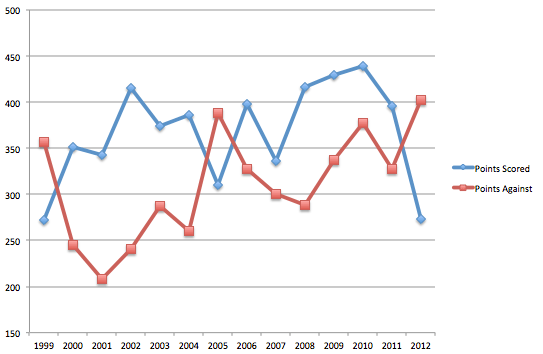
I highlighted turnover differential earlier but figured it would be interesting to look at how the offense and defense progressed over the Andy Reid era.  Below is a chart showing Points Scored and Points Against (total, not league rank).  Here are some interesting notes:

– Over his first seven seasons, Andy Reid’s team had an average league rank of 12.4 for Points Scored.  Over his last seven: 10.3.  Pretty consistent.

– Points Against average rank over the same time periods?  First seven seasons: 9.4    Last seven: 14.9    The defensive performance declined substantially over time.

– From 2000-2004 (Andy Reid’s peak), the Eagles average Points Against rank was 3.4.  Safe to say the Eagles success was built on defense.  (Points For average rank over the same period was 8.8)

– Over the past 4 seasons, the Eagles average Points Against rank is 19.

– For those of you thinking of Jim Johnson (hard not to when confronted with these numbers):  Average points against with JJ: 290.  Without JJ: 346.6.

Screen Shot 2012-12-31 at 10.22.03 AM


This ties in rather well with the message gleaned from the draft history post.  Reid’s inability to find quality defenders in the draft was perhaps his biggest persistent weakness (I know it wasn’t only Reid in the draft room, but you’re kidding yourself if you think he didn’t have the final say.)

T/O Margin and Wins (Strong Correlation Alert)

Rather than posting one huge Andy Reid retrospective, I’ll be doing it in pieces while attempting to highlight things that most writers are not paying attention to.

First up: Turnover Margin

As we’ve seen very clearly this year, turnovers are bad (shocking, I know.)  However, I was surprised to see just how strong of a correlation there appeared to be between wins and turnover differential.  Here is the chart for Andy Reid’s tenure (wins are the x-axis, T/O margin is the y-axis):

Screen Shot 2012-12-31 at 9.55.45 AM


This is too small of a sample to make any conclusions about the NFL in general, but over the next few days I’ll compile a lot more data and see what it looks like.  Regardless, it’s pretty clear that for Andy Reid, turnovers were highly correlated to success (for what it’s worth, the correlation coefficient for the above data is .69, really strong.)  This also further supports the notion that Reid’s downfall was tied closely to his decision to go with Vick as QB.  McNabb had his faults, but he was among the all-time best when it came to taking care of the football.  Vick, sadly, was not as careful, and that may have cost Andy Reid his job (along with the ridiculously bad fumble recovery luck this year.)

I think we can all agree that last year was the tipping point for Andy Reid.  He finished 8-8 and everyone’s expectations were higher, putting pressure on him for this year.  Although the 8-8 record isn’t great, the Eagles ranked in the top ten in both Points Scored (8th) and Points Against (10).  As you probably guessed, that performance was undone by the team’s turnover differential, which ranked 30th in the league.

I’ll be comparing correlations between wins a various statistics over the next couple weeks, but I’d be surprised to find one more determinate than turnover differential (other than point differential, for obvious reasons.)