Self-Scouting the Eagles: On Playing Time and Play Calling

Patrick Causey, on Twitter @pcausey3

We are in the middle of self-scouting the Eagles, figuring out what has hurt this team during the first seven weeks and what they can do to improve their chances of winning the NFC East moving forward. Two weeks ago, I tried to diagnose the issues holding Sam Bradford back. Last week, I broke down why I think the quarterback has as much to do with drops as the wide receivers.

This week, I want to take a look at how Chip Kelly uses the talent at his disposal. There are two facets to this: playing time and play calling. Let’s look at this further, plus the changes that can be made to improve upon these areas.

But before we get started, a side note: I am cognizant that these have not been the most positive takes on the state of the Eagles. But that’s hard to avoid when your team is 3-4. As they say, you can only put so much lipstick on a pig. But I also want these to be productive articles. It is easy to point out the flaws, but harder to come up with the solutions. I have endeavored to point them out when I can, but always appreciate feedback and thoughts of your own. So don’t be afraid to speak up; leave comments on how you think the Eagles can fix these issues.

Playing time

After acquiring Sam Bradford this offseason, many assumed that Bradford was a shoe-in to be the Eagles starter at quarterback. However, Chip Kelly insisted that Bradford would compete with Mark Sanchez for the starting job, as would every other player on the Eagles roster: “Everybody’s in competition and the best players play,” Kelly said.

A pure meritocracy sounds good in theory: a coach dividing up playing time based on production alone, regardless of a player’s past accomplishments, draft status or contract size.

But it’s not practical, not in an NFL where financial commitments and locker room chemistry must be taken into account. If you are tied financially to a person long term, you might give him a longer leash than a player to whom you have invested very little. And if you are a player that is respected in the locker room, a coach cannot unceremoniously bench you without having to deal with some repercussions.

Which explains why, with the exception of Marcus Smith, whose play has not justified his lofty draft status, Kelly has not stuck to this mantra of “best players play.” On several occasions, Kelly has stuck with a player despite evidence suggesting that an alternative would represent an improvement.

But has he gone too far?

Take last year, for instance. Darren Sproles was one of the Eagles best players, yet he curiously saw his snap count dwindle as the season progressed.

And how about Bradley Fletcher? Fletcher was a human piñata, both on and off the field, and his performance against the Dallas Cowboys late in the season — when he was burned for three touchdowns by Dez Bryant — was arguably the final nail in the proverbial coffin of the Eagles playoff hopes. But for reasons known only to the Eagles coaching staff, they continued to play Fletcher ahead of Nolan Carroll and Brandon Boykin.

Ditto with Trent Cole. I respect Trent Cole immensely; he was a classic lunch pale, blue collar worker that is the perfect embodiment of what this city stands for. But he clearly lost a step last year while Brandon Graham was wreaking havoc in limited playing time. Yet, it was not until Cole broke his hand in December that Kelly finally made the switch, simply because he had no other choice.

And here we are again, seven weeks into the 2015 season wondering why Kelly continues to rely on certain players when the backups are proving to be more effective.

Mathews v. Murray

The most obvious example this season is Kelly’s decision to stick with DeMarco Murray over Ryan Mathews, despite overwhelming evidence that Mathews is the better player at this point in his career and in this offense.

I covered this in-depth earlier this year, so I won’t rehash the same old material. But here are examples of the two biggest issues with Murray so you can see what I mean.

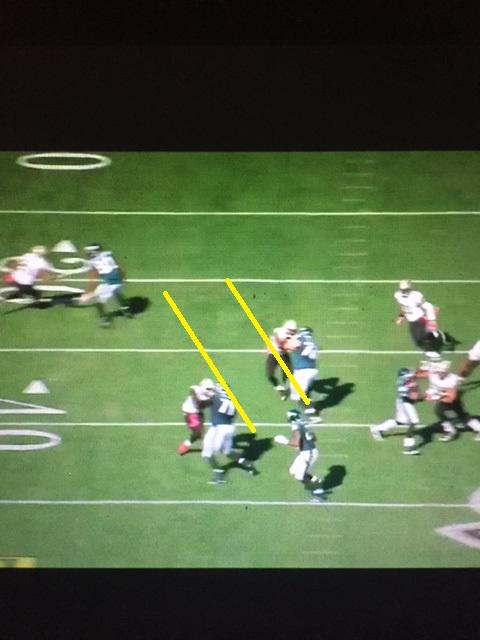
First, Murray has been inconsistent with his reads, leaving too many plays on the field as a result. Against the Saints, Murray failed to see and take advantage of an easy opportunity to gain yards down in the redzone.

Play 1

As you can see, Murray has two lanes to attack. At a minimum, he should be able to get to the next level before having to beat the single high safety. Instead, Murray tried to bounce the play outside and fell before he was able to gain any yards:

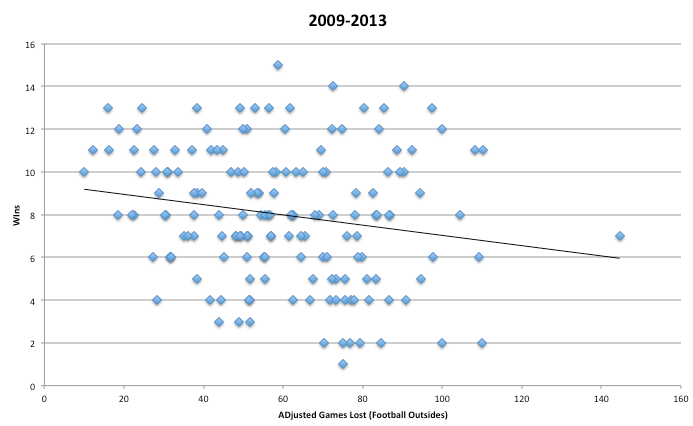
Even when Murray has made the right reads, he has been a step too slow to exploit the hole. This loss of explosiveness and drop in production was to be expected.  Any running back that has touched the ball at least 370 times in a single season had his production fall off a cliff the following year, to the tune of a 39.2% drop in production on average (for some, like Larry Johnson, Terrell Davis and Jamaal Anderson, it was much, much worse).

Murray touched the ball an absurd 497 times last season (392 regular season rushes, 57 catches; 44 carries in the playoffs, four catches). That is 33% more than the 370 bench mark for production decline. It should be a surprise to no one that Murray has lost a step this year.

Meanwhile, Mathews just makes plays whenever he is on the field. He is a decisive, imposing running back that fits the downhill running style that Chip Kelly wants in this offense. He also looks much more explosive in the run game, as evidenced by his 6.1 yards per carry, compared to Murray, who is averaging a paltry 3.5 ypc.

Compare virtually identical plays (save for minor formation changes), and you can see the difference in speed and decisiveness between the backs:

Here is Murray running ta staple of the Eagles offense, the outside zone.

Now watch Mathews, running the same play out of a slightly different formation:

Ignore the result for a moment, and focus on how much faster Mathews makes the right read and explodes through the running lane. To be sure, Mathews had an easier hole to attack, but its not like Murray didn’t have anything to work with. Look at this lane:

Play 5

It is fair to wonder whether Kelly’s loyalty to Murray has cost the Eagles a loss or two, especially in a winnable game against the Carolina Panthers. After Mathews broke off a 63 yard touchdown in the third quarter, he did not receive a single carry the rest of the game.

His absence was magnified after the Eagles defense picked off Cam Newton following Mathews’ touchdown run, which set the Eagles up at the Panthers 18 yard line. Murray received three carries and gained a grand total of one yard on that drive. Mathews sat on the sideline for the entire series. The drive stalled, and the Eagles settled for a field goal to make the score 21-16, Panthers.

It’s unclear why Kelly has stuck with Murray so far. Perhaps Kelly is trying to prevent Mathews — who has an injury history himself — from breaking down as we get deeper into the season (entirely understandable). Perhaps Kelly sees the $7 million the Eagles owe Murray next year and wants to give Murray every shot to validate the contract (somewhat reasonable, but still not smart). Or perhaps Kelly is just loyal to a fault and/or unable to recognize when a backup deserves more playing time (indefensible).

Regardless of the reason, Kelly needs to make the switch. Mathews should get more carries moving forward, and a case could be made that Sproles needs to get more touches ahead of Murray as well. It might upset Murray, but with the team at 3-4 and in desperate need of a division win this weekend, hurt feelings are the least of the Eagles worries.

Cooper and Austin

A more subtle issue is the frequency at which he is relying on Riley Cooper and Miles Austin to make plays in the passing game. Look, I get it: none of the receivers have been lighting the world on fire. So it’s not like Cooper and Austin are getting playing time over a Julio Jones-esque player.

But Cooper and Austin have been especially poor, and Kelly’s continued reliance on them is questionable, at best.

Kelly had the stated goal of wanting to improve the Eagles depth this offseason, especially on offense. The idea behind this was simple: Kelly runs a lot of plays, fast, and wants to be able to rotate players in without having to adjust his play calling.

The strength by depth approach sounds good in theory, but it hasn’t worked out so far this year. Consider the following break down of the Eagles receivers this season:

Name Targets %  of Targets Catch %
Jordan Matthews 63 22.9% 61.9
Zach Ertz 42 15.3% 57.2
Darren Sproles 37 13.5% 59.5
DeMarco Murray 28 10.2% 82.1
Riley Cooper 22 8% 50
Miles Austin 21 7.6% 52.3
Josh Huff 19 6.9% 68.4
Nelson Agholor 17 6.2% 47.1
Ryan Mathews 15 5.4% 80
Brent Celek 9 3.2% 77.7

A lot has been made about Matthews, Ertz and Sproles dropping the ball — and rightfully so. But if you compare their catch percentage to other receivers around the NFL, they actually are in pretty decent company:

Matthews has a 62% catch percentage, which is comparable to Julio Jones (65%), Odell Beckham (64%), Randall Cobb (64%), Jarvis Landry (64%), Demaryius Thomas (62%) and Calvin Johnson (63%).

Sproles (60%) and Ertz (57%), meanwhile, are among Allen Hurns (61%), Marques Colston (61%), Brandin Cooks (60%), Emanuel Sanders (58%), and DeAndre Hopkins (57%).

If we expect some regression to the mean for the drops on all three (which I think is fair, given that their current drop rate would be historically bad), those catch percentages would improve even more.

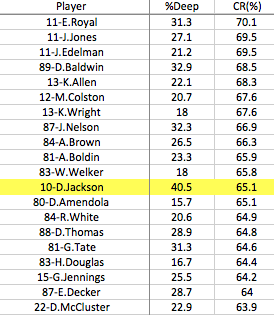
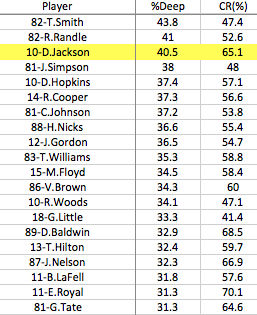
But Cooper and Austin? Their 50% and 52% catch rates, respectively, are among some of the worst in the NFL, ranking them along side the likes of Ted Ginn, Jr. (49%), Malcolm Floyd (50%), TY Hilton (50%), and Allen Robinson (49%). Despite their bad production, they still account for 16% of the team’s total targets.

So how can Kelly fix it? I would like to see the Eagles shift some of those targets to Matthews, Ertz and Sproles, and even Huff and Agholor. Yes, the latter two have been underwhelming so far, but it is too early to give up on them given their age and potential. And that is especially true with Agholor, who I suspect will see a resurgence in the second half of the season much like Jordan Matthews did last year.

But I think, no, I am quite certain, that the same improvement cannot be expected from Cooper or Austin.  Cooper is a six year vet, Austin (who used to be very good), is in his ninth season. Expecting a resurgence from either of them at this point in their careers is unreasonable.

Kelly can offset the loss of Cooper’s run blocking skills by relying more heavily on the 12 personnel we have seen emerge in recent weeks (two tight ends, two wideouts, 1 running back).

Celek represents an upgrade over Cooper in the blocking category, so leaving Cooper on the sideline for someone like Huff or Agholor makes sense. And given Ertz’s versatility and strength as a pass catcher, there really isn’t much of a downgrade in the passing game.

I also think the Eagles can look to how the New England Patriots utilize former Eagle Dion Lewis for ways to get Sproles more involved. Lewis is averaging 86 yards per game through the air and on the ground, with the Patriots lining him up all over the field.

In the blowout win against the Miami Dolphins on Thursday night, the Patriots lined up Lewis out wide against a cornerback:

Here is a better look at the route:

The Eagles have split Sproles out wide a handful of times this year. But he is still being underutilized. There is no reason they cannot increase the frequency with which Sproles lines up as a receiver, and continue to look for ways to get Sproles involved in the screen game. He is a dynamic weapon that few defenses have answers for, but right now the best defense for Sproles seems to be Kelly’s unwillingness to use him.

And while having Mathews, Sproles, Ertz and Celek on the field at the same time might not be conventional, they are our best offensive weapons right now, so it makes sense to throw convention out the window in pursuit of more wins.

Play calling

Kelly has invested  $11.61 Million in the running back position, good for third highest in the NFL.  It was a curious decision given how much the NFL has devalued the running back position. The Eagles currently spend more money on running backs than the Denver Broncos, New England Patriots, Atlanta Falcons and Arizona Cardinals combinedwho are a collective 26-4 this year. The teams in the top four of money spent on running backs? The Minnesota Vikings, Chicago Bears, Philadelphia Eagles and Houston Texans, who are a combined 13-16.

While we can debate the merits of Kelly’s investment in the running back position, there really can be no debate that Kelly has under utilized those backs throughout the season. Kelly has actually called the least amount of run plays in his time with the Eagles, as you can see in this chart, which breaks down the run to pass ratio (rankings in parenthesis):

Year Pass% Run%
2013 53 (27) 47 (6)
2014 57.82% (21) 42 (12)
2015 60.17% (15) 39.83% (18)

Earlier in the year, the Eagles’ offensive line could not run block to save their lives, so Kelly had no choice but to abandon the run. But since the Jets game, the run blocking has improved considerably. So it is unclear why Kelly continues to abandon the run game, especially given how poorly both the receivers and quarterback have played.

Take the Carolina game, for instance. With the exception of the tail end of the fourth quarter, the Eagles were not in a position where they needed to abandon the run. Yet, Kelly kept dialing up the pass, calling 51 pass plays (46 passes, 5 sacks) to just 30 runs.

Why is balance so important? Well, for starters, the Eagles have a much better win percentage when they have a more balanced attack. The Eagles are 12-2 when they run more than pass. But when the inverse is true? The Eagles are 10-15.

I understand that correlation does not necessarily equal causation; but it is hard to ignore this sample size. 12-2 and 10-15 are not statistical aberrations. They are large enough sample sizes from which to draw the conclusion that the Eagles are much better when they take a balanced approach.

The other reason is that it will take pressure off of Sam Bradford and the wide receivers, and open things up in the passing game. Look at the difference between the Eagles offensive production in 2013, when they asked Nick Foles to throw the ball on average only 31 times a game, compared to 2014, when Foles was throwing it 39 times a game.

Or look at how Tony Romo enjoyed the best year of his career last season, when the Cowboys ran the ball 49% of the time, good for third most in the NFL. Romo was 12-3, completed 69% of his passes, threw 34 touchdowns, 9 interceptions, and had a 113.2 quarterback rating.  That was career best marks in completion percentage and quarterback rating, and the second best marks in his career for touchdowns and interceptions.

Simply put, the Eagles invested heavily in the running back position. It is time they start using it.

Conclusion

So in short, the Eagles need to consider making the following changes.

  • Give Mathews more carries than Murray.
  • Stop relying on Cooper and Austin so much in the pass game. Divide their targets among Matthews, Ertz, Sproles, and even Huff/Agholor.
  • Run the ball more. The team wins more often and it opens up the passing game.
Advertisement

Are NFL Teams Faking Injuries?

Sorry for the recent absence, I returned from Beirut and went right into recruiting season.  Once I’ve accepted an offer I’ll start posting again. In the meantime, I’ve got a guest post (unedited) from Jared Cohen (previous posts include the 4th down chart and the kick return strategy post).  You can find the original here. and follow the author on Twitter @jaredscohen.

——–

Given all the animated discussion over the Patriots tactics against the Ravens in their divisional round playoff game, I thought it would be as good a time as any to post some gamesmanship research.

If you read about the game – you know the Ravens were a bit upset with the Patriots usage of receiver eligibility to disguise their offense. The response from the Patriots was, well, Patriots-like. If it’s not against the letter of the law, it’s all good (unless it’s videotaping other teams, in which case even the law doesn’t matter).

Clearly, the NFL is a league where teams will look for any edge, even if it means pushing the bounds of fair competition.

So it’s with that issue in mind that I started digging into the possibility that players are faking injuries.

As a Philadelphia sports fan, I’m generally inclined to assume that my teams will ultimately lose, and so once the Eagles started running Chip Kelly’s offense, I was quick to accuse every injured defender a liar and a cheat (not to their faces of course).

The Eagles run a very high-tempo offense, one that doesn’t allow opposing defenses to leisurely make substitutions or get a full play clock to catch their breath. It’s a major feature of their strategy, and one that opposing teams would love to minimize, particularly if they aren’t well prepared for it.

One way to slow down the pace of the Eagles offense would be for an opponent to use their timeouts while the Eagles offense is in full-swing. But since a team only has three timeouts per half, they’re a little too valuable to burn. An injury however, is an official’s timeout – these are unlimited – and there’s no cost to the injured team outside of the last two minutes of a half, except that the injured player must sit out for the next play.

So in the current NFL world where fake injuries don’t have a cost (apart from having the ‘injured’ defender miss a play) and can help defenses maintain an easier pace – you could see why an Eagles fan might look at an opposing defender’s injury with suspicion.

Could the Eagles opponents be faking injuries to slow them down? The idea is one that makes the rounds in Eagles bars, but one that’s hard to actually evaluate. So this is my attempt to try.

Others have analyzed NFL injuries via metrics like games lost (i.e., players who aren’t active on game day because they’re injured), but to my knowledge, this is the first attempt to use play-by-play data to look at in-game injuries for trends and whether teams might be faking against the Eagles or other high-tempo teams.

The analysis is a bit long, so below are some quick takeaways:

– The Eagles suffered (or inflicted depending on your point of view) the most defensive injuries against the in league in 2014, and are 2nd in the league when adjusted for a per-play basis
– Across the league, there is a significant positive correlation between running more offensive plays and a higher per-play rate of defensive injury
– Such a correlation could be attributed to fatigue, but this correlation does not hold for the three other possible game situations (own offense, own defense, offense against) – these show no strong relationship between running more plays and a higher per-play rate of injury
– Taken together, these last two points support my hypothesis that players fake injuries against higher tempo offenses

Data Collection and Methodology:

I gathered play-by-play data from all the regular season games this year, and identified all the in-game injuries noted in the descriptions. In case you haven’t read play-by-play before, each play has its own line and explanation, and any play that resulted in an injury timeout is noted. Below is an example:

2-10-DET 40 (14:05) (Shotgun) 10-E.Manning pass incomplete deep middle to 80-V.Cruz (27-G.Quin). DET-27-G.Quin was injured during the play.

If an injury was noted as a stoppage, it was recorded. In an ideal world, we’d eliminate injuries that are serious and clearly not fakes, but there’s no detail on the injuries in the game data, so we have to take the major with the minor.

The play-by-play injuries were then coded as to whether they occurred to the offense, defense, or on special teams (e.g., kick coverage). There were approximately 700 total observations, and while it’s possible that not all injuries were noted in the play-by-play data, this is the only comprehensive source for such information. Given that there are ~700 injury stoppages in our set, that works out to 2-3 injury timeouts per game, which sounds possible but could also be low. It’s possible that whoever officially creates the play-by-play gets lazy and misses some, my assumption here is that if any injuries are somehow missed, they aren’t biased towards one particular side of the ball.

After gathering the data, one additional adjustment is for play frequency. Simply put, the more snaps a player gets, the more likely they are to sustain an injury. Therefore, any team that runs more plays is more likely to see a higher absolute number of injuries. To account for this, I also looked up the total number of plays for each team’s offense and defense during the course of the year – to understand the rate of injury rather than the total number.

Output:

Let’s start with the absolutes. I found 692 injuries in the play by play data, 66 of which were special teams plays. I took these out, because they aren’t central to the question of are teams faking injuries to slow down offenses. Of the remaining injuries, I looked at whether they happened to an offensive player or a defensive player and which team they occurred against, below is the data from this season:

Not a shocker to see the Eagles at the very top of that list, and indeed they led the league in defensive injuries against this season.

However, as I already noted, this metric can be misleading. The Eagles offense runs more plays per game than any other team, so we would expect them to be near the top of this list. We need to adjust our data for the number of offensive plays – and we can examine the rate at which opposing defensive players get injured against the Eagles and whether they are still an outlier.

So as we see when we look at it on a rate basis (number of injuries/number of total offensive plays), the Eagles are still close to the top of the league, and roughly 50% above the league average. Houston is just above them, and while no one would consider their offense up-tempo, the fact that the Eagles are so high would be consistent with the theory that opposing teams might be faking injuries to slow them down.

Now, before we get any further down the faking rabbit hole, what if there’s a simpler explanation that doesn’t involve fake injuries? There’s another obvious possibility to explain why the Eagles are so high in defensive injuries against. What about the idea that as you run more plays, players get more physically exhausted, and therefore are naturally more susceptible to injury?

That seems possible, right? So let’s examine that idea a bit.

The first thing we can do is very simple, does injury frequency vary by quarter? If teams get physically tired during the course of the game and that leads to more fatigue and more injury, there should be more injuries as the game goes on:

Interesting. This sort of muddies our waters a bit.

In absolute terms, the number of injures rises dramatically as the game goes on. Injury stoppages in the fourth quarter occur at 2x the rate they do in the first quarter. Part of that can be explained by the fact that the clock stops more frequently in the fourth quarter than the others (and thus more plays), but that wouldn’t explain a 2x difference. I would want to check against the sheer number of plays run by quarter, but I don’t have that data without a bunch of more work.

Still – it looks like that thinking may be reasonable, injuries increase as the game goes on. But it’s also interesting to note that the increase is much more pronounced on the defensive side of the ball. We’ll come back to that later.

For the time being, let’s move on to looking for evidence of fake injuries.

As a general framework for this analysis, I’ve split the types of injury stoppages into four buckets:

1. While on defense, your own team suffers an injury (Own-Defense)
2. While on defense, your opponent suffers an injury (Opponent-Offense)
3. While on offense, your own team suffers an injury (Own-Offense)
4. While on offense, your opponent suffers an injury (Opponent-Defense)

We’ve been focused on bucket #4 thus far, and saw that on a per-play basis the Eagles are close to the top of the league in terms of defensive injuries against on a per-play basis. We also saw that overall injuries increase as the game goes on – but it seems much more prevalent on the defense, which is the side that would be interested in faking injuries.

So can we look a bit deeper to see if play frequency increases injury risk across each type of injury stoppage? The idea that running more plays increases the rate of injury should not be exclusive to offense or defense – although it appears that way at first glance – it’s hard for me to believe that defensive players are in any worse shape or take any harder hits than offensive players.

To take a look at the issue, I ran some basic correlations across each of those four injury types, looking at the number of plays run and the rate of injury. Just to clarify, I summarized the four below:

1. Your defense runs more plays and gets injured more often (this would be a bad defense)
2. Your defense runs more plays and your opponent gets injured more often
3. Your offense runs more plays and gets injured more often (this would be a good offense)
4. Your offense runs more plays and your opponent gets injured more often

Again, if the rate of injury increases with more plays, we should see relationships in each of these situations. So what do we see?

#1 – So earlier we saw defenses suffering more injuries as the game goes on…and yet, when we look at number of defensive plays per game and the rate of defensive injury, there really doesn’t seem to be any relationship. Teams with defenses that are on the field a lot don’t seem to get injured at a higher rate than those who execute fewer plays.

#2 – Our next picture shows a similar lack of correlation, this time between defensive plays per game and the rate of opponent offensive injury. This idea would be that if an opposing defense is really bad, your offense gets more plays, and might get hurt more frequently. But the data shows nothing that looks like a relationship.

#3 – Now we’re on the offensive side of the ball, looking at whether an offense that runs a lot of plays suffers a higher rate of injury. There’s actually a relatively weak negative correlation between running lots of offensive plays and suffering offensive injuries. If you want to believe in things like Chip Kelly’s Sport Science program, you would expect a negative relationship as teams that employ high tempo offenses are more adequately prepared to stay healthy while running it. While a very slight relationship exists, it doesn’t look to be that large, if it even exists at all.

#4 – Hmmm…now it’s officially interesting. When we look at the rate of defensive injury against offensive plays per game, there is our most significant positive relationship. A correlation of 0.39 is significantly more than we’ve seen in the other three instances, and it’s also the only one where there is a clear incentive to fake injuries.

Taken alone, this relationship might be explained by the fatigue theory, but I think it’s tougher to make that argument when you don’t see anywhere close to the same relationship in all other situations. When a defense is bad and on the field a lot, they don’t get hurt more often, when an offense is good and runs lots of plays, they don’t get hurt more often, and when a defense is bad and their opponent runs a lot of plays, they don’t get hurt more often. The only ones who show a substantial increase in injury stoppages as plays increase are opposing defenses.

To me, that’s pretty freaking suspicious. Either opposing defenses are the only ones who suffer from fatigue-related injuries…or maybe some of the injuries aren’t injuries at all.

Now, this is far from 100% conclusive. It may be that defensive players naturally get more fatigued than offensive players due to their roles (i.e., offensive players can take more plays off because they know the play calls)…but I don’t really buy that. I think there’s at least a little bit of shenanigans.

It’s also an entirely different question as to how much this even matters. Any fake injury will happen on the margins, as you see the number of total injury stoppages remain relatively small (2-3 total per game). But for an Eagles team that narrowly missed the playoffs, the marginal differences matter.

Solutions

So is there a way to address teams that fake injuries? There are certainly options, but some of them are just impractical. The NHL has a penalty for diving, but you really can’t ask the officials to diagnose injuries and try to penalize fakers. You could charge a team a timeout, which the NFL already does if an injury occurs in the last two minutes. That’s much easier than trying to penalize teams, but also provides incentive for coaches and players to hide injuries (also, what do you do in the case of a ‘Body Bag Game’?)

One idea I think might actually be workable, is to tweak the NFL’s current rule for injured players. As it stands today, an injured player who causes a stoppage has to miss at least one play. Well, if you want to eliminate fake injuries, you should raise the cost to those players for faking, and you can do that simply by making them sit out longer. What if, when a player is injured and causes an official stoppage, they must sit out not for just one play, but for the remainder of that series or until a change of possession?

Missing the rest of a series is a bit more significant than missing just one play, and is something that could balance the equation on faking injuries. It also dovetails nicely with the NFL’s stated emphasis on player safety (interpret my use of the term ‘stated’ as you will, based on your own level of cynicism)

If there are fake injuries happening, such an increase in missed time might be enough to keep anyone from acting hurt. Requiring a player to miss the remainder of a series also isn’t as significant as forcing them out for the rest of a quarter or a game.

Some would argue that this isn’t even a problem worth focusing on. But if fast-paced offenses gain greater acceptance in the NFL (which will happen if more of them succeed), the issue will only become more prominent (beyond the realm of the paranoid Eagles fan) and could materially impact the game.

Summary Data

Below is a table of all the raw data I used here, as a reference:

Bonus – Jevon Kearse All-Stars

One last thing I did with this data, after pulling it together, was dig through and sum up all the specific players who sustained injuries in a game this season.

I wanted to look into it because I was really interested in what I’ve termed the ‘Jevon Kearse All-Stars.’ It may just be a bad memory on my part, but one of the things I really remember about Jevon Kearse’s tenure with the Eagles was his tendency to hurt himself and fall to the ground like he got shot. I feel like his injuries always looked more serious than they actually were. It’s possible I’m misremembering, and if so I apologize to the Freak. But with that said, here were the league leaders in injury stoppages in the NFL this year:

Now I’m not accusing these guys of faking injuries, these just happened to be the guys with the most injury stoppages in the play-by-play data (excluding special teams, which most of these guys don’t play anyway).

Enjoy your spot on the Kearse All-Stars guys – the trophy (it’s an ace bandage) is in the mail!

Projecting the Eagles’ 2014 Record

Just minutes to game time, so I’m coming in just under the wire with my full season projection.  For reference, here is last year’s projection.  Let’s first revisit that, then I’ll get to this year.

If you remember, I did a fairly basic expectations matrix using Points Scored and Points Against.  With those values, I used the Pythagorean Win Expectation for each, then took the average of all scenarios, eventually arriving at a projection of 9.1 wins.  Here is the chart from last season:

My base case projection was 421 points scored, 385 points against.  In reality, the Eagles finished with 442 points scored and 382 points against.  That’s an incredibly close result.  I, of course, will almost certainly not be that accurate again this season (regression flag!).  Still, it provides at least some evidence that I know what I’m talking about, so I like highlighting it.

Now, about this year:

First, we need to know the league average.  Remember that we’re using that as a benchmark and using relative performance around that measure to arrive at our Points projections.  Well, in 2013, there was an average of 23.29 points per game scored by each team.  Over 16 games, that equates to 372.65 points per game.  However, we need to adjust for inflation.  Over the past decade, scoring has increased at a fairly steady rate of .2 points per game. Last season actually saw a much larger increase (.6 ppg jump), but without more data we need to stick with the longer term trend.  Adjusting for inflation gets us to 23.49 points per game for each team.  That gets us to an average of 375.84 ppg per team.

So how will the Eagles do?

Upside Case

As I’ve done before, I’m going to focus mainly on Offense and Defense.  Special Teams does play a role, but it’s relatively small and, perhaps more importantly, very hard to predict.

On offense, things are pretty simple from where I sit.  The Eagles upside for this year is their performance from last season.  Some might argue there’s room for improvement, and there definitely is.  However, so many things went right for the Eagles on offense last season, and the team was SO good, that it’s unreasonable to expect them to exceed that level this year.  Additionally, the team lost DeSean, is likely to see a few more injuries this year, and will almost certainly suffer some INT regression.  Therefore, meeting last year’s performance is within reason, but definitely optimistic. Since it’s an upside projection, we can allow for some improvement, but I just don’t see any way to objectively expect much. Last year the team finished +18.6%.  For our upside this year, I’ll round that up to +20%.  It’s somewhat unlikely, but within reason that the Eagles will be very slightly better this year than they were last year on offense.

On defense, our assignment is much less clear.  There are a lot of young players that might grow into much better players this season.  There’s also the fact that this is now year 2 of the 4-3 defense, which should lead to more comfort.  The team added Malcolm Jenkins at Safety.  While he’s not a great player, he should still be an upgrade (potentially large one).  On the flip side, the older players can be expected to regress, but for the Eagles that’s not that big of a factor.  It’s not as if Trent Cole was a star last season.  I’m definitely worried about Demeco Ryans, but moreso regarding the injury risk he presents.  If he or Barwin goes down, the Eagles are in trouble.  For an upside case, though, we can assume they stay healthy.  In light of that, some improvement from last season (-2.5%) is in order.  For an upside assumption, I’ll set the defense at +10%.  That’s definitely bullish, but it is an upside case, and if certain players develop I can absolutely see the Eagles hitting it.

Base Case

My base case on Offense sees the Eagles suffering a little regression.  As I mentioned above, Foles really can’t be as good as he was last season, the loss of DeSean will hurt the PA game, and the offensive line won’t be as stable.  The good news is that Chip Kelly is still the coach and Shady is still the running back.  With those two on board, it really shouldn’t be difficult to field a good offense.  Meeting last year’s performance (+18.6%) , though, is unlikely.  Dialing that in a bit, I’m setting my base case offense at +13%.

On defense, last season is a good benchmark.  The roster hasn’t changed too much, at least at the top.  There’s better depth as well, though obviously still a few holes.  Last year’s team wasn’t particularly lucky, so there’s not much regression to factor in.  All together, modest improvement is our most reasonable expectation.  That puts us just above league average.  For an assumption, I’ll set the base case defense at +2.5% (a relative improvement of 5% over last season).

Downside Case

Now for the messy stuff.  What could go wrong?  Well…a lot.  While we’re not concerned with true tail risk (Foles/Shady getting hurt), we do need to look for negative events/scenarios that are reasonably likely to occur.  On offense, this means Foles regresses more than we’re hoping.  Health regresses past the mean and the team suffers worse than expected.  Jeremy Maclin doesn’t provide anywhere near the impact Jackson did and the young WRs/TEs aren’t quite ready to fill the void.  Those are all very plausible outcomes, but they’re unlikely to all occur.  One or two of them will leave the team worse off, but I still think that puts them above league average.  Worse than that is definitely possible, but that’s too negative for our projection here.  Hence, our downside case on offense will be +5%.  

On defense, things are fairly static, for reasons explained above.  Not much has changed.  There are still a lot of weaknesses though, which means our downside case can’t be too rosy.  There’s no guarantee that players like Cox, Kendricks, Logan, Boykin, etc. will get better.  If they don’t, then a single injury could leave the Eagles worse off on defense than they were last season.  Demeco Ryans is a prime candidate for decline, and depth behind him isn’t good.  If those things happen, we’re not looking at the absolute catastrophe we saw in 2012, but it will still be pretty bad.  Last year the Eagles were 2.5% worse than league average in Points Allowed.  I’m setting the downside this year is -10%.

All together, this is what our projections look like:

Screen Shot 2014-09-07 at 12.22.31 PM

For reference, this is what last year’s looked like:

The comparison is interesting, and really highlights the reasoning behind the projections. Offense is much more certain than last season.  I might be too pessimistic in our downside scenario this year, but I really do see a lot of risks.  I also think Jackson is a bigger loss than most fans realize.  Time will tell if that’s correct.  On defense, things look very similar.  We’re expecting modest improvement across the board, and that is reflected in each one of our assumptions.  Overall the range of outcomes on defense is very close to last year, but the mean expectation has improved.

Using our assumptions, we get the following potential outcomes.  Remember that we’re using Pythagorean Wins here with an exponent of 2.67:

Screen Shot 2014-09-07 at 12.32.10 PM

There it is.  Your 2014 projections.  The average outcome is 9.3 wins, which I think is still good enough for the division title.  Note that there are a lot of very reasonable scenarios where the Eagles fail to win 9 games.  As I’ve said previously, I think this season is going to  be much less fun than last season, albeit with similar results.  Expectations have shifted, and they’ve shifted too fast in my opinion.  The team is still building and there are still a lot of holes to fill.  I’d love to see a 12 win season where the Eagles run away with the division and make a deep playoff run, but that’s not an objectively reasonable expectation given what we know right now.

One last note: this is by no means a reflection of all potential outcomes (not even close).  What I am really trying to do is provide an outline for the middle of the Eagles expected performance distribution.  That way we can set our expectations and use it to guide our thinking as the season progresses.  In light of this, an 8 win season really isn’t bad, but my guess is many people would be very disappointed by that.  If Foles/Shady go down, 5-6 wins is a possibility.  If the Eagles get lucky, 12-13 wins is doable.  For a base-line expectation though, I’m sticking with what you see above.

With just minutes to spare, my season projection is:

9.3 wins, and a fan base with very mixed feelings.

Go Birds!


Regression Red Flags

The season is just one week away, and I haven’t been able to do anywhere near as much as I’d like to regarding a season preview.  However, I’ll try to remedy that this week, starting with a lightning-round style rundown of potential areas for regression.  Before I get there though, take a minute to download your copy of the 2014 Eagles Almanac here.  Just $10 for a PDF, and you’ll find a lot of great articles to get you ready for the season.

Now, the important things.

Before last season I spent a lot of time explaining why the Eagles would likely rebound strongly from the 4-12 season.  I projected the team to win 9 games and challenge for the division title when most pundits had them relegated to 5-6 wins.  What did I know that they didn’t?  Regression factors.

It won’t be news to any readers here, but there is a large degree of luck involved in nearly every aspect of the game of football.  A few specific areas, in fact, have a significant impact on the game and are almost entirely random.  That means we can get a lot of information about this year’s expected performance by looking at last year’s statistics and combing for outliers.  For example, the 2012 Eagles recovered just 35% of all fumbles.  Fumble recovery is almost all luck, and we’d expect a team to recover close to 50%.  That means, holding all other factors equal, the Eagles were likely to improve last year because they were very likely to recover a greater percentage of fumbles.  For the 2013 season, the Eagles actually recovered 43.75% of all fumbles.  That’s still less than we’d expect, but it’s a sizable improvement from 2012.

Now that I’ve explained it, let’s take a look at a handful of specific areas for which we’d expect mean-regression.

Pythagorean Expectation

This isn’t really a “mean-regression” candidate, but it’s vital to point out.  Last season the Eagles scored 442 points and allowed 382 points.  That performance would lead us to expect a Win/Loss record of 9.4-6.6 (from Pro-football-reference.com).  The upshot is that the Eagles record was slightly better than they “deserved”.  A difference of .6 wins isn’t big, but the direction is important.  The Eagles weren’t quite as good as their record from last year suggests.

Fumbles and Fumble Recovery Rates

I covered this a bit in the example above, but this is pretty low-hanging fruit as far as statistics with the potential for mean-regression.  Last season, the Eagles recovered roughly 44% of all fumbles.  They fumbled the ball 1.1 times per game.  Both of those numbers are good news for Eagles fans.  1.1 fumbles per game is close to average, and a 44% recovery rate suggests the Eagles are more likely to be better this year than worse.

However, there is one potential flag.  Opponents fumbled the ball 1.7 times per game when playing the Eagles.  That placed them tied for 1st in the league (with 4 other teams). Now, if you remember this post from last year, you’ll know that there is no significant persistence in forced fumbles from year to year.  Here is the chart:

Therefore, we can’t say that the Eagles were “good” at forcing fumbles last year and will be again this year.   Instead, we can expect that other teams will NOT fumble the ball as often as they did last year.  That’s bad.

However, 1.7 fumbles per game is not an outrageous amount.  So while there will probably be some regression, it won’t be huge and it might also be balanced out with positive regression in the overall recovery rate.

Fumbles verdict:  Neutral

Injuries

I covered this a couple of weeks ago, but it’s important enough to repeat.  According to Football Outsiders, the Eagles were 2nd in the league last year in Adjusted Games Lost (behind Kansas City).  That means they were healthier than every other team, as measured by this statistic.  Here’s the good news:  AGL might persist.  I looked at this stat in last season’s run-up, and found a correlation value of .30.  So, at least within the data I had, a good performance in AGL one year DOES suggest an increased likelihood of a good performance the following year.  Also, we have Chip Kelly’s “sports science” regime to consider.  It’s certainly logical to believe improved nutrition and fitness will lead to fewer injuries.  This is actually a really important aspect of the Eagles season to track.  If Chip Kelly really can keep his team healthy to a greater extent than other teams, it will be a big advantage for the Eagles going forwards.

Overall, we still have to expect some regression.  The Eagles will probably not finish in the top 2 again in AGL.  Still, with the modest persistence in AGL and Chip Kelly’s focus, I don’t expect as much regression as we might otherwise assume.

Injuries verdict: Slight negative

Interceptions

I won’t spend much time on this one, because I cover it in the Almanac and have addressed it previously.  Basically, Nick Foles was so good last year at avoiding interceptions that it’s nearly impossible for him to duplicate that performance.  However, Foles college and rookie stats do suggest an ability to avoid interceptions.  Hence, I expect Foles to throw interceptions at a higher rate, but to still rank among the best in the league in that category.  All other things equal, though, this is a negative regression indicator for the team.

Interceptions verdict: Negative

Field Position

This one is a bit under-the-radar.  Net Starting Field position is a byproduct of both turnovers and special teams, making it largely random from year-to-year.  Here is a persistence chart showing 5 years of data from Football Outsiders (2008-2012):

The correlation value is 0.14.  That’s large enough to note, but shows there’s a very large degree of variance from year-to-year.

Last season, the Eagles Net Field Position was 0.93.  That means the offense, on average, started with the ball nearly one yard farther than the other team’s offense.   0.93 was good for 11th in the league last season.  For reference, the 2012 Eagles had a Net Field position value of -6.67 yards, worse than any team from last season.  Kansas City led the league last year with a value of +9.61 yards (which is ridiculous and will definitely regress).

I’ve already explained why the Eagles will likely be worse in the turnover department this year than last.  Thus, we should expect field position to be a bit worse.  However, we also have to account for special teams.  This is a bit qualitative, but it’s clear the Eagles roster is deeper this year than it was last year.  That should result in a stronger STs unit.  I don’t have much confidence in that “analysis”, though.  It sounds reasonable, but STs performance is very unpredictable.

Of course, there’s another major piece to this puzzle that I still haven’t mentioned….Alex Henery.  More accurately, the absence of Alex Henery.

According to Football Outsiders, the Eagles had the 2nd worst performance on kickoffs last season, and Henery had the lowest gross kickoff value in the league.  I have no idea how well Parkey will play, but at the very least, he has a stronger leg then Henery.  Again, that should result in better kickoff performance.  Last season the Eagles recorded touchbacks on just 40% of their kicks, which ranked 24th in the league.

So where does that leave us?  Well we should expect some negative regression due to worse performance in turnovers.  Conversely, special teams can be expected to improve a little, at least in the areas that most directly effect field position.

Field Position Verdict:  Neutral

Wrapping it up

There are other areas to explore, but these are the primary ones.  I know I haven’t said anything groundbreaking here, and this analysis isn’t nearly as fun as it was last year (when there were a LOT of areas with very large positive regression expectations).  However, this is, in general, very good news for Eagles fans.

It says, basically, that last year was not a fluke.  The Eagles improved greatly from 2012 to 2013, and whenever you see a 6-win jump in one year, you should look carefully for luck-driven performance.  That’s not the case here.  The Eagles didn’t win games last year because of anything unsustainable, with the notable exception of Foles interception rate.

Thus, we shouldn’t expect and significant negative regression.   The fill-side, of course, is that the team isn’t likely to get a natural boost from any luck-driven areas.  That means improvement, if it comes, will have to depend more heavily on the actual skill of the players.

Final note: remember that there’s no guarantee the Eagles will finish where we expect them to in any luck-driven category.  Just because the “natural” recovery rate for fumbles is 50% doesn’t mean the team will hit it.  As explained above, teams can and do deviate significantly from the mean every year.  Just because the Eagles weren’t particularly lucky last year doesn’t mean they won’t be unlucky this year.  It’s just not our expectation.

2014 Risk Factors: Injuries

As you all know, we should be thinking about this season in terms of an expected performance distribution.  There are a range of outcomes for the Eagles this season, which varying probabilities for each related to how good/bad the team is.  Today, I want to first talk conceptually about the distribution shape.  Then I’ll move into the main topic: Injuries.

I’m going to assume everyone knows the basics of a Normal Distribution (Bell Curve).  I’ve used it often enough here that it shouldn’t be unknown.  The relevant question is: how do NFL team performance distributions compare?  Using the Normal curve as a baseline allows us to logic our way through certain adjustments, leading us to a better mental model for understanding ex-ante team expectations.

I’m primarily concerned with two dimensions: kurtosis and skew.  Skew is relatively self-evident, and more important for our topic today.  It relates to the symmetry of the distribution and the existence of outliers to either side.  Kurtosis isn’t as well known.  It also relates to the shape of the curve, but concerns the degree of peakedness vs. heavy tails.  In other words, kurtosis tells us how much data is located in the center of the distribution (or, conversely, NOT near the center).  Here’s a visual example:

Screen Shot 2014-08-07 at 10.51.33 AM

Now, to the good stuff.

What do we think the shapes of NFL performance distributions are?

I don’t have any data (yet), so we’re operating conceptually (as usual).  Let’s start with Kurtosis, because it’s relatively straightforward and not as important for out topic today.  In generally, I think NFL distributions are fairly Platykurtic.  There is a LOT of luck in the NFL.  That means a team’s “true” performance level is less likely to actually manifest than if there was little luck.  That means ANY projection we make is fairly uncertain.  As a result, it’s not enough to just say “expect 9 wins”.  Any projection of value will also include an expected range, or at least some explanation of downside/upside outcomes.

Now let’s look at skew, because that’s the more relevant measure right now.  Perhaps the most important thing to note here is that performance for an NFL team, as I’ve defined it here (Wins), is bounded on both sides.  No matter how bad a team is, it can’t win fewer than 0 games.  No matter how good it is, it can’t win 16 games.  Hence, when we’re looking at expected performance in terms of wins, the potential for outliers is limited.  Taking the next step, that means the distributions almost certainly are skewed for every team, provided we accept one more assumption as true: it is possibly, at least in theory, for a team to achieve every possible outcome (0 – 16 wins), regardless of “true” ability or expectation.  The Seahawks will almost certainly will more than 0 games this year…but it’s possible.  Even if the odds of that outcome are extremely small, if they exist they must be present on the distribution curve.

Similarly, a bad team will almost certainly not win 16 games.  But an extraordinary run of luck (like opposing injuries) could, in theory, produce a very positive outcome, up to and including 16 wins.  Again, the odds are close to zero, but they exist.

Therefore, an expected performance distribution for the Seahawks might look like this, with the X-axis representing 0 – 16 wins as you move from left to right:

Screen Shot 2014-08-07 at 11.04.10 AM

That curve is negatively skewed, as are the curves for most “good” teams, for reasons I explained above.

Now that we’ve settled that, we need to think about the reasons a good team might end up in the left side of the curve.  Put differently, we know that the Eagles are a relatively “good” team.  While their curve isn’t nearly as skewed as the Seahawks’, I do believe it’s still negatively skewed.  Given that, we can start to think about WHY, beyond the theoretical reasons (bounded range of outcomes), a team’s left tail might exist/be significant.

The most obvious reason is injuries.

Injuries, especially those to star players, present the type of negative events that can result in a team finishing with an outcome towards the left side of the distribution.  Here’s the important part: the Eagles are particularly susceptible this year, hence the team’s left tail is likely a bit larger than usual.  That’s also a big reason why I’m keeping my expectations for the team’s win total in check.  Outliers to the left side or a fat left tail will pull the mean of the distribution down.  So if we’re just talking about average expected wins (there are certainly other ways to look at this), the Eagles “true” level is likely lower than many fans believe.

If Nick Foles goes down….. If LeSean McCoy goes down….. If anyone on the offensive line goes down….

The Eagles are currently heavily dependent on just a few players.  The defensive depth chart improved a bit this offseason, but the offense (largely responsible for the team’s performance las year) is still very brittle.  The problem is, that brittleness was not readily apparent last year, and therefore is likely to be under-appreciated this year.

Last season, the Eagles ranked 2nd overall in Adjusted Games Lost, a measure from Football Outsiders that quantifies the impact of injuries a team suffers over the course of a season.  Here’s how the site describes it:

With Football Outsiders’ Adjusted Games Lost (AGL) metric, we are able to quantify how much teams were affected by injuries based on two principles: (1) Injuries to starters, injury replacements and important situational reserves matter more than injuries to bench warmers; and (2) Injured players who do take the field are usually playing with reduced ability, which is why Adjusted Games Lost is based not strictly on whether the player is active for the game or not, but instead is based on the player’s listed status that week (IR/PUP, out, doubtful, questionable or probable).

In 2012, the Eagles ranked 18th overall.

Clearly, they were more effected by injuries in 2012 than they were last year.  Similarly, the fact that the Eagles ranked 2nd last year combined with the relatively uncertain (non-persistant) nature of injuries means we should expect some mean-reversion.  Basically, it’s likely the Eagles will be more negatively effected by injuries this year, relative to other teams, than they were last season.

Of course, that itself doesn’t tell us much.  We also need to know it injuries, as measured by AGL, actually affect performance (as measured by Wins).  Well here’s the scatterplot showing AGL and corresponding Wins from 2009-2013.

Screen Shot 2014-08-07 at 11.28.28 AM

As you can see, there’s good news and bad news.  The correlation value is -.185.  If the Eagles revert towards the mean (as I expect them to), they’ll be relatively worse off than last year.  However, the correlation is relatively weak, so the effect might not be catastrophic.

Anecdotally, though, I think there’s reason to be concerned, particularly because I don’t like the QB/RB Depth Chart.  An injury to a starter is bad (and shows up in AGL).  However, if the drop-off in talent to the next guy isn’t huge, the effect won’t be significant.  Unfortunately, the Eagles don’t have that luxury at QB.  Moreover, LeSean McCoy is SO good that it’s really impossible to keep the gap between him and the 2nd stringer small.

I should probably note here that I’m not trying to be overly pessimistic here.  However, if we want to create a reasonably accurate performance expectation, we need to look carefully for risk factors.

Injuries are always a major risk factor.  But in the Eagles’ case, I think the risk is atypically large this year.  That doesn’t mean they’ll occur, but it does mean or ex-ante projection needs to account for them.

There’s much more to say around this topic, and I want to present a new version of the Depth Chart Over Time that will make potential injury risk more obvious.  For now though, believe in the Eagles this year, but recognize that the existence of serious downside potential (negatively skewed) results in a mean win expectation that is lower than some might expect (I’ll get a number on it before the season starts).  We can talk about median expectations some other time….

Nick Foles YPA Projection; An Eagles Almanac Preview

Update: The Almanac is now available for preorder at http://www.eaglesalmanac.com.

Apologies for the lack of posts over the past couple of weeks.  I’ll remain on a very intermittent schedule for the next couple weeks, but after that my schedule clears a bit and I hope to return to a more consistent schedule just in time for training camp to ramp up.

For today, I’m teasing a section of my article for the 2014 Eagles Almanac.  I hope you all purchased it last year and, more importantly, I hope you all enjoyed it.  For those unaware, a group of the best Eagles bloggers puts together an annual season preview magazine.  I contributed last year and will do so again this year.  I promise you there is no better way to get ready and excited for the upcoming season.  Stay tuned for an announcement on its release date and where/how you can get it.

For my piece, I examined Nick Foles performance last year through the lens of his QB Rating.  I pulled it apart and looked at each of his component statistics, then provided context and a projection.  At the end, I put those projections back together to come up with a final QB Rating and stat line that will form my baseline expectation for Nick Foles’ performance next year.  Here is the Yards Per Attempt section.  Note that I have yet to edit it or really re-read it in great detail, as I just finished it; so sorry for any typos/mistakes.

——

Yards per Attempt

Last season, Nick Foles recorded 9.1 Yards per attempt, placing him first in the league.  For his career, Foles’ yards per attempt now stands at 7.9.  Of course, the scheme he is playing in now bears very little resemblance to the one he played in his rookie year, so the quality of that information is suspect.  Of the 37 QBs who qualify under Pro-Football-Reference.com’s leaderboard, the median value was 7.0 yards per attempt.  Clearly, Foles’ performance was a relative outlier.  Aaron Rodgers, second overall, registered a YPA of 8.7 and Peyton Manning, third overall, had just 8.3 YPA.  Historically, Foles 9.1 YPA ranks 19th overall.  However, many of the greatest YPA attempt seasons occurred in a different era (mostly completed by Otto Graham).  Post-merger, Foles’ 2013 season ranks 8th overall.  Is that good?

Well, for a little more context, let’s take a look at the best performances by some other QBs.  The only ones to top Foles are Warner, Chandler, Stabler, Rodgers, Dickey, Esiason, and Manning (the good one).  Notice that no player topped Foles more than once.  Joe Montana’s best YPA season merely tied Foles.  Beyond that, the only players to crack the 9.0 YPA barrier were Bert Jones, Steve Young, and Dan Marino.  Again, nobody in the modern NFL has every cracked 9.0 YPA more than once.  That doesn’t mean it’s impossible to do, but it definitely means that it’s extremely difficult.

So how did Foles do it?  Beyond the factors mentioned above (good team health and a low drop percentage), I’m sorry to say that there’s one particular factor that looms large when looking at YPA.  Perhaps you’re tired of thinking about him, but there’s really no way around it in this context: DeSean Jackson was a huge boon to Foles’ YPA in 2013.  Part of what made Foles’ YPA so great last year was his remarkable success on deep passes.  According to PFF, 17.4% of Foles’ total attempts went farther than 20 yards.  On those plays, Foles registered 14 TDs against just 1 interception.  More clearly, here is part of a chart from PFF, showing Foles’ rating by area of the field (I’ve only included the 20+ yard section):

Screen Shot 2014-07-14 at 11.29.51 AM

As you can see, Foles performed much better when his deep passes were targeted at the middle or right side of the field.  Now, which WR do you think was in that area most often?  Here’s the corresponding chart for DeSean Jackson:

Screen Shot 2014-07-14 at 11.33.10 AM

The first number is targets, the second is receptions.  Comparing the two, it’s abundantly clear that Foles’ deep passing success, a major factor in his great YPA (and every other statistic) was highly correlated with DeSean Jackson’s.  There’s naturally a problem of causation here, maybe Jackson played so well because Foles was so great at getting him the ball downfield. (Yes, Vick threw some of those passes to Jackson, but most were indeed thrown by Foles. I think somebody, maybe me, tackled the Vick/Foles/Jackson conundrum a few months ago.)   Looking at Riley Cooper’s chart supports that theory a bit:

Screen Shot 2014-07-14 at 11.35.55 AM

However, look closely at the target numbers (the first listed).  Jackson was target far more often than Cooper (as he should have been), meaning the bulk of Foles performance was in combination with Jackson.  Regardless of who you believe was more responsible for the performance, the fact that Foles and Jackson no longer play together is a bright red flag for a potential change in performance.

To reiterate, Foles YPA performance last year was phenomenal, and very unlikely to be reproduced, even if every factor from last year’s team was reproduced.  The loss of his best deep threat, Jackson, provides even more opportunity for variance from his performance.  As I showed above, any change from last year in Foles’ YPA is almost certain to be negative.

Now the important question: What can we expect this year?

Let’s take a look at the other QBs who registered 9.0+ YPA seasons.  What did they do over the course of their career?  Here is the chart:

Screen Shot 2014-07-15 at 9.24.57 AM

Wow…that’s a bit worse than I expected.  Granted, we have to at least mention the fact that NFL offenses have evolved since most of these players played, and it’s now easier to achieve a high YPA.  However, the fact that only two of the players on that list even cracked 8.0 YPA for their career’s speaks volumes to just how unusual Foles’ 2013 campaign was.  Even Aaron Rodgers, on his way to perhaps the greatest QB career of all-time, has a career YPA nearly a full yard worse than Foles’ 2013 measure.  So yes, it’s safe to say Foles will not put up 9.1 YPA again next season.

Remember that the median value for QBs with 50%+ snaps last year was 7.0 YPA.  Just 6 players of those players had greater than 8.0 YPA.  Now, I want to make it clear that I think Foles will still produce a strong YPA this season.  As I showed, while DeSean was a major force, Cooper also put up sterling deep passing (receiving) stats last season.  Jeremy Maclin, in 2012, also had very strong deep-ball numbers.  Thus, I think league average or median is overly pessimistic.  This is still Chip Kelly’s offense and there are still good players here.  However, we also can’t pencil in 9.0 yards per attempt, at least not with a straight face.  Looking at last season’s leaders, the historical comparisons, and the quirks of the Eagles’ offense, I think somewhere between 7.5 and 8.5 is fair, and if I had to narrow that range I’d put it at 7.5 to 8.3.  Taking the midpoint, that gives us a rough projection of 7.9 YPA.  That’s still very good, it would have ranked 7th overall (tied with Drew Brees) last season.  But that’s a BIG decline from 9.1.

——-

In the full article, I also make projections for Completion %, TD Rate, and Interception Rate.  Using those numbers, I also provide projections for QB Rating, Yards, TDs, and INTs.

Special Teams Persistence and a few notes

A couple of notes before we talk about Special Teams:

– This Saturday, June 7th, there is an Eagles signing event at the Rockvale Outlets in Lancaster.  Brandon Boykin, Jon Dorenbos, and potentially two other players will be signing autographs from 11 am – 3 pm outside the Eagles Outlet Store.  Swoop and the Cheerleaders will also be there.  The event page is here: https://www.facebook.com/events/1604355479789634/.  I’ve been to this store several times; it’s worth the drive if you’re looking to stock up on Eagles merchandise (or just need gift ideas for friends).  (Note this is not a paid advertisement, but my father does manage the center.)

– If you’re bored at work on Friday afternoons, give these guys a listen: http://sportsandrants.blogspot.com/p/show-segments.html.  Two guys at St Josephs University do a sports talk show from Noon to 2 pm.  They’ve got a site set up (linked above) with their past segments and interviews.  I usually can’t stand the major Philly Sports talk radio (big surprise), so these guys might be a nice change of pace.  Regardless, always nice to give the young’uns a chance.  You can also follow them on Twitter @SportsAndRants.

———-

Now, Special Teams.

I’ve spent most of my time discussing the offense and defense.  Today let’s start our analysis of Special Teams.  The Eagles have made a number of roster moves this offseason that will change the composition of the STs unit.  That might be a good thing.  Last year the team ranked 25th overall by DVOA (Football Outsiders).  Of course, if changing personnel can HELP the unit’s performance, it can also hurt, so we need to be careful with the assumptions we make.  Unfortunately, the biggest single contributor, Alex Henery, is still on the team.  MurderLeg might give him some competition, but Henery has to be the large favorite for the full-time job.

Before we start analyzing the actual roster moves and the potential consequences, we should probably check the data to see if it even matters.  In other words, is Special Teams performance largely skill or luck?  If it’s luck, it doesn’t really matter what players you run out there (within reason).  Of course, Eagles fans should actually hope it’s largely luck-driven, since that means an improvement is likely (given the poor previous performance). So what does the data say?

I took the last 10 years of DVOA statistics from Football Outsiders and checked for persistence.  Here is the graph:

Screen Shot 2014-06-02 at 11.57.01 AM

That’s not what I was expecting.  My ex-ante hypothesis was that STs performance does not persist with any significance.  The data, however, give us a correlation value of 0.29, which is relatively strong.  That means last year’s performance DOES give some indication of what we can expect next season, though it’s far from determinative.

In the near future, I’ll pull this apart and look at the individual factors that comprise the FO data.  That might shed some more light on what we can reasonably expect from the team this year.  For example, last season the Eagles ranked 11th in “Hidden Points”, which are the factors outside their control (like opposing kickoff distance, opp. FG accuracy, etc…).  Conversely, the team ranked just 18th in Weather Points, meaning they were harmed more than average by Weather effects, though since they play outside we may not be able to expect regression there.   As you can see, there’s much more to do here.

The overall takeaway, though, is important.  Special Teams performance, as measured by DVOA, DOES persist with relatively significant strength.  That might mean we shouldn’t expect a great STs unit this year.  OR, it might mean that significant roster turnover within the unit will provide a bigger boost than some of us expect.

Finally, here are some notes from the data:

– Over the past 10 years, Chicago leads the league with an average STs DVOA of 5.07%.  Cleveland is second with an average of 4.12%.  In case you didn’t realize, STs have an effect on the outcome of the game, but not a large one.

– Indianapolis has the worst average over the past 10 years, with a DVOA of -3.10%.  Washington is next with an average of -2.57%.

– The Eagles have an average STs DVOA of 0.15%.  The worst year for the team was in 2007, when it registered a DVOA of -6.40%.  The best season of the past 10 years was way back in 2004, when the team scored a 6.80%

– The worst single season score within the entire sample belongs to the Washington Racists Football Team from last year.  They registered a DVOA of -12.0%, which is remarkable.  The best single season was by Chicago in 2007, with a score of 11.20%.  That was the year Devin Hester had 6 kick/punt returns for a touchdown.  However, the Bears still won just 7 games that season.


Hacking the Draft

For those of you who don’t remember, last season I did a historical analysis of draft pick success according to position and round.  Below is one of the posts stemming from that project.  At the bottom are two charts showing round-by-round probabilities.   Note: counting someone as a “starter” is a bit subjective.  Inclusion in the below data means that a player started for at least 5 years in the league (according to Pro-Football-Reference), or if they joined the league less than 5 years ago, has started for more than half the time.  The sample is all players drafted between 1999 and 2011.

Hopefully everyone has enjoyed the round-by-round breakdown.  While there are obviously a number of variables that can’t be controlled for, the pure statistical look at each position group has already provided some interesting insight.

Before I get to the big chart, let me just clarify exactly what I think this type of analysis is good for, then dig into an Eagles example.  Feel free to skip to the chart and come back.

The purpose of this is NOT to arrive at a set of rules by which teams should draft players.  Instead, it is meant to provide a general guideline, or a “default draft position”.  For example, yesterday I said that selecting DEs in the 3rd round is a terrible value proposition according to the data I’ve collected.  That doesn’t mean drafting a DE in the 3rd round is ALWAYS a terrible decision, it just means that for a team to make that decision, it must see or know something about the subject player that makes him CLEARLY much better than any other prospect available at that position.

The biggest flaw in NFL draft strategy, as far as I can tell, is each team’s confidence in its own ability to evaluate talent.  Regardless of the general manager, every team has historically had a very large margin of error when it comes to talent evaluation.  For instance, in the 1st round less than 6 in 10 LBs selected from 1999-2011 had or are having significantly productive careers (according to our definition.)

So what does that mean?  It means teams, in general, should be mostly focused on value during the draft, as opposed to parsing prospects.  This is perhaps never more apparent than when a team decides to trade up to select someone.  Let’s use the Eagles as an example.  NOTE: This is a very rough example, with numbers pulled from my ass, and is only meant to illustrate a larger point.

When the team traded up for Brandon Graham, it swapped 1st round picks with Denver and gave up two 3rd rounders as well (moving up from 24 to 13).

At the 13th pick, no DEs had been taken.  Between picks 13 and 24, 3 were taken, including Graham.  So that means the Eagles, in their analysis, decided that they had to take a DE (will not argue that decision here, though I was mad they passed on Earl Thomas, and can produce witnesses that will verify I said that when it happened).

The only way the trade made sense was if the Eagles, in their DE analysis, decided that the odds of Graham becoming a stud DE were MUCH higher than the odds of JPP, Morgan, or Hughes becoming a stud DE.  Here is where the “margin of evaluation error” comes into play.

Using our historical draft data, we can calculate the odds of getting a starting DE with a 1st round pick and two 3rd round picks (I realize they were hoping more than an average starter, but stay with me).  Using the table below, we can calculate those odds to be 81.5%.  Using the Pro Bowl percentages from the earlier tables, we arrive at 37% for the odds of getting a Pro Bowl DE if you select DEs with a 1st round pick and 2 third round picks.  So here is the breakdown for “generic DEs”:

– 1st Round Pick – 24% chance of Pro Bowl, 67% chance of starting

– 1st Round Pick and 2 third round picks – 37% Pro Bowl, 81.5% starting.

Please note that this DOES NOT mean the Eagles made a bad decision.  Obviously the odds should be better for the 13th pick than for the 24th pick (we’ll get to that another time).  It DOES MEAN, however, that the Eagles, in their evaluation of Brandon Graham, should have been almost certain that he was more than 37% likely to be Pro-Bowl caliber, and more than 81.5% likely to start.

I have no doubt that they believed this, BUT, if they had applied a margin of error to their own analysis (as any good team should) prior to making the trade, they would have been unlikely to go through with it.  Let’s be extremely generous and assume the Eagles front office could peg these odds with a MOE of +/- 15% (WARNING: overly simplified statistics).   That means if they estimated Graham had a 90% chance of starting, his true odds of starting were almost definitely between 75-100%.

Immediately we can see an issue.  Even giving Graham incredibly high odds of starting (90%, which is more bullish than any team should be with any players outside the top few picks) and the Eagles a very generous MOE (+/-15%), the resulting range still does not exclude the 81.5% starting odds for the generic position of a first and two thirds (although it is near the bottom of that range).

That means the Eagles really should NOT have been (though I’m sure they were) confident that Graham would be better than just taking whichever DEs were available at #24 and in the third round, and hence, should not have made the trade.

I don’t mean to suggest that trading up is never a good idea, simply that the evaluative bar for whichever prospect is the target must be EXTREMELY high, and much higher than the standard currently being applied by most teams.

My final point:  Teams do not appear to take a probabilistic approach to drafting (which they almost certainly should), and I would guess that they do not actively overlay a margin of error onto their evaluations.  This is very much a “new-school vs. old-school” issue, similar to the statistical revolution in baseball, but IT IS NOT THE SAME.  It is largely a matter of GMs being willing to recognize and account for their own shortcomings and cognitive biases.  The franchises that can apply this will, in the long run, be more successful than those that don’t.  (Looking into which teams might be using this type of strategy will be another day’s post)

Ok, enough talk.  Here is the chart with every round included. I removed the All-Pro and Pro Bowl columns to make it easier to compare.  Dig into it and see what you think.  Later this week we’ll mine it for an “optimal default strategy”.

I updated the chart soon after the original post,  here is the updated version; so the numbers might not match the post exactly.  The original is reproduced below.

Screen Shot 2014-05-07 at 10.29.30 AM

Screen Shot 2013-01-29 at 10.54.06 AM

Examining the WR prospect tiers

There’s a lot of talk about the Eagles potentially trading up for a WR, or at least taking one with their 1st round pick.  Peter King has them giving up their 1st and 2nd round pick to get Odell Beckham Jr.  I’ve been very clear about why I think this is a poor strategy (trading UP for a WR is an unbelievably bad decision).  For more on those reasons, see my last post.  Today, though, I wanted to look at it from a different angle and discuss things in light of what the actual WR class looks like.  Previously, I left it at “it’s deep”, which doesn’t really provide the full context.

From my TPR rankings, here are the top 10 WRs in the draft.  Remember, since each of these guys play the same position and I took individual standard deviation out of the formula, these relative rankings are purely rankings are primarily the result of the NFL.com, ESPN, and NFP grades.  The multiplier stratifies the class a bit, but the effect is small.

Screen Shot 2014-05-06 at 10.04.32 AM

We can ignore Sammy Watkins and Mike Evans.  I’m sure Chip would love to grab Evans, but it’s extremely unlikely he falls out of the first 10 picks.

Instead, let’s focus on the second tier, the yellow shaded area.  Here we have four WRs that have all, at various points in time, been linked to the Eagles.  If the Eagles come out of the 1st round with a WR, it’s nearly a certainty that it’s one of these four guys.  But that’s not what we’re here for, is it?

Looks closely at each of those prospects and look at the grade assigned.  Now, how certain are you that you can identify which one will be the best NFL player?   “Not at all” is the correct answer.  I’m sure the Eagles have different grades and a different order of players, but the fundamentals are the same.  You need to ask yourself two questions:  How big is the difference between each prospect’s grade?  How big is the margin of error in our evaluations?

Within each tier, the MOE (if you’re being honest) is almost definitely larger than the difference in grades.  Therefore, practically speaking, they all have the same grade.  I other words, they all have the same expected value.

So why would you want to pay more for one of them than they other?

Now, let’s take aim at Peter King’s rumor, which is:

Eagles trade up for the 15th pick and select Beckham.

First, let’s see how necessary that trade is.  If they complete it, obviously they get Beckham.  If not, though, how likely is he to be available at the 22nd pick?

Well it just so happens that Brian Burke of advancedfootballanalytics.com (new name) has just released a Bayesian prediction model for the draft.  Obviously, we can’t put too much weight into this just yet, but it’s a very good representation of the type of thinking every team should be doing.  Here is Beckham’s output:

Screen Shot 2014-05-06 at 10.25.12 AM

According to this model, there is just a 7% chance that Beckham is available at the 22nd pick.  There is a 53% chance he is available at the 15th pick.  The Eagles would only make the trade if he was actually available at 15, so we don’t have to worry about that second probability.  Just note that it’s basically a flag that says: even if the Eagles and Steelers want to make that trade, there’s a 50/50 chance it won’t happen.

So, if the Eagles want Beckham, it looks like they really do need to move up.  How about the other guys in that tier?

There is a 51% chance that Marqise Lee will be available at 22.

There is a 21% chance that Brandon Cooks will be there at 22.

There is a 92% chance that Kelvin Benjamin is there at 22.

Now, these aren’t completely independent probabilities, so what I’m about to do isn’t 100% “correct”, but it’s not unreasonable either.  Combining those probabilities leaves us with a:

.49 * .79 * .08 = .03 or 3% chance that none are available.

So, the Eagles can give up their 2nd round pick for a 100% chance of Beckham, or they can keep their pick and have a 97% chance at one of the other three guys in that same tier.

Now can you see why trading up is such a terrible value?  We’ve already covered the margin of error issues.  Regardless of which players are in the same tier, conceptually they are all worth the same “value”.  So if the Eagles tiers looked like mine, they’d essentially be trading a 2nd round pick for a 3% increase in the odds of getting a WR from their desired tier.

That’s also known as a catastrophically bad use of resources.

Now let’s look at it a little differently.  Let’s say the Eagles do have Beckham rated significantly higher than the other three guys in that tier.  The operative question then becomes: how much higher?

This is important because we have to account for the opportunity cost of the 2nd round pick (which is large).  That brings me to the concept of saturation drafting.  In short, there’s no rule against using multiple picks in one draft on the same position.  For example, let’s say the Eagles have decided they NEED a star WR out of this draft.  They can:

A) Do Peter Kings trade, after which their odds of gaining a star WR will be whatever the odds of Beckham becoming one are.

OR

B) They can NOT trade their 2nd round pick, and use it on ANOTHER WR!

To examine this possibility we need to know who will be available in round 2.  Let’s move to the next tier on our list.  This one:

Screen Shot 2014-05-06 at 10.47.24 AM

What are the odds those players are available at the 54th pick?

Davonte Adams – 38%

Jarvis Landry – 62%

Cody Latimer – 8%

Jordan Matthews – 37%

Once again, they’re all in the same tier, and the individual margin of error means they each of roughly the same expected value.  Given the odds above, that means there is a:

.62 * .38 * .92 * .63 = .136  that none of those guys are available at 54.  Flipped around, that means there is a 86% chance one of those players will be available at 54.

Going back to our two options, that means the Eagles, spending the same amount of draft resources, can have:

100% chance of Beckham

OR

97% chance at a player like Marqise Lee AND an 86% chance at a player like Jordan Matthews.

Now, if you NEEDED a star WR, would you choose option A or B?  That ignores a lot of other options (for example, you could trade up in round 2 to give yourself a 100% chance of a 3rd tier WR), but it lays out the conceptual problems with trading up for a WR in round 1.

That’s a very long way of saying what I’ve said before:  If you are going to trade up for anyone, ESPECIALLY a WR, you need to be extremely confident he’s much better than the next guy.  Realistically, I just don’t see how the Eagles could possibly be that confident.

Therefore, trading up for a WR is a very poor strategic decision.  Remember, you’re not picking players, you’re picking lottery tickets.  Each one carries a different likelihood of “hitting”, but they all have risk of busting.  All you’re trying to do is maximize your odds.

The Eagles rankings undoubtedly look different from the tiers I’ve used above, but it really doesn’t matter what names you put in which tier.  Unless the Eagles think the gap between Beckham (or whomever) is EXTREMELY LARGE, trading up doesn’t make any sense.

Lastly, I’ll leave you with some spider graphs (from mockdraftable.com):Screen Shot 2014-05-06 at 11.01.38 AMScreen Shot 2014-05-06 at 11.02.14 AM

Screen Shot 2014-05-06 at 11.03.16 AMScreen Shot 2014-05-06 at 11.03.55 AM

Screen Shot 2014-05-06 at 11.05.11 AM


More on DeSean

I told you there was more…today I’ll try to knock a few more things off the list.  For this post, I want to focus entirely on the 2013 season.  While it’s not a large sample, it does represent the “DeSean under Chip” timeframe.  Seeing as how Chip Kelly remains the coach, it seems as though this might be pretty relevant information with which to evaluate DeSean’s importance to the team for next season.

So just how good was DeSean’s 2013 season?

Yesterday I covered Approximate Value and Receiving Yards.  Instead of repeating the analysis, I’ll just say that DeSean had a 2013 AV of 11 and 1332 receiving yards.  That puts him in a tie for 10th in Approximate Value and 9th in yards.

That’s really good, but hardly spectacular.

BUT…(you knew that was coming), there’s more to consider.   Beyond the production, there’s the qualitative (for now) value that DeSean adds to the offense.  His unique talent opens up the offense for the rest of the team, with the benefit redounding to other members of the offense rather than appearing in his stat line.  Let’s go beyond the generic “his speed stretches the defense” and try to illustrate, with stats, what makes him unique.

Below is a chart illustrating the Catch Rate for a sample of WRs along with their Deep Pass Attempt %.  These numbers are from AdvancedNFLStats.com.  For the sample, I included every WR who had 40 or more receptions last season.

Screen Shot 2014-03-26 at 6.16.05 PM

I added the trend line to illustrate the correlation (value is -.25).  That’s fairly intuitive.  Longer passes are harder to complete, so the catch rate for “deep threats” should be relatively lower.

Now let’s play a game.  Go to the chart above.  Using just the information displayed, which WR would you want on your team?

I think the answer is pretty obvious, but it might depend on your personal offensive philosophy.  However, regardless of your philosophy, it’s clear there are only a couple of logically defensible choices.  Now let me try to guess which one you chose.

Screen Shot 2014-03-26 at 6.17.43 PM

I thought so.  Now for the fun part.  As you might have guessed, the player I highlighted above is DeSean Jackson.  He’s a fairly significant outlier.  In other words, given the frequency with which his targets were “deep”, we’d expect his catch rate to be much lower.

In fact, just two other qualifying players had Deep Pass Attempt rates above 40%, Torrey Smith and Reuben Randle.  Smith’s catch rate was 47.4%.  Randle’s was 52.6%.  DeSean’s was…65.1%.  Clearly, one of these guys is not like the others.

Now let’s sort by Catch Rate.  Here are the top 20 from last season (remember we’re only including WRs with 40+ receptions.)

Screen Shot 2014-03-26 at 6.23.47 PM

Notice anything interesting?  Look closely at the Deep Pass Attempt rate column.  Among the top 20, DeSean has, BY FAR, the highest percentage of deep pass attempts.  In fact, the next closest player above is Doug Baldwin at 32.9%.  That’s a huge difference.   Now let’s flip it slightly and sort by Deep Pass rate.

Screen Shot 2014-03-26 at 6.33.08 PM

So now we have all of the major “deep threats” represented.  Look at the Catch Rate.  Again, near the top of the list, DeSean blows everyone else away.  Also note that Riley Cooper now makes the list, with the 6th highest Deep Pass rate.  However, his catch rate is “just” 56.6%.  I say put “just” in quotations because that’s still a very good catch rate, as you can see from the chart.   But it’s nowhere near DeSean’s 65.1%.

So, last season DeSean had a Catch Rate similar to the best possession WRs in the game, just behind Wes Welker actually.  Of course, he did so while operating as a true “deep threat”.  That’s a unique, and extremely valuable combination.

You see, last year the Eagles were able to attack downfield with DeSean without taking the normal reduction in Catch Rate.  Obviously, that makes the offense extremely efficient and dangerous.  More to the point, not a single other WR in the game put up numbers anywhere close to DeSean, at least not while catching more than 40 passes.

Now, the caveats.  It was just one season, so it’s certainly possible that DeSean’s Catch Rate and Deep Pass Attempts combination is unsustainable.  We’ll just have to wait and see on this one.  Additionally, you could credit a lot of DeSean’s stats to the genius of Nick Foles.  That too is possible.  Of course, that’s a LOT of credit to give to a 2nd year QB with mediocre arm strength.  As always, the “truth” is probably a combination of several factors.  One of them, though, is DEFINITELY DeSean’s skill.

Is there more?  Well yes, lots more, but let’s keep things relatively short.  It turns out AdvancedNFLStats.com also tracks Expected Points Added.  I’ve used the Expected Points concept in great detail before, so I’m not going to do a full explanation here.  Anyway, here are the WRs who registered the highest EPA last season:

Screen Shot 2014-03-26 at 6.54.57 PM

Yep, that’s DeSean, ranked ahead of guys like Josh Gordon, Eric Decker, and Calvin Johnson.  On a per play basis, DeSean also ranked 3rd, behind only Anquan Boldin and Doug Baldwin.

Like I said yesterday, DeSean Jackson is a GREAT player.  We can argue about what he’s “worth” contract-wise.  We can argue about whether he fits the “culture” that the team is trying to develop.  We can argue about how he’ll perform as he gets older.  When it comes to production to date, though, there is no argument.  Since entering the league, Jackson has been among the most productive receivers in the game.  Last season, with Chip Kelly calling the shots and Nick Foles at QB, Jackson became a tremendously unique and valuable weapon.  Don’t lose sight of that.

Scheme Fit

My final comment is a short one.  There was some talk about DeSean not “fitting” the scheme that Chip Kelly is trying to run.  Without engaging completely, because I think that grants too much credit to what is a ridiculous argument, let me just say this:

1) Chip Kelly is a great, creative, perhaps genius-level offensive mind.

2) DeSean Jackson, as shown above, is a unique talent and the premier deep threat in the league.

I’ve pretty much proven the second statement.  If you’re going to make the “scheme” argument, it stands to reason then, that the first statement above cannot be true.  Put simply, if Chip Kelly can’t find a way to use DeSean Jackson in his scheme, then he’s not the offensive mastermind everyone believes he is.  Of course, he did find a way to use Jackson productively last season, so….I told you that argument was ridiculous.

 Update: I forgot to mention that DeSean ranked 11th by Win Probability Added (also from AdvancedNFLStats.com).  That’s good, but given the EPA numbers I expected him to be higher.  I haven’t quite figured out a reason for the discrepancy, hence why I didn’t talk about it.  However, I don’t want it to seem like I’m hiding “unfavorable” stats, so there you go.