
As you all know, we should be thinking about this season in terms of an expected performance distribution. There are a range of outcomes for the Eagles this season, which varying probabilities for each related to how good/bad the team is. Today, I want to first talk conceptually about the distribution shape. Then I’ll move into the main topic: Injuries.
I’m going to assume everyone knows the basics of a Normal Distribution (Bell Curve). I’ve used it often enough here that it shouldn’t be unknown. The relevant question is: how do NFL team performance distributions compare? Using the Normal curve as a baseline allows us to logic our way through certain adjustments, leading us to a better mental model for understanding ex-ante team expectations.
I’m primarily concerned with two dimensions: kurtosis and skew. Skew is relatively self-evident, and more important for our topic today. It relates to the symmetry of the distribution and the existence of outliers to either side. Kurtosis isn’t as well known. It also relates to the shape of the curve, but concerns the degree of peakedness vs. heavy tails. In other words, kurtosis tells us how much data is located in the center of the distribution (or, conversely, NOT near the center). Here’s a visual example:

Now, to the good stuff.
What do we think the shapes of NFL performance distributions are?
I don’t have any data (yet), so we’re operating conceptually (as usual). Let’s start with Kurtosis, because it’s relatively straightforward and not as important for out topic today. In generally, I think NFL distributions are fairly Platykurtic. There is a LOT of luck in the NFL. That means a team’s “true” performance level is less likely to actually manifest than if there was little luck. That means ANY projection we make is fairly uncertain. As a result, it’s not enough to just say “expect 9 wins”. Any projection of value will also include an expected range, or at least some explanation of downside/upside outcomes.
Now let’s look at skew, because that’s the more relevant measure right now. Perhaps the most important thing to note here is that performance for an NFL team, as I’ve defined it here (Wins), is bounded on both sides. No matter how bad a team is, it can’t win fewer than 0 games. No matter how good it is, it can’t win 16 games. Hence, when we’re looking at expected performance in terms of wins, the potential for outliers is limited. Taking the next step, that means the distributions almost certainly are skewed for every team, provided we accept one more assumption as true: it is possibly, at least in theory, for a team to achieve every possible outcome (0 – 16 wins), regardless of “true” ability or expectation. The Seahawks will almost certainly will more than 0 games this year…but it’s possible. Even if the odds of that outcome are extremely small, if they exist they must be present on the distribution curve.
Similarly, a bad team will almost certainly not win 16 games. But an extraordinary run of luck (like opposing injuries) could, in theory, produce a very positive outcome, up to and including 16 wins. Again, the odds are close to zero, but they exist.
Therefore, an expected performance distribution for the Seahawks might look like this, with the X-axis representing 0 – 16 wins as you move from left to right:

That curve is negatively skewed, as are the curves for most “good” teams, for reasons I explained above.
Now that we’ve settled that, we need to think about the reasons a good team might end up in the left side of the curve. Put differently, we know that the Eagles are a relatively “good” team. While their curve isn’t nearly as skewed as the Seahawks’, I do believe it’s still negatively skewed. Given that, we can start to think about WHY, beyond the theoretical reasons (bounded range of outcomes), a team’s left tail might exist/be significant.
The most obvious reason is injuries.
Injuries, especially those to star players, present the type of negative events that can result in a team finishing with an outcome towards the left side of the distribution. Here’s the important part: the Eagles are particularly susceptible this year, hence the team’s left tail is likely a bit larger than usual. That’s also a big reason why I’m keeping my expectations for the team’s win total in check. Outliers to the left side or a fat left tail will pull the mean of the distribution down. So if we’re just talking about average expected wins (there are certainly other ways to look at this), the Eagles “true” level is likely lower than many fans believe.
If Nick Foles goes down….. If LeSean McCoy goes down….. If anyone on the offensive line goes down….
The Eagles are currently heavily dependent on just a few players. The defensive depth chart improved a bit this offseason, but the offense (largely responsible for the team’s performance las year) is still very brittle. The problem is, that brittleness was not readily apparent last year, and therefore is likely to be under-appreciated this year.
Last season, the Eagles ranked 2nd overall in Adjusted Games Lost, a measure from Football Outsiders that quantifies the impact of injuries a team suffers over the course of a season. Here’s how the site describes it:
With Football Outsiders’ Adjusted Games Lost (AGL) metric, we are able to quantify how much teams were affected by injuries based on two principles: (1) Injuries to starters, injury replacements and important situational reserves matter more than injuries to bench warmers; and (2) Injured players who do take the field are usually playing with reduced ability, which is why Adjusted Games Lost is based not strictly on whether the player is active for the game or not, but instead is based on the player’s listed status that week (IR/PUP, out, doubtful, questionable or probable).
In 2012, the Eagles ranked 18th overall.
Clearly, they were more effected by injuries in 2012 than they were last year. Similarly, the fact that the Eagles ranked 2nd last year combined with the relatively uncertain (non-persistant) nature of injuries means we should expect some mean-reversion. Basically, it’s likely the Eagles will be more negatively effected by injuries this year, relative to other teams, than they were last season.
Of course, that itself doesn’t tell us much. We also need to know it injuries, as measured by AGL, actually affect performance (as measured by Wins). Well here’s the scatterplot showing AGL and corresponding Wins from 2009-2013.
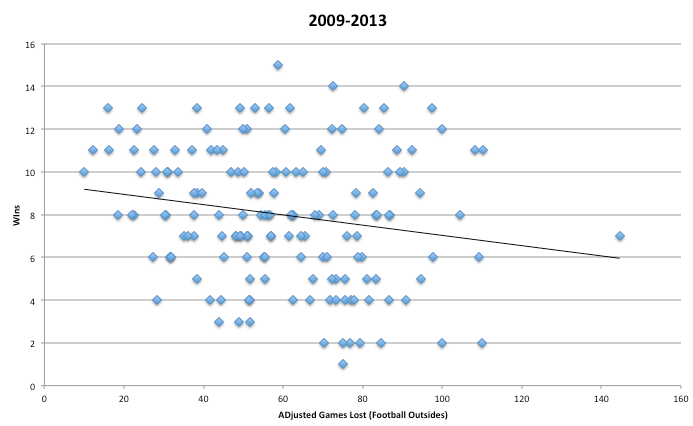
As you can see, there’s good news and bad news. The correlation value is -.185. If the Eagles revert towards the mean (as I expect them to), they’ll be relatively worse off than last year. However, the correlation is relatively weak, so the effect might not be catastrophic.
Anecdotally, though, I think there’s reason to be concerned, particularly because I don’t like the QB/RB Depth Chart. An injury to a starter is bad (and shows up in AGL). However, if the drop-off in talent to the next guy isn’t huge, the effect won’t be significant. Unfortunately, the Eagles don’t have that luxury at QB. Moreover, LeSean McCoy is SO good that it’s really impossible to keep the gap between him and the 2nd stringer small.
I should probably note here that I’m not trying to be overly pessimistic here. However, if we want to create a reasonably accurate performance expectation, we need to look carefully for risk factors.
Injuries are always a major risk factor. But in the Eagles’ case, I think the risk is atypically large this year. That doesn’t mean they’ll occur, but it does mean or ex-ante projection needs to account for them.
There’s much more to say around this topic, and I want to present a new version of the Depth Chart Over Time that will make potential injury risk more obvious. For now though, believe in the Eagles this year, but recognize that the existence of serious downside potential (negatively skewed) results in a mean win expectation that is lower than some might expect (I’ll get a number on it before the season starts). We can talk about median expectations some other time….

You can’t assume a normal distribution without showing that the data follow a normal distribution. Stats 101.
I don’t think the Games Lost metric includes someone who wasn’t a starter week 1. So Jeremy Maclin for the entire year wouldn’t count.
Good point. I’ll see if I can confirm/disconfirm that. However, even counting Maclin I’d be surprised if the Eagles weren’t near the top of the league. Regardless, it’s an important caveat.
Wasn’t really assuming a Normal curve as much as using it as a reference point.
That plot is meaningless, the R^2 is around 3%.
Brent, I see what you “mean.” I feel the same way. the Eagles lack of depth across the team will probably show up in pre-season games.
Nice, glad you unpacked this. Any other big factors besides injuries on your radar?
I know it has been a long time since you posted this one, but I really think your fears about the QBs and RBs is not as big as it was back when you posted this.