
Update: The Almanac is now available for preorder at http://www.eaglesalmanac.com.
Apologies for the lack of posts over the past couple of weeks. I’ll remain on a very intermittent schedule for the next couple weeks, but after that my schedule clears a bit and I hope to return to a more consistent schedule just in time for training camp to ramp up.
For today, I’m teasing a section of my article for the 2014 Eagles Almanac. I hope you all purchased it last year and, more importantly, I hope you all enjoyed it. For those unaware, a group of the best Eagles bloggers puts together an annual season preview magazine. I contributed last year and will do so again this year. I promise you there is no better way to get ready and excited for the upcoming season. Stay tuned for an announcement on its release date and where/how you can get it.
For my piece, I examined Nick Foles performance last year through the lens of his QB Rating. I pulled it apart and looked at each of his component statistics, then provided context and a projection. At the end, I put those projections back together to come up with a final QB Rating and stat line that will form my baseline expectation for Nick Foles’ performance next year. Here is the Yards Per Attempt section. Note that I have yet to edit it or really re-read it in great detail, as I just finished it; so sorry for any typos/mistakes.
——
Yards per Attempt
Last season, Nick Foles recorded 9.1 Yards per attempt, placing him first in the league. For his career, Foles’ yards per attempt now stands at 7.9. Of course, the scheme he is playing in now bears very little resemblance to the one he played in his rookie year, so the quality of that information is suspect. Of the 37 QBs who qualify under Pro-Football-Reference.com’s leaderboard, the median value was 7.0 yards per attempt. Clearly, Foles’ performance was a relative outlier. Aaron Rodgers, second overall, registered a YPA of 8.7 and Peyton Manning, third overall, had just 8.3 YPA. Historically, Foles 9.1 YPA ranks 19th overall. However, many of the greatest YPA attempt seasons occurred in a different era (mostly completed by Otto Graham). Post-merger, Foles’ 2013 season ranks 8th overall. Is that good?
Well, for a little more context, let’s take a look at the best performances by some other QBs. The only ones to top Foles are Warner, Chandler, Stabler, Rodgers, Dickey, Esiason, and Manning (the good one). Notice that no player topped Foles more than once. Joe Montana’s best YPA season merely tied Foles. Beyond that, the only players to crack the 9.0 YPA barrier were Bert Jones, Steve Young, and Dan Marino. Again, nobody in the modern NFL has every cracked 9.0 YPA more than once. That doesn’t mean it’s impossible to do, but it definitely means that it’s extremely difficult.
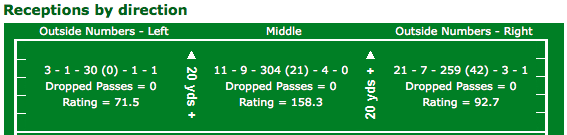
So how did Foles do it? Beyond the factors mentioned above (good team health and a low drop percentage), I’m sorry to say that there’s one particular factor that looms large when looking at YPA. Perhaps you’re tired of thinking about him, but there’s really no way around it in this context: DeSean Jackson was a huge boon to Foles’ YPA in 2013. Part of what made Foles’ YPA so great last year was his remarkable success on deep passes. According to PFF, 17.4% of Foles’ total attempts went farther than 20 yards. On those plays, Foles registered 14 TDs against just 1 interception. More clearly, here is part of a chart from PFF, showing Foles’ rating by area of the field (I’ve only included the 20+ yard section):

As you can see, Foles performed much better when his deep passes were targeted at the middle or right side of the field. Now, which WR do you think was in that area most often? Here’s the corresponding chart for DeSean Jackson:
The first number is targets, the second is receptions. Comparing the two, it’s abundantly clear that Foles’ deep passing success, a major factor in his great YPA (and every other statistic) was highly correlated with DeSean Jackson’s. There’s naturally a problem of causation here, maybe Jackson played so well because Foles was so great at getting him the ball downfield. (Yes, Vick threw some of those passes to Jackson, but most were indeed thrown by Foles. I think somebody, maybe me, tackled the Vick/Foles/Jackson conundrum a few months ago.) Looking at Riley Cooper’s chart supports that theory a bit:

However, look closely at the target numbers (the first listed). Jackson was target far more often than Cooper (as he should have been), meaning the bulk of Foles performance was in combination with Jackson. Regardless of who you believe was more responsible for the performance, the fact that Foles and Jackson no longer play together is a bright red flag for a potential change in performance.
To reiterate, Foles YPA performance last year was phenomenal, and very unlikely to be reproduced, even if every factor from last year’s team was reproduced. The loss of his best deep threat, Jackson, provides even more opportunity for variance from his performance. As I showed above, any change from last year in Foles’ YPA is almost certain to be negative.
Now the important question: What can we expect this year?
Let’s take a look at the other QBs who registered 9.0+ YPA seasons. What did they do over the course of their career? Here is the chart:

Wow…that’s a bit worse than I expected. Granted, we have to at least mention the fact that NFL offenses have evolved since most of these players played, and it’s now easier to achieve a high YPA. However, the fact that only two of the players on that list even cracked 8.0 YPA for their career’s speaks volumes to just how unusual Foles’ 2013 campaign was. Even Aaron Rodgers, on his way to perhaps the greatest QB career of all-time, has a career YPA nearly a full yard worse than Foles’ 2013 measure. So yes, it’s safe to say Foles will not put up 9.1 YPA again next season.
Remember that the median value for QBs with 50%+ snaps last year was 7.0 YPA. Just 6 players of those players had greater than 8.0 YPA. Now, I want to make it clear that I think Foles will still produce a strong YPA this season. As I showed, while DeSean was a major force, Cooper also put up sterling deep passing (receiving) stats last season. Jeremy Maclin, in 2012, also had very strong deep-ball numbers. Thus, I think league average or median is overly pessimistic. This is still Chip Kelly’s offense and there are still good players here. However, we also can’t pencil in 9.0 yards per attempt, at least not with a straight face. Looking at last season’s leaders, the historical comparisons, and the quirks of the Eagles’ offense, I think somewhere between 7.5 and 8.5 is fair, and if I had to narrow that range I’d put it at 7.5 to 8.3. Taking the midpoint, that gives us a rough projection of 7.9 YPA. That’s still very good, it would have ranked 7th overall (tied with Drew Brees) last season. But that’s a BIG decline from 9.1.
——-
In the full article, I also make projections for Completion %, TD Rate, and Interception Rate. Using those numbers, I also provide projections for QB Rating, Yards, TDs, and INTs.
