
Today we get the 4th round historical breakdown and, finally, we get some incredibly interesting results. As a reward for sticking with me through this, I’ll give you a couple takeaways first, which I’ll follow with the chart.
– In the 3rd Round, teams should NOT DRAFT: Defensive Ends, Defensive Backs, Quarterbacks, Fullbacks.
– Conversely, teams should focus on: Tackles, Running Backs, Tight Ends.
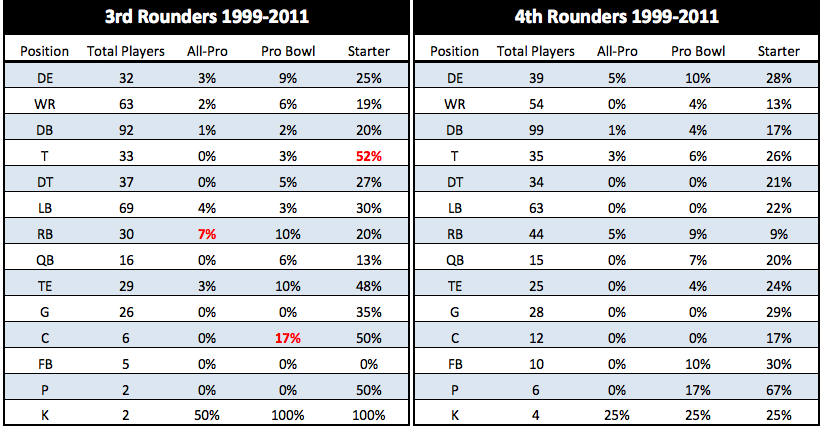
Here is the side-by-side comparison, at this point IGNORE the All-Pro and Pro-Bowl columns:
Plenty to notice here.
– Most surprising are the position groups I listed above. From 1999-2011, 3rd round DEs, QBs, and FBs were LESS LIKELY to become significant contributors than were 4th round picks at the same positions. (DBs in the 3rd and 4th round were about equal)
– We must also keep the relative value proposition in mind. Looking at the default NFL Draft Value Chart, an average 3rd round pick is worth TWO 4th round picks. So let’s game out an example:
Team A wants a DE and is sitting at its pick in the 3rd round. That team can either select a DE or trade down, picking up two 4th round picks in exchange for the 3rd. That team can then use BOTH 4th round picks to select two DEs. Which offers better odds and by how much?
3rd Round DE: 25% chance of a starter (chart above)
Two 4th Round DEs: 48% chance of a starter (.72*.72=.5184 chance of missing both, 1-.5184=.48)
So by making the trade, the team has nearly DOUBLED its chances of finding a starting caliber DE.
– Also notice that our 2nd round breakdown showed that DEs chosen in that round have a 36% chance of starting. Here, the value proposition looks incredible. According to the Value Chart, an average 2nd round pick is worth nearly 6 4th round picks! Obviously it’s almost impossible to make that trade (no team has six 4th round picks in the same year), but there appear to be severe inefficiencies in the draft value chart.
– The Eagles, over that time-frame, used three 3rd round picks on DEs…
– The Eagles, over that time-frame, used two 3rd round picks on DBs…
– The Eagles, over that time-frame, had 12 TOTAL 3rd round picks. They used nearly half of them very poorly. (Statistically speaking, not a grade of how those picks actually worked out)
Caveat – This analysis is based on nothing but the overall odds of each position groups success. I did not control for the fact that different teams had different numbers of picks. So it’s possible that (if drafting has a lot of skill) bad drafting teams had more 3rd round picks, skewing the results. We’ll get to the skill aspect a little later, but I am very skeptical that it has resulted in any significant skew to these results.
Tomorrow, I’ll show rounds 5-7 and then we’ll start putting together an “ideal” draft strategy.
