
Having some trouble with the Game Rewind program, so that’ll have to wait, but what I’ve done instead is far more interesting anyway.
We’ve explained pretty clearly that “elite” players come almost exclusively from the first round. Additionally, it was my expectation that the top 5 picks would see a much higher percentage of All-Pros/Pro Bowlers taken than in the rest of the round. THIS IS WRONG!
I’ve been operating under the assumption that the Eagles at #4, must get an All-Pro player, because teams rarely get to pick that high in the draft. However, it turns out the odds of getting an elite player are really no greater in the top-5 than in the top 15. Here are the numbers:
I looked at every draft from 1995-2011 (slightly different time-frame than I typically use), counting how many All-Pros and Pro Bowlers came from each pick (insert normal caveat about Pro Bowl designation here). Please note that if a player counts as an All-Pro, he does NOT also count as a Pro Bowler. So…

Odds of getting an All-Pro player is no different in the top 5 than in picks 11-15.
Here is the same chart, with additional rows showing the comparison of the top 15 picks versus the rest of the 1st round.

As you can see above, there is little difference within the top 15 picks (the Pro Bowl drop-off is notable, but the All-Pro designation is a lot more valuable IMO). However, there is a HUGE drop-off after pick 15. Admittedly pick 15 is an arbitrary place to split the first round, but it does appear to be close to (if not equal to) the actual inflection point when it comes to a dramatic shift in the odds of getting an elite player.
So what does this mean for the Eagles? Well it depends on your viewpoint, but it certainly supports the notion that the Eagles’ optimal strategy would be to trade down from 4, picking up extra picks while staying in the top 15. In fact, given how high the pick is, the team could probably trade down twice and still remain in the top 15.
If the team is blown away by either Joeckel or Lotulelei (my two current favorites for the team, with the DT ahead by a nose) and one of them is available, then the Eagles make that pick. However, if there are ANY reservations about either, or if neither is still on the board, than the right move is to trade down to the bottom of the top 10 and either take the best available, or trade down another couple picks and then take the best available player.
I realize the All-Pro and Pro Bowl designations are a bit subjective, but creating any other criteria in order to identify “elite” or “impact” players would arguably be just as subjective, so this is what we’re going with.
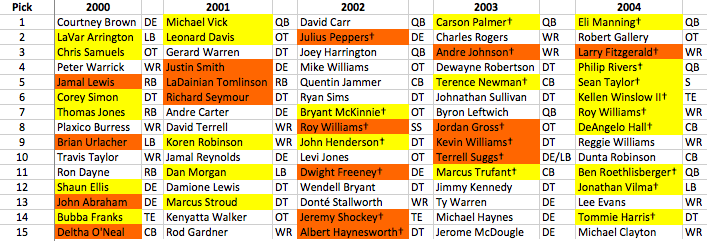
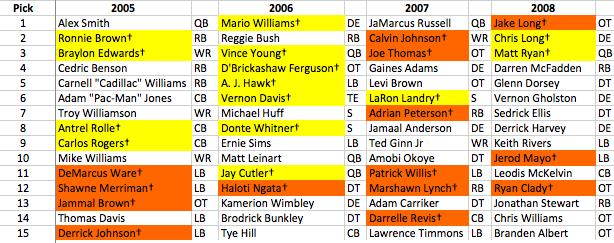
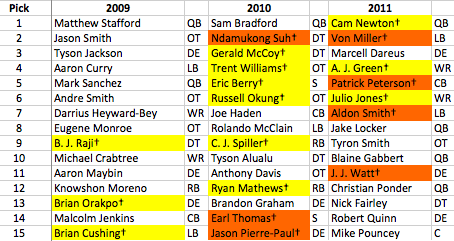
For those who are interested, here are the draft picks I looked at, with All-Pro’s highlighted red and Pro Bowlers highlighted yellow.


I think you are on to something here, but I am very conflicted about the data used to qualify the claim. There is probably some top 5 bias here because the positions typically drafted in the top 5 (LT, QB, DE, CB, formerly RB) are different than the positions taken 5-10 or even 10-15. That’s a poor way of saying that the position of the player drafted in 1-5 versus 10-15 may have a lot to do with the similarity of pro bowl appearances. For example, Gs are never taken in the top 5, so they would only provide pro bowl appearances in the later draft slots. It would probably be helpful to break down the pro bowl appearance metrics to only include “top 5” positions, or to otherwise balance the rate of each selection over the total number of players drafted at that position in the appropriate draft slots. This would eliminate issues like more Top 5 QBs competing for limited pro bowl slots. Just food for thought.
I crunched the numbers real quickly. The table below represents the amount of draft picks in at each position from 2000-2008 at each position:
1-5p 6-10p 11-15p
QB 10 2 2
RB 7 2 3
WR 6 9 4
TE 2 2
OT 8 3 5
G
C
DT 3 8 9
DE 6 5 7
LB 2 5 8
CB 2 4 5
SS 1 4
For example 4 of 6 DEs taken 1-5 went to the pro bowl. 0 of 5 DEs taken 6-10 went to the pro bowl (Suggs = LB). 3 of 7 taken 11-15 made the pro bowl (two in 2000, one in 2002). These figures seem to indicate that pro bowl players at “competitive” positions mostly come from 1-5, while positions not usually drafted 1-5 produce pro bowl players in 6-15. I would have to extrapolate this data longitudinally as well as over the other positions to confirm, but that would require a whole post.
Definitely some positional skew. I’ll break it out by position for the next post and see what it looks like. Only issue is when broken out by position the sample sizes are pretty small, so we can’t infer as much. But obviously we can expect success rates to vary by position.