
I’m compiling this year’s PVM Rankings, and the first step is to compile the consensus scouting ratings. If you remember, I take the average of each prospects individual rating from ESPN (Scouts, Inc.), NFL.com, and the National Football Post. I use this as a proxy for prospect quality, and then apply the additional bonus and risk factors I’ve explained before.
Anyway, NFL.com and NFP are actively trying to destroy this exercise.
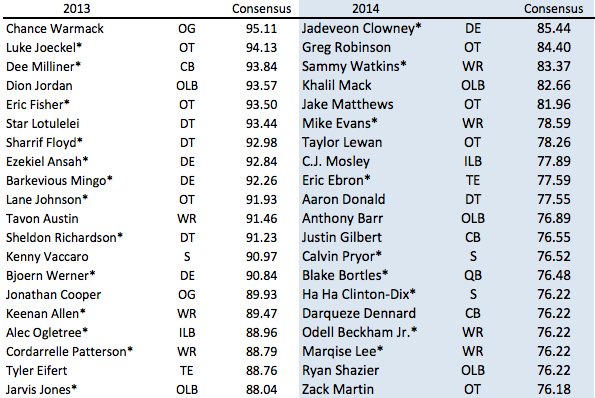
Check out the table below. I’ve taken the top 20 players from last year and lined them up with the top 20 players this year (by Consensus Rating).
The reason for the significant difference is that both NFL.com and NFP have changed their grading scales. Not only did the site switch to a 10 point scale, but it looks like the relative value changed as well. That means that even after adjusting for the new scale, the ratings aren’t directly comparable. However, even accounting for that difference, it looks like ratings are lower across the board. NFP did not make any adjustments that I can see, it just rates this year’s players as worse prospects. (As always, please correct me if I’m wrong.)
Last year, NFL.com’s ratings were out of 100; this year they’re out of 10. Previously, the 85-95 rating tier was defined as: “Immediate Starter – An impact player with the ability/intangibles to become a Pro Bowl player. Expect to start immediately except in a unique situation (i.e. behind a veteran starter).”
This year, the top tier, 9-10 is defined as: “Once-in-a-lifetime Player”. 8-9 is now defined as: “Perennial All-Pro”.
NFP has made a similar switch.
As you can see, this is a fairly dramatic departure. The upshot, unfortunately, is that we won’t be able to compare this year’s draft class to last year. It’s possible that both of these organizations believe the new systems are superior to the ones they used last year. It’s also possible that they’ve realized changing the scales makes it really hard to critique the ratings over time.
Whatever the cause, the result sucks for us. It shouldn’t hurt this year specifically (and may help if the new systems are, in fact, superior), but we can no longer compare players year-over-year to answer questions like: Where would Jadeveon Clowney rank compared to last year’s prospects?
Still working through potential adjustments, but for now, here are this year’s top prospects, by consensus rating (as I’m currently calculating it, which is just an average).


We can compare directly with a little math, the real question is what’s the best way to do so. We can envision a system where we scale the two data sets based on the top player (Warmark = Clowney), and adjust downwards. This stabilizes the rankings based on their ordinal values.
We can also do this with a weighted average – take the top 20 from each class, determine the difference in averages, and adjust the 2014 upward appropriately. This would probably work best via multiplying 2014 player by T20Avg(13)/T20Avg(14), but one could also argue for an flat upward adjustment.
Or you can take all three and syndicate it, just like the PVM rankings do. Just food for thought. Hope you’re ready for finals!