
Lots of potential topics to discuss for the bye week, but I’ve chosen one that I haven’t seen discussed anywhere else (as usual). Don’t worry, though, I also included some thoughts on Wentz v. Prescott below.
Pace of Play
The Eagles defense, by virtue of their dominance thus far, as facing far fewer plays per game than they did last year. Additionally, the offense is playing slower. On offense last year, the Eagles averaged 22.2 seconds per play, fastest in the league. This year, the offense is averaging 31.53 seconds per play, slowest in the league.
I’ve spoken before about how time of possession is generally overrated, and I still believe that. However, the extraordinary differences between last year and this year could have serious implications for another important aspect of the game: injuries.
Coming into the year, one of my biggest concerns was the lack of depth. At OL, CB, LB, WR. It is still my biggest concern. To that end, any aspect of the game that mitigates that risk is very beneficial for the Eagles.
On offense, the team this year is averaging 70 plays per game, the same rate as last year. How is that possible if they’re taking more than 9 more seconds per play this year? (1) They’re converting for first downs, so they’re getting more plays per drive and (2) the defense has been amazing.
However, the defense looks much different. Here is a chart showing the plays per game by the defense both last year and this year.

As you can see, the team is playing 17 fewer plays per game. Over the course of a season, that amounts to 272 fewer plays, or 5 fewer games at current pace. That has potentially very significant effects on the expected injury rate for the team.
Unfortunately, I don’t know what the expected serious injury rate (or survival rate) on a particular play is. But let’s say it’s a 99.8% survival rate of serious injury (one that would require at least 1 missed game).
For one game, using the data above:
At 54 plays: The survival rate is .998^54 = 90%.
At 71 plays: .998^71 = 87%.
That’s a 3% difference in just one game. Additionally, if that injury rate is too low, the difference will be much larger. At a 99.5% rate, for example, the difference is 6% (76% – 70%).
For an entire season, the current pace on defense would result in 863 plays. The defense faced 1139 plays last year.
At a 99.8% survival rate, the chances of getting through the season unscathed (assuming independence and a constant rate) is:
.998 ^ 863 plays = 17.7% survival rate.
.998^ 1139 plays = 10.2% survival rate.
So if a defensive player played every snap, he would be 74% more likely to escape injury this year than last (given the assumptions above). Given the importance of a few key players (Fletcher Cox, Jordan Hicks, Malcolm Fletcher), a significant decline in the odds of injury may play a large, if invisible, role in the team’s success this year.
A few caveats:
- Most players don’t play every snap.
- I’ve assumed a constant injury rate. It is entirely possible that the expected injury rate INCREASES with the number of plays. As players become fatigued, the odds of injury might increase, which would lead to an even more significant difference than the one I’ve outlined above.
- I don’t expect the Eagles defense to face an average of just 54 plays per game for the rest of the year.
Wentz v. Prescott

That seems to be the general attitude, at least on Twitter. So which one is it?
Let’s attack this from two angles. One is conceptually, the other is statistical context.
1) Remember your priors.
Each quarterback has played just 3 games. Needless to say, we’re a ways away from being able to make any definitive judgements on their relative skill level. However, we can and should start evaluating the new information, and using it to update our expectations for each. The updating part, in particular, seems difficult for certain pundits to grapple with. Put simply, draft position DOES matter. As each player progresses, his pre-career evaluation will provide less and less information about what to expect going forwards. This early, though, that information should still be providing a large portion of the evaluative information.
In plain english: Would you rather have a #2 pick that has looked great after 3 games, or a 4th rd pick who has looked great after 3 games?
The answer (and it’s not even close), is the #2 pick. But why?
Before the season began, the odds that Prescott < Wentz were quite large, based purely on draft position. We know the historical success rates for QBs drafted in the top 5 are MUCH higher than for those drafted later.
In other words, we should all be looking for false positives. Prescott is more likely to be showing a false positive than Wentz as of a result of his ex-ante evaluation. Remember that were just talking probabilistically here. The could still both be terrible, or future HOFs. But if you feel compelled to evaluate one vs the other, it isn’t close, despite their performance. Wentz is still overwhelmingly likely to be the better player.
Somewhat ironically, I think some of the Anti-Wentz people have fallen into a different trap. Basically, they’re clinging too tightly to THEIR priors. They thought Wentz was overrated before the draft, and are now looking for confirmatory evidence, rather than evaluating whether their pre-draft assessment might have been wrong.
Here’s the key point though: For outside fans/writers, it doesn’t matter what you’re pre-draft evaluation was. Once the draft happens, we know the relative odds of success for each position. It doesn’t matter if I personally believed Wentz deserved to go in the 7th round (I didn’t, just so we’re clear). As soon as he was drafted, that became the best evidence for his odds of success. Same for Prescott. Basically, value is what the market says it is.
2) The statistics.
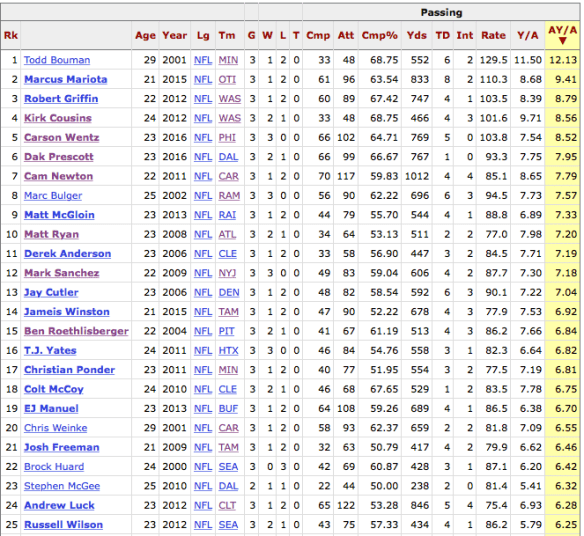
Now let’s look at the stats. Here is a chart, from PFR, showing rookie QBs since 2000 that have thrown at least 40 passes in their first 3 games. I’ve sorted by adjusted yards / attempt. These are the top 25. Wentz is 5th, Prescott 6th.
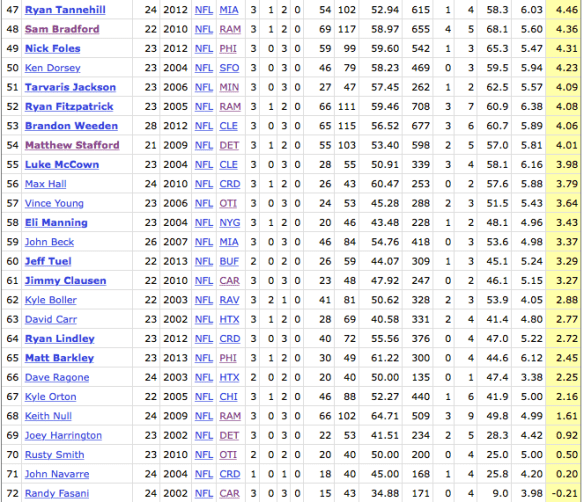
Here are the bottom 25:
You can sort by Rating or Y/A and the results are very similar.
What’s the takeaway? I’m not sure there is one. However, the only decent QBs to come from the bottom of the list are Matt Stafford and Eli Manning. So, at the very least, we can be thankful Wentz has shown as well as he has, if only because false negatives seem to be much rarer than false positives. If a QB looks bad early on, he’s very likely to actually bad. If he looks good…we still don’t know.
Statistically, you really can’t ask for a better performance from either Wentz or Prescott. I’ve watched nearly every play of both QBs, and I think Wentz has looked better (aside from the conceptual likelihood of superiority mentioned above). In particular, Wentz’s deep passing might be a Plus skill. His ball placement has been amazing, and absent a few bad drops by his WRs, his stats on such throws would be amazing.
This chart, from PFF via this article (http://www.cbssports.com/nfl/news/carson-wentz-vs-dak-prescott-an-in-depth-look-at-the-stats-separates-hype-from-reality/) helps put things in perspective:
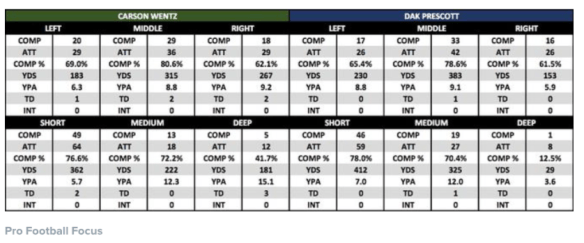
Wentz is 5/12 on deep throws (20+ yards), including at least 3 drops by my count, Prescott is 1/8, with his one completion coming on an underthrow to Cole Beasley that turned what should have been a TD into a first down on the 1 yard line. It can be seen here: https://twitter.com/NFL/status/780214996995223552.
Both Dak and Wentz look great. But frankly, the comparison isn’t close right now. Give me the #2 pick with the deep passing skills over the 4th rounder with the foot speed every damn day of the week.

Pingback: Brandon Graham’s Relentless Pursuit to Erase the Memory of Earl Thomas | Eagles Rewind