Necessary Conditions for Winning a Super Bowl

Since we’re in the midst of the off-season, between the two major team-construction events, I thought it’d be a good time to explain my personal philosophy on what it takes to win a Super Bowl.  The goal is to try to dig down to the most basic attributes a team must have, and in the process examine clichés like “defense wins championships” or “you need an elite QB”.

Here’s where I am currently:

To win the Super Bowl:

– You need a lot of good players.

– You need some of those players to play great (greatly?) in the playoffs.

– You need to get a few lucky bounces along the way.

That’s my current theory at least, I’ll update it as I find new data that conflicts.  Today I’ll give my thoughts on the QB position and then examine the whole Offense vs. Defense wins championships thing.

Overall, I’d like to identify a set of necessary conditions for winning the Super Bowl.  Today is the first step in that endeavor.

First I’ll attack the QB position:

You do not need an elite QB to win the Super Bowl.  It certainly helps, but the fact is you just need a “good enough” QB.  The entire “elite” debate is ridiculous, but especially at the QB position.  When you use the term “elite”, you’re alluding to a very exclusive group.  Is the top 10% fair?

If so, that means the number of “elite” starting QBs in the NFL is between 3 and 4.  So congratulations Patriots, Packers, and Broncos; one of you obviously won the Super Bowl last year.

The fact is, the term “elite” is useless since there’s no standard definition, and even if there were it wouldn’t mean anything significant.  Teams need a QB that is “good enough”.  So what does my list look like?

Good Enough – Brady, Manning (both), Rodgers, Brees, Ryan, Roethlisberger, Flacco, Schaub, Romo (i hate him but yes), Rivers, Kaepernick, Luck

That’s my list, although I’m sure there is some disagreement.  Also, this is not to say a QB not on that list CAN’T win the SB, just that, at this moment, I don’t believe they’ve proven themselves good enough.

Joe Flacco is not an “elite” QB, by any realistic definition.  However, that doesn’t matter, he still won the Super Bowl.  Colin Kaepernick came damn close.

The problem for Eagles fans is that neither Vick nor Foles looks good enough this year.  It’s possible Foles could get there, but extremely unlikely this season.  I’m pessimistic about Vick’s chances.

Does Defense Win Championships?

Well, what do you think?  Now consider:

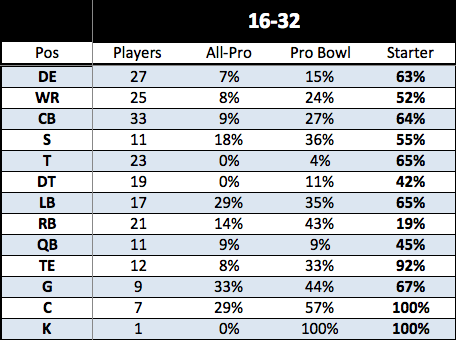
– Over the last 10 seasons, 5 SB winning teams ranked in the top 7.5% for points allowed per game.  Put differently, the top 24 out of the last 320 team seasons contained half of the Super Bowl winning teams.

This is, perhaps, the most surprised I have ever been by a stat I’ve looked up while writing.  In any case, it would certainly appear as though having a truly great defense goes a long way.

What about offense?

Based upon the above stat, I would expect to find a similar result (i.e. be great at something, either offense or defense).  Looking at the same sample:

– Just 1 SB winning team (New Orleans ’09) in the last ten years placed in the top 7.5% of points scored, or 92.5 percentile.

If we look at the top 10% of offenses over the last 10 years, just one more SB champ makes the cut, the 2004 Patriots.

Put together, it seems like having a “great” defense is preferable to having a “great” offense.  That definitely has to change the overall theory a bit.

What about the reverse perspective?

– The lowest ranked offense to win the Super Bowl in the last ten years was the 2008 Steelers, who averaged just 21.7 ppg, good enough for exactly 160 out of 320, or the 50th percentile.

The 2003 Patriots are just above them, having averaged 21.8 ppg.  Interesting to note that the Patriots (now offensive juggernauts), won their first title with a fairly weak offense.

As you might have expected, both the ’03 Patriots and the ’08 Steelers had historically great defenses.   Both placed in the top 10 of the last 10 years.

– The lowest ranked Defense to win the SB in the last ten years was the ’11 NY Giants, who allowed 25 ppg (while scoring just 24.6, leaving them the only SB winning team with a negative point differential, I really hate the Giants).

That places them 265th out of 320 teams, or 17th percentile.

– Among SB winners of the past 10 years, the 2007 Giants are the lowest ranked offense that did NOT have a corresponding historically great defense.  They scored 23.3 ppg, ranking the team 120th out of 320, or the 62.5 percentile.

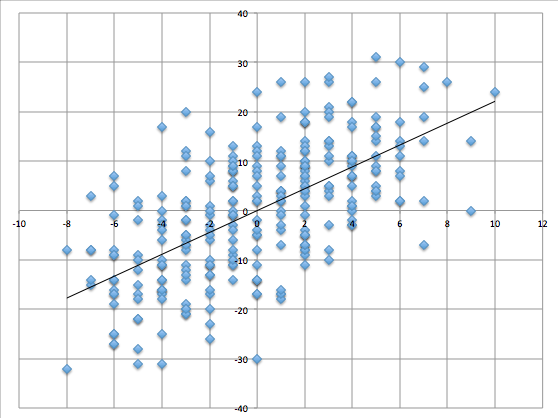
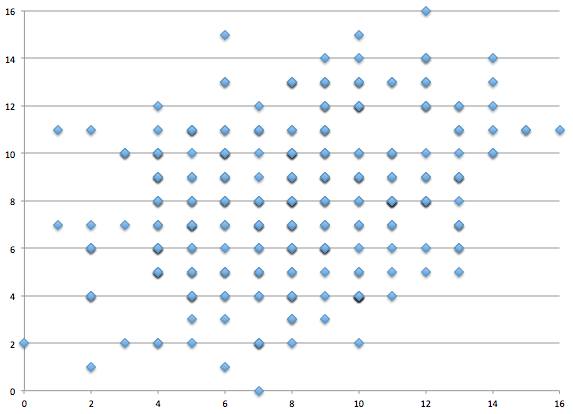
I feel like we need some charts, so here are two, one showing points allowed vs. Wins and the other showing Points Scored vs. Wins.  Note this is just regular season data.

Screen Shot 2013-04-03 at 12.36.20 PM


Screen Shot 2013-04-03 at 12.35.15 PM

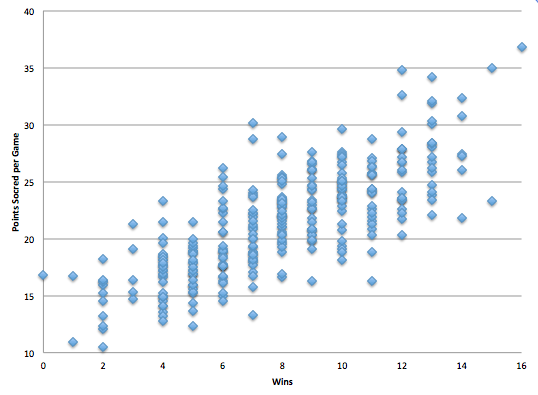
Both illustrate strong correlations.  The values:

– Points Scored to Wins:  .768

– Points Allowed to Wins: -.669

Have I confused you yet?

If not, good for you, because I’ve certainly confused myself.  Let me attempt to summarize what we’ve seen here today:

– A GREAT defense goes a long way, but is NOT a necessary condition to winning a SB.  Neither is a GOOD defense, as evidenced by the ’11 Giants, ’06 Colts, and ’07 Giants (all placed in the bottom 50% yet still won the SB).

– A GREAT offense does not go as far, but a GOOD offense does seem to be a necessary condition for winning a SB.  No offense ranked in the bottom 62.5% for the last ten years has won the SB.

What does it all mean?

While teams should focus on being good everywhere, it appears as though Offense should take slight preference, as the only way to win without a very good offense is to have a historically GREAT defense, which is obviously harder to put together.

Or you can be like the NY Giants and just ride a wave of lucky bounces…twice.

Visualizing the Offense

Yesterday we did the defense, so naturally today we will do the offense.  However, this is a little bit less informative due to the injuries the team sustained last season.

I’m going to skip the original chart I made because it was based on perceived ability (not performance), and included all of the injured starters.  Using PFF’s grades, this is how the offense looked last season.Screen Shot 2013-04-02 at 11.05.12 AM

A couple of notes, then I’ll highlight a few areas.  Due to the injuries, there were a number of players that received playing time.  I used whichever player took the most snaps as the rule for inclusion.  Watkins and Scott played nearly the same amount, but they ranked similarly so the color wouldn’t change.  There were also a few players who were on the edge as to which color they deserved (for instance Shady was the last spot in the top third).  I could have done the mixed colors again, but I wanted it to be as clear as possible.

Takeaways-

– Both Jeremy Maclin and D-Jax played well below their potential.  Perhaps not surprising given the QB situation and the state of the O-Line, but it remains a cautionary note going into next season.  We know Maclin has the talent, but we can’t pretend he’s a lock to realize that next year.

– Jason Peters will hopefully come back as green.

– I know everyone loves Jason Kelce, but PFF graded him close to the bottom for his rookie year.  I think he’ll be good, but this is another position at which fans seem to be buying the upside without realizing there’s a reasonably significant chance it doesn’t work out.  For the record, his rating in 2011 would have placed Kelce LAST in 2012, below Dallas Reynolds.

– The right side of the line is tough to project.  If the Eagles draft a RT at #4 and shift Herremans back to RG, then both of those spots could go green.  Keep that in mind as we get closer to the draft.

Drafting a starting RT could provide immediate improvement at TWO positions.

– Although I don’t need to mention this, having your QB grade out red is bad.  Of the 27 QBs that played more than 50% of their team’s snaps, just 4 ranked worse than Vick (Ponder, Fitzpatrick, Sanchez, Weeden).

– It will be interesting to see how James Casey and Brent Celek split time.  I know Kelly says he will use a lot of 2 TE sets, and Casey can line up almost anywhere, but it wouldn’t surprise me at all to see Casey supplant Celek as the starting TE.

– Finally, PFF’s ratings shouldn’t be taken as gospel. So feel free to disagree with the colors above, just note that the source is Pro Football Focus, not me.

That’s all for today.  Working on some bigger stuff that takes time, but the results should be fun.

Visualizing the Defense

Now that we’re through free agency, I think it’s time to take another look at the defensive line-up.  Previously, I put together an illustration of the Eagles 2012 starting defensive line-up, with each position color-coded according to performance/ability.

Today, I’ll put the same illustration together, this time with a the scheme/roster additions reflected.  I think doing this visually makes the comparison much easier to see.  Additionally, I’ll go back an update last season’s using PFF’s ratings in an attempt to take some of the subjectivity out of the ratings.

This is an attempt to make roster evaluation as simplistic and easy as possible.  Red = Bad, Green = Good.

Please note that this (the color-coding) is obviously subjective (hence the PFF adjustment in the second chart).  My guess is there are a few players for whom there will be disagreement over the corresponding color rating.

Here is the original graphic of last year’s defense, not updated with PFF:Screen Shot 2013-04-01 at 11.42.56 AM

For reference, Green = above average starter, Yellow = league average starter, Red = Below league average.  If I could go back and change anything, it’d be the CB ratings.  I was far too generous to both Nnamdi and DRC.  Using pure performance (not potential), they both should have been red.  For those paying attention, that means the ENTIRE Eagles secondary would be rated below league average (which sounds about right in hindsight).

Now let’s use PFF’s ratings.  If a player was in the top third of the league (starters), they’ll be green, middle third = yellow, bottom = red.  This chart will be a reflection of ONLY total performance, so no adjustments made for inconsistency (see multi-colored ratings above).

Screen Shot 2013-04-01 at 12.00.51 PM


Note that Nate Allen and Akeem Jordan have replaced Anderson and Chaney.  At the time I did the last one, Anderson and Chaney were the starters.   However, over the whole season Jordan and Allen played more snaps.

Looks like the original ratings were pretty good, except for the previously mentioned CBs.  Additionally, while Kendricks had runs of both very good and bad play, his overall rating was very poor.

As you can see, there was far too much red and not nearly enough green last year.  It comes as no surprise then, that to date, most roster changes have been made on defense.

Now comes the hard part, trying to project next year’s team.  First a couple of rules:  Injury-risk will not be taken into account.  This is obviously a major concern, but I don’t see any good way to incorporate it into the graphic.  Therefore, I’ll projected the “on paper” defense, then highlight the risks afterwards.  Also, since we don’t know the exact defensive alignment Kelly will use, I’ll stick with a basic 3-4.

Screen Shot 2013-04-01 at 12.29.39 PM

Keep in mind that the actual physical alignment will be different from what’s shown above. However, I think right now this is as good a guess as any in terms of personnel.

What jumps out?

– Phillips, Chung, and Fletcher can all be considered “injury risks”.  That’s a big chunk of the secondary (as well as the source of major improvement over last year).  If any or all of those guys go down, the Eagles are back in the red.

– The DL has gone from a strength (relatively speaking) to a weakness.  Cox is a keeper and should anchor the line (I don’t see him having an issue transitioning to the 3-4, regardless of whether he ends up as a 3-tech or 5-tech.)  However, Spooky is just a body and can’t be counted on for even league-average play.  Also, the opposing DE spot is a glaring hole on the roster (hence all the Star/Floyd draft talk).  I think there’s a good chance they address this with one of those prospects.  It’s also possible Vinny Curry puts on some weight and takes a shot at this spot.  In any case, as of this moment, it has to be viewed as a weakness.

– As I mentioned after their signings, the Williams/Fletcher combo is going to take some getting used to (Fletcher may not even win the job).  The hope here is for league-average play, nothing more.

Overall, the D looks a lot different from last year (personnel-wise).  However, it’s clear we still need a couple of impact players (i.e. green).  Maybe Barwin rebounds and becomes one of them.  Maybe Cole or Graham transitions better than projected.  Maybe Kendricks flourishes at his new spot and finds a consistent game.  Hopefully the team can use the draft to upgrade from red to green either at NT or DE.  That’s a lot of unknowns.

Keep in mind that it’s easier to go from bad (red) to average (yellow) than it is to go from average to good (green).  It’s clear that Roseman and Kelly looked at the second chart above (the PFF adjusted one) and tried to address every red mark (weakness).  On paper, they’ve been successful.

Even so, as of this moment, the Defense is still pretty far from one we can safely project as “good”.  Though after last season, I’ll be happy with just average.

Fumbles and Luck

There’s a lot of disagreement about how much of a role luck plays in turnovers, and fumbles in particular.  I’ve addressed this in more detail before (search fumbles for the posts), but today I just want to throw out some quick data to give a better illustration of the overall points I’ve been trying to make.

First, we can mostly agree that fumble recovery % is luck-dependent.  Not all fumbles are created equal, and where they happen can effect which team recovers.  However, I think it’s fair to say that, in general, teams should recover around 50%.

Last year the Eagles recovered 35% (according to Teamrankings).  Buffalo was worst in the league at 30.6%.  Washington led the league at 67.39%.

I previously looked at the persistence of fumble recovery rate and, as expected, found no meaningful correlation.  While that’s not enough to prove recovery rates are entirely luck, it is enough to show that the Eagles are very likely to improve on that measure next year.

Fumble Differential

We’ve talked about TO Differential, but now I’ll look at pure fumble differential (gained-lost).

– The 2012 Eagles’ fumble differential was -17, or 2nd worst in the last 10 years.  Obviously, the NFL average is 0.

– There is no evidence of persistence in fumble differential.  That means, despite how bad the Eagles were with fumbles last year (-17), that has no predictive power for what that measure will be next year.

– Something to remember here is that the differential also includes fumbles forced and recovered.  The Eagles gained just 5 last year.  The NFL average is 11 over the past 10 years.  The lowest over that time was 3, not far off from the Eagles’ 5.

So let’s back away from the luck aspect for the moment (that takes a lot longer to address, particularly regarding “fumble-prone” players).  What I’m basically say is this:

– The Eagles are very likely to fumble less next year.

– The Eagles are very likely to force more fumbles next year.

– The Eagles are also likely to recover a greater % of all fumbles next year.

Regardless of where you stand on luck vs. skill, I’d be surprised if many people disagreed with any of those three statements after looking at the data.

Put those together and the Eagles are very likely to have a significantly improved fumble differential, which obviously means the team is likely to have an improved overall TO differential.

Note: Nothing is guaranteed here, we are just talking about probability.  Just because the team was unlucky last year doesn’t mean it can’t ALSO be unlucky next year.  That’s possible.

The key here is that there appears to be extremely LITTLE room for the team to get worse (because of how bad they were), hence they will likely get better.

There’s also the issue of interceptions, which I haven’t really addressed.

I’ll try to tackle interceptions sometime soon, but I wanted to be very clear about the overall ideas here.  Even if you believe fumbles are not inherently luck-dependent, the Eagles are still very likely to improve next year.

I want to make sure we’re not losing the forest for the trees here.  I’ll tackle the luck vs. skill issue in more detail later and provide further evidence for why I believe fumbles are heavily luck-dependant.

BTW, this post is the result of a very thoughtful email from someone who raised a few issues with my previous post.  As I’ve said before, I make no representations for being perfect, so critiques are both welcome and necessary.  Please email me at  eaglesrewind@gmail.com if you have any issues with posts I put up.  I’d rather have the chance to fix mistakes or explain assertions than have individual monuments to my stupidity preserved for posterity.

Turnovers and the Eagles potential for 2013 Success

NOTE: After today’s post (and recent analyses), I believe it’s time to change the Blog subtitle.  Hard to believe, but I think I’m now the most positive Eagles blogger I know of. Thank god for data and objectivity.

Today let’s go back to the turnover issue.  As most of you know, the Eagles were terrible last year when it came to “taking care of the ball”.  The team had a turnover differential of -24, which is tied for LAST place over the previous 10 seasons.

I repeat, LAST over the previous 10 seasons. (The Chiefs of last year were equally bad).

With that comes the previous analysis I did showing the correlation between TO Differential and Wins.  The value is a very significant .64.  So turnover differential is really important and the Eagles were historically bad last year by that measure, hence a 4 win season.

Now let’s take it one step further and see if we can learn anything about what might happen THIS year.

I did a similar analysis, but this time focused on the CHANGE in both turnovers and WINS from one year to the next.  Given the .64 value above, teams making improvements to TO differential year-over-year should see a corresponding improvement in Wins (or losses is TO differential gets worse.)

Here’s the chart, with Win Change on the X and TO Differential change on the Y:Screen Shot 2013-03-27 at 12.29.03 PM

The correlation value is .63, about what we would expect given the first order Wins/TO Differential correlation value.

The chart is a little tough to read, so let me make it simple with an example:  Let’s say your team’s TO Differential FELL by 10 this coming season.  To find the corresponding win change, find -10 along the Y axis and then move left or right until you hit the line.  Here, a decline in TO differential of 10 equates to an approximate 4 win decline.  HOWEVER, notice the spread is relatively large; this means we need to recognize that our level of precision (confidence) here isn’t very big.

So what does this mean?

Well let’s go back to the 2012 Eagles.  The team’s TO Differential was -24.  As I’ve discussed before, this was heavily influenced by incredibly bad luck with fumbles (in both their existence and the team’s recovery rate.)  I expect both measures to improve dramatically next season,  purely because last year’s were so unlikely.

Let’s say the Eagles move from the 99% in TO differential (negative perspective) to just the 90% (Using the last 320 team seasons/10 league years as data).  That equates to a TO differential of -13.  That’s still really bad (hence the 90%), so we’re not really doing the Eagles any favors here.

However, because last year’s measure was so bad, moving to -13 is still an IMPROVEMENT of 11 turnovers.

Here’s where it gets fun.  Going back to our chart, an improvement of 11 in TO differential equates to an approximate gain of 5 wins.

Presto chango, 4-12 last year just became 9-7 next year.  

Unfortunately, there’s that pesky little precision problem, which means a 5 win gain is far from certain.  However, the overall point remains: by just being BAD instead of HORRIBLE when it comes to TOs, the Eagles can achieve a much better record.

It must be noted though, that the Eagles achieving 4 wins last year with a -24 TO differential is a minor miracle in itself.  The team’s “overperformance” last year means there’s probably a little less room for adding wins due purely to positive mean regression next year.

Now let’s get really crazy (prepare your happy face):

Over the last 9 seasons (not including this past year since we don’t have subsequent season data), 17 teams registered a TO Differential of -15 or worse.

The average change in TO differential the following season?

+18.4

Conclusion:

a) The Eagles are likely to improve their TO performance substantially next year.

b) Positive improvements in TO differential are STRONGLY correlated with positive Win changes.

A + B = The Eagles have a significant chance (nothing is certain) to be A LOT better than you think next year.

Special Teams Importance and Improvement

Surprise news from the Eagles yesterday: the team signed a punter (Jones) and cut McBriar.  For most casual fans, this move probably doesn’t register as anything other than replacing one guy most people don’t know with another.

However, it has the potential to make a big impact, and put in context with the other moves the team has made, shows a clear recognition of one of the team’s biggest weaknesses last year:  special teams.

Though it flies beneath the radar of most casual fans, special teams is indeed important, and the Eagles were terrible in this area last season.

Let’s look at some stats:

– The Eagles ranked 28th in the league in Net Yards per Successful Punt last year with 37.3.

– The 49ers and Saints were tied for 1st overall with 43.2, meaning these teams, on average, gained SIX more yards per punt than the Eagles did.  While most of the league didn’t perform nearly as well, this is an indication of just how big a role the punting game can play (6 yards per punt difference is HUGE in case anyone didn’t realize that).

– According to Football Outsiders, the Eagles ranked 24th in the league last year in overall special teams.  Only 2 teams ranked in the bottom third of the league made the playoffs (Redskins and Texans).

– According to Football Outsiders, the Eagles ranked LAST in the league in punting last year.

– The Eagles were also UNLUCKY, with the fourth largest special teams disadvantage due to factors outside the team’s control (opposing field goals, kickoff distance, punt distance).

So what?

Looking at the above stats gives us an appreciation for how weak the ST unit was last year.  That last stat is interesting because it fits what I’ve been saying/showing for a long time:

The 2012 Eagles were a mediocre team with VERY bad luck.

While the offense and defense are more important, it’s nice to see Roseman and Kelly taking improvements everywhere they can find them.  There is no guarantee that Donnie Jones will be any better than McBriar was or that the coverage will be any better either.  However, it’s likely that both areas will improve, due to the low bar set by last year’s team.

The upshot is field position.  I’ve covered this before, but the Eagles ranked last, by a long shot, in relative field position last year (-6.67 yards).  Improvements to special teams will help this measure.  Consequently, the offense will have fewer yards to travel to get in scoring range and the defense will have more yards behind them.

Field position is an aspect of the game that is tough to focus on in real-time.  6.67 yards does not sound like much, but remember that is an AVERAGE PER DRIVE.  Last year, every Eagles offensive drive started, on average, almost 7 yards farther from the end zone then the opponent’s corresponding drive.

While everyone is focusing on the defensive scheme and roster changes while getting excited about the offense, arguably the easiest area for improvement is special teams.

The signings of Jones, Benn, Chung, Phillips, etc… will go a long way in that area.  I don’t expect fans to get excited over things like kick coverage and net punting average, but improvements here will show up in the box score by making it easier for the Eagles to score and harder for opponents to do the same.


Parity in the NFL…Why you shouldn’t sleep on the Eagles next year

Let’s step away from the draft and free agency for a moment, since we’ve reached a lull in the action there.  Instead, let’s talk about expectations in general, specifically how team performance this past season should factor into our predictions for next year.

I’ve noticed quite a few people are “down” on the Eagles for this coming season.  Nevermind that the draft has yet to happen and free agency is not yet finalized; generally people do not believe the Eagles can be a playoff team next year.  This shouldn’t come as news to anyone, but the real question is why?

I believe the answer is composed of two related parts: A) anchoring, and B) misunderstanding of the overall NFL competitive landscape.

Anchoring

Anchoring is a fairly common problem than many people don’t fully appreciate.  It’s a specific type of cognitive bias that results in poor evaluations/predictions from almost all of us.  Basically, it’s relying too heavily on the first piece of evidence.  A common example is any game that involves guessing how many pieces of something are in a jar (candy usually).  If the guesses are public, then the overall range of guesses will usually center around the first person’s guess.  Despite the fact that everyone is looking at the same jar (has the same info), the initial guess, by virtue of being first, tends to “anchor” all subsequent guesses, regardless of its accuracy.

While football records are obviously a bit different, I submit that the most recent season’s record fulfills a similar function as the first guess in the example above.  Jumping to the Eagles: last season the team won just 4 games.  Consequently, predictions for next season  are all made in reference to that number (which is why predicting the playoffs for the Eagles next year isn’t common).

Despite the fact that last year’s team roster/scheme/coaching staff/etc… bears little resemblance to the one the Eagles will play next season with, the record remains a major factor.

So the obvious question for us is: how useful is last season’s record in predicting this coming season’s?

Taking the last ten seasons for each team, I plotted season records against the same team’s record from the following year.  Here’s the chart:Screen Shot 2013-03-25 at 12.09.17 PM


There definitely appears to be correlation (as we’d expect), but the value is just .30 (weak/moderate).  Additionally, I’d argue that within this sample are two teams that have an inordinately large impact on the overall correlation values by virtue of their remarkable consistency (the Patriots and Colts obviously).  While I’m usually hesitant to play with the sample, in this case I think it’s worth looking at the results without these teams.  In essence, due mainly to the Brady/Manning effect, I think they are anomalous and a poor representation of the usual state of the league.  More specifically, I think they are useless when it comes to drawing conclusions about the Eagles this year.

When we remove them, the correlation value drops to .22.  Still real but fairly weak.

So far, we’ve got reasonable evidence that the Eagles record this year doesn’t mean much when it comes to next year’s performance.  I’d actually argue that it has almost NO SIGNIFICANCE, due to the overall weak correlation combined with the dramatic makeover the team has undergone.

Average Change

We can also look at the average change in record from year to year.  Using the same sample, I found the absolute value of the difference in wins from one season to the next.

The verdict?  On average, NFL team’s # of wins change by 3.07.  With just 16 games in a season, a 3 win difference in either direction is BIG.  Also, that’s AVERAGE, which means there were a LOT of changes greater than 3.

In fact, the median value was 3, which means half of the season-to-season changes were GREATER than 3 wins/losses.

Upshot

This obviously has large implications for the Eagles, and more specifically Eagles fans.  A change of 4 wins (slightly above average) puts the Eagles in playoff contention (or a winless season).

To be clear: All fans are free to COMPLETELY IGNORE last season’s record, for it is a very weak indicator for how the team will perform this coming year.

At the moment, I’m fairly bullish on the Eagles chances for next year, though there is still a long way to go.  In any case, the fact that the team sucked last year really doesn’t matter, so by all means, forget it ever happened.

P.S. you’re welcome.

1st Round Breakdown

A couple of people asked for a more detailed breakdown of the 1st round, so we’ll do that today.  First, however, I need to apologize for a fairly large mistake.  As I was putting together today’s data, I noticed a mistake in the Strategy Chart I posted yesterday (and have posted before).  The upshot?

– 1st round LBs are much more successful than I had listed them.

Obviously this affects the Dion Jordan comments yesterday and will affect my draft analysis going forwards.  Sorry for the misinformation, just a typo in excel that I missed.  Thankfully I caught it before we start incorporating the data into the PVM rankings.

Now back to the subject:

If you haven’t seen the post showing the top 15 breakdown, please read that here:

Top 15 Breakdown

That post illustrates pretty clearly that there isn’t nearly as big a difference between, say the #5 pick and the #12 pick, as some people believe.  However, there is a big drop-off after #15.  In general, the real “first round” is picks 1-15.  Hence my point about the advantages of trading down from #4 but remaining in the top 15.  There is some positional loss from trading down (no QBs in general), but overall it appears to be a good strategy.

For those wondering, I also did a positional breakdown post for the Top 15 picks here.  That’s also a must-read for anyone interested in the draft, as it gets to the “prospect tiers” aspect of strategy.  Please note that both of those use a slightly different time-frame than we will use today.

Now let’s look at success rates for the first round.  Here is the complete chart, with the first round broken into three segments.  Following is each segment by itself to make it easier to read.  The data does not include this past season, so pro bowlers/all-pros from this past year are not included.

Screen Shot 2013-03-20 at 11.54.05 AM

Screen Shot 2013-03-20 at 11.55.33 AM

Screen Shot 2013-03-20 at 11.56.58 AM

Screen Shot 2013-03-20 at 11.57.25 AM

Before we start analyzing, I want to warn everyone about the danger of small sample sizes.  The reason I haven’t typically broken the draft into such small sections (1-5) is that when you do that and combine it with a positional breakdown, the samples get way too small to draw any conclusions from.  For example, there have been just 2 safeties drafted in the top 5, Sean Taylor and Eric Berry.  Both were/are very good players and each made the Pro Bowl.  However, it’d be wrong to suggest that the odds of a top 5 safety making the pro bowl are 100%.  In light of that, try view this data in a proper context.

Now the takeaways-

– Notice that the odds of getting an All-Pro caliber player fall significantly after the top 15.

– QBs, as we’ve discussed, are very risky throughout the first round, but especially so in the second half of it.  Just 45% of QBs drafted between 16-32 became “starters”.   Just one of the 11 became a Pro Bowler (Aaron Rodgers).

– The charts certainly support the point I made earlier: The “first round” of the draft should really be viewed as just the top 15 picks.  Odds of success fall dramatically after that, so it’s unreasonable to hold all 1st round selections to the same standard.

– Obviously positional distribution is a major factor here.  Since the best QBs are typically taken high in the first round, we can assume that those selected towards the end of the round are lesser prospects.  Compare that to positions like G or TE, which are not typically taken high.  As a result, it makes sense that those positions would carry greater odds of success towards the end of the first round.

– In all, this highlights the importance of BPA discipline.  Just because you need a QB doesn’t mean you should take the best one available.  As we can see above, taking the best prospect, regardless of position, is a much better strategy.  Note I still believe in adjusting for positional value, but BPA with that adjustment remains, by far, the best draft strategy.

– RBs are really terrible value picks and should be taken in the 1st round much less often.

– Regarding the Eagles, the data shows that, regardless of which position the team selects, it has good odds of getting an elite player.  With several “needs”, the Eagles main focus should be on minimizing risk.  Blowing the #4 pick because you picked “potential” over “performance” or were focused on one position would be a HUGE missed opportunity.  I’m not directing that comment at any prospect in particular, just trying to emphasize how important it is for the Eagles to maintain BPA discipline.

Sorry again for the bad LB data. I’ll be updating the full chart and reposting next week.

I’m on the road the rest of this week, so NO POSTS TILL MONDAY.  I may be able to respond to comments, but full posts will not be possible.

Thanks for reading.  I appreciate all the feedback and hope you continue to find this blog interesting.


Draft Strategy Chart

Today let’s take another look at our draft strategy chart, this time using it to talk about a few prospects.  Some of you have seen this, newer readers have not.  I apologize if its tough to see without zooming in, but I like to get a comprehensive look with this chart.  Note that the 6th and 7th round columns were included in yesterday’s post.  The sample is all players drafted from 1999-2011.Screen Shot 2013-03-19 at 3.12.35 PM

The different color backgrounds reflect my quick attempts to eliminate sub-optimal round/position choices (in black).

Between now and the draft, I am hoping to mine this in a little more detail and ultimately combine it with the PVM system.  However, for today, let’s talk about specific players.

First, a note on value.  Obviously applying this chart to individual players is a misuse of the data.  There is no guarantee that the sample is representative, and there are potentially a lot of other factors at work.  In general, I believe the value of this type of data is to give us a sense of which positions are easier/harder to evaluate.  For example, LBs seem to have a much larger margin of evaluative error than OTs.  Therefore, a LB with similar ratings to an OT will carry more inherent risk by virtue of the fact that, historically, LB projections are less accurate.

Hopefully that made sense.  We’ll be revisiting this a lot in the next few weeks.  Now let’s get to the players.

Dion Jordan – He immediately pops out because A) he’s been frequently “mocked” to the Eagles, and B) plays a position that carries the worst 1st round hit rate.  This doesn’t mean Jordan won’t be a good player, only that LBs are very hard to project coming out of college.  This is a major reason why I do not like him for the #4 pick.  Added risk, no additional reward.  With a lot of similarly rated prospects, no reason to take on any additional risk.  Also, notice that the odds of finding a starting LB in the second round are almost as good as in the first round.

Star Lotulelei – I’ve been a big proponent of Star for as long as this blog has been up (I may have actually been the first one to peg him to the Eagles).  I still believe he is among the best potential picks for the Eagles.  He’s a run stopper and a natural pivot on the d-line, able to hold his ground against a double-team, allowing the LBs  to fly to the ball.  Heart condition notwithstanding, Star would immediately become the Eagles 5-tech and could play NT as well if Spooky doesn’t perform.  However, the chart above is a bit of a red flag.  DTs carry some of the lowest “elite player” odds (all-pro, pro bowl) as well as relatively low starter odds.  Additionally, the odds of finding a starting DT in the second round are good.

Once I figure out how to factor this in to the PVM model, I expect to see Star move down the board a couple of spots.  For now though, he remains a personal favorite.  In a perfect world, the Eagles would trade down to #7 or #8 and pick him up there.

Joeckel/Fisher – The Eric Fisher train has picked up a bit of speed recently, especially with the Eagles sitting out the OT FA market (for the moment).  I’m not a huge Fisher fan, but the odds clearly submit him as a “low-risk” pick.  It is common knowledge at this point that OTs are safer picks in the 1st round than any other position, and the data definitely bears this out (im not counting Cs due to sample size).  HOWEVER, that is an overly simplistic way of looking at it.  You also have to account for the fact that OT is one of the EASIEST positions in which to find contributors later in the draft.  You won’t get an elite OT after the first round, but notice you still have 25% chance to get one as late as the 4th round (and 13% in the 7th).

Let’s play a quick probability game.  Assume that this data was perfectly representative of the upcoming draft.  The Eagles have four 7th round picks.  If the team were to use all 4 of them on OTs, what would the odds of finding a starter be?

Well the chances of missing, according to our table, are 87%.  The chances of missing with all 4 picks are .87^4, or 57%.  Therefore, the odds of NOT MISSING all of them would be 43%.

A 43% chance isn’t great, but it’s pretty significant, and remember this is in the 7th round.

In the second round, 70% of OTs in our sample ended up as “starters”.

This is a long way of saying that the Eagles resources, according to the current prospect rankings and team needs, are probably better spent elsewhere than on an OT in the 1st round.

Dee Milliner – Another guy who has picked up steam (the 40 time helped a lot).  He could go as high as #1, though I think that’s unlikely.  I like him because he is ranked #1 by PVM, though we’ll have to wait and see if he holds onto that position as ratings are updated.  The major pushback on him is that he doesn’t rate as a “shutdown” corner.  Obviously, if you are using the #4 pick on a CB, you want him to be an “island” sort of player.  However, this is a pretty ridiculous read of the situation.  Essentially, draftniks are comparing Milliner to CBs in OTHER drafts.  Obviously there have been better CB prospects.  The fact remains, though, that in THIS draft, Milliner is by far the best CB prospect, and is also one of the best prospects PERIOD.

You can chalk this up to bad timing for the Eagles, in that they got a high pick in a relatively weak draft (projected), but at the end of the day you have to play the cards you’re dealt.  The table above says DBs are pretty safe in the first round.  For those asking, CBs and Ss are not separated because the often switch positions coming out of college or in their first few years (or last).  I’m doing some work to fix this, but keep in mind that this is also a potential advantage.  If a CB fails in the NFL, he may be able to switch to Safety and become a productive player.  If a WR or QB fails (or most other positions), there is no outlet  to salvage that prospect.  Consequently, DBs are lower risk.

In case you didn’t realize it, this is a big thumbs UP for Milliner.

Geno Smith – This chart definitely throws the brakes on the Geno hype.  QBs have a very low success rate, even in the first round (relatively).  That would make me wary of drafting a QB with more than a couple small flaws in his game.  I still think Geno goes high (top 5), but I wouldn’t want to be the team that takes him.

The chart illustrates just how hard it is to draft quarterbacks.  Remember that it isn’t a “reach” just because a QB went higher than his rating suggests.  Hitting on a QB offers a MUCH greater reward than hitting on any other position (hence the PVM adjustment).  HOWEVER, with that reward obviously comes greater risk.  For a team like the Eagles, which has a bunch of holes and some existing talent at QB, a high-risk/high-reward play like Geno Smith doesn’t make much sense.


The Benn trade and late round pick philosophy +other thoughts

Aiming to keep it a little shorter today. I’ll start with the Benn trade and then throw some food for thought out there.

Benn Trade (Steal?)

As everyone now knows, the Eagles acquired Arrelious Benn from Tampa Bay over the weekend.  The Eagles, in exchange for Benn, essentially traded down this year from the 6th to 7th round, and also gave up a conditional pick next year (no word on the conditional, but we can probably assume it’ll be no higher than a 5th, and likely lower than that).

Initial thoughts?  The Eagles stole him.  Benn is 6’2″, 220 lbs. and was a 2nd round draft pick in 2010.  Great size, but he never hit his potential and was injured last year, only playing 8 games.  Still just 24 years old.

That sounds pretty good, but don’t get too excited.  He is not being brought in to be an impact receiver.  This is, as I see it, another low-risk-medium reward play for the Eagles, and on targeted solely at improving special teams.

The Eagles were among the worst Special Teams units in the league last year, and as we saw with the field position numbers (Eagles last by a long shot), that had a LARGE effect on both the offense and defense.  Benn showed a lot of promise on STs last year, and I have no doubt that’s where he’ll be asked to make his mark.  He is a good downfield blocker, which Kelly likes, but I believe that’s more of a bonus and isn’t a major factor in why the trade happened.

So why is it a steal?

Let’s bring back our draft chart, this time only looking at the 6th and 7th rounds.  To refresh, the chart was put together using every player drafted from 1999-2011.  Players were classified as “starters” if they either started for 5 years or, if they have not been in the league that long, started for at least half the seasons in which they’ve been in the NFL.

Screen Shot 2013-03-18 at 11.27.09 AM

What do we see?  6th round picks, historically, have NOT offered significantly better odds of finding good players than 7th round picks.  Yes, this late in the draft teams are looking for depth, but they are still trying to select the best players possible at the target position.  The numbers above show that, this late in the draft, it’s a complete crapshoot.

In light of this, the Eagles really don’t lose any value by trading from the 6th to the 7th rounds.  Therefore, the Eagles acquired Benn for just a conditional draft pick.  That’s why it’s a steal.  Benn will likely end up being a non-factor, but he’s certainly better than anyone the Eagles would be able to select with whatever conditional pick they end up losing.

Other thoughts:

– I’m very surprised the Eagles haven’t been strongly linked to Sebastian Vollmer, the free agent OT from the Patriots.  I’m assuming the OT market was held up by Jake Long, who signed last night.  If that’s the case we should see the other OTs start to fall into place.  Vollmer would be the best fit.  If the Eagles do not sign a OT, then obviously the odds of drafting an OT go up.  Note this does not mean abandoning the “best available” strategy that Howie is now swearing by.  The team may have looked at Eric Fisher and decided he’s their guy, so no need to sign anyone.

– At this moment, the Eagles’ clear top option for the draft is to trade down with a team trying for Geno Smith.  I discussed this last week.  However, if a trade can’t be made, I think the pick comes down to Fisher (assuming Joeckel is gone), Milliner, or Lotulelei.

Not seeing anyone slotting Lotulelei to the Eagles in mock drafts, but he makes too much sense to me to overlook.  He’s a force in the run-game, which the Eagles need, and will draw consistent doubles, freeing Cox up to wreak havoc.  Also, Lotulelei as a pivot would immediately make Kendricks and Ryans look better, since they wouldn’t have to shed as many blockers to get to the ball.  For reference, Sharrif Floyd seems much more similar to Cox as opposed to complimentary.

Eric Fisher would make sense for the reasons explained above.

Milliner is intriguing because he plays a premier position, is by far the best prospect available at that position, and is the #1 player according to the PVM system.  Note: with the current scouting ratings, his consensus ranking is #3 overall.  The positional value bumps him to #1.

For my money, a defensive backfield with Milliner and Williams does sound a lot better than one featuring Williams and Fletcher and whatever rookie is added in the draft.  I realize there are other CBs on the roster, but they look like slot guys or backups.

I don’t see Dion Jordan being the guy, unless the Oregon ties come into play.  Seems like he’d be a luxury pick that the Eagles can’t afford.  He doesn’t look like the best player on the board and doesn’t fill a pressing need (arguable), therefore he doesn’t seem worth the #4 pick.

Also remember that LBs carry the worst hit-rate of any position in the 1st round.  For whatever reason, there seems to be a much bigger margin of error in scouting/projecting LBs than in most other positions.  Consequently, Jordan would appear to be a higher risk pick as well.

In any case, we should get a better sense of the draft in the next couple weeks, as each team’s needs come into clearer focus.