As promised, I have completed a relatively dramatic overhaul of the PVM system. Just as I did in the original post, I’ll explain the methodology and theory first (and changes) and then list the updated rankings. Feel free to skip to the bottom if you don’t care how the system works.
Please note that this is still far from a finished product. There are a number of issues (mostly calibration) that I will only be able to address after collecting several years of data. Additionally, I’m posting it now so that I can incorporate and comments/criticism prior to the draft.
The Theory
The original PVM system was meant to function as a better determination of BPA (Best Player Available) rankings. In essence, a player’s scouting grade is not enough. A complete system will account for positional value and positional risk IN ADDITION to the scouting grade.
Basically, this system is an attempt to provide a “Default BPA Ranking”, against which all team drafts can be compared/graded. The original system included two components, scouting grades and a positional value multiplier (hence the PVM name). Today, we’ll add a measure of risk to the formula.
Methodology
As mentioned above, the system is composed of three components:
Consensus Scouting Grade – Player/Positional Risk Adjustment + Positional Impact Bonus
Consensus Scouting Grade
This is the easiest part. I compiled prospect ratings from 3 4 reputable sources: Scouts Inc. (ESPN), NFL.com, the National Football Post, and Draft Ace. The NFP’s scale is different, so those number were adjusted for an apples-to-apples comparison. Additionally, NFP includes letter grades/modifiers that were not incorporated here. Each source is weighted equally, with the average score taken as the “Consensus Rating”.
Player/Positional Risk Adjustment
This is the new addition to the system. Obviously, some players/positions carry more risk than others. I’ve attempted to quantify that using two measures: standard deviation of the scouting ratings and historical positional miss rates.
Positional Miss Rates: To quantify the positional risk, I looked at every player drafted in the 1st or 2nd Round between 1999 and 2011. Basically, players selected in the 1st and 2nd round are expected to be starters, regardless of position. The miss rate is an attempt to see which positions have larger margins of evaluative error. Here are the rates I arrived at:
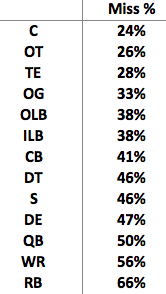
A player counts as a “miss” if they did not start for at least 5 seasons (according to Pro-Football-Reference.com) or, if they have not been in the league that long, have not started at least half the time. Note that my historical data does not break out LBs by outside/inside, hence the same miss rate.
As you can see, there is a very wide disparity in success rates. As expected, offensive linemen are “safer” picks, while offensive skill positions are the riskiest.
Here’s where calibration comes into play. The scouting grades are out of 100 points. To arrive at a positional risk measure, I multiplied the historic miss rates by 100, then took the square root of that. For example, the risk adjustment for the TE position would be 100 * .28 = 28. SQRT(28) = 5.27.
That’s the first half of the risk measure.
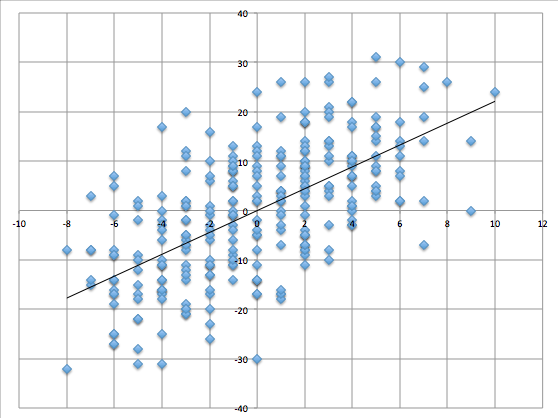
I then took each player’s rating standard deviation and multiplied it by .5. Basically, the idea here is that wide agreement among scouts should equate to more certainty and vise-versa. Therefore, a high standard deviation means we are less certain about the consensus rating. A low standard deviation means we are more certain. I took half of the SD measure to avoid overly penalizing players with high consensus grades but high standard deviations. On the pure SD measure, players with lower grades across the board can jump players with higher grades across the board, by shear virtue of small deviation.
I then added this to the positional measure explained above to arrive at the Risk Adjustment. The Risk Adjustment is subtracted from the consensus prospect rating.
For Example: Sharrif Floyd’s consensus rating is 92.98. His standard deviation multiplied by .5 = 1.66. His positional risk measure (DT) equals 6.76.
6.76 + 1.66 = 8.42
So Floyd’s Risk Adjustment is 8.42, his score after accounting for risk is 84.56.
Now we need to add our last component, positional value.
Positional Value Multiplier
The overall idea here remains the same as the original system. However, I’ve changed both the sources of data and the subset included.
Previously, we used the average cap hit for each position across the entire league. Since the NFL has a salary cap, the relative allocations should tell us how teams, in general, value different positions.
However, those measures included rookie contracts and contracts for players not expected to contribute at their position (like a special teams ace).
So here’s what I did instead:
First I went to Pro Football Focus and counted how many players played more than 50% of their team’s snaps at each position. I did this to account for positional scarcity (e.g. there are a lot more WRs than Cs). I then took 25% of those measures so that we will only be looking at players considered well above average at their position (at least by pay).
Then I looked up the top _ contracts at each position and found the average value at each position.
I used those averages to create new positional multiplier values. Here are the new measures:
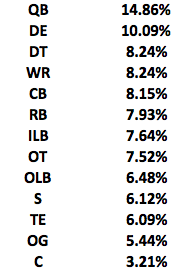
Compared to the original measures, there is a wider disparity. For instance, the QB measure was previously 9.07%, significantly less than the new measure.
Just as we did before, I used these measures to inflate the Risk Adjusted Prospect score for each player.
To recap: We start with the Consensus Ratings, Subtract a Risk Measure to account for player rating uncertainty and positional scouting error, then inflate according to the PVM numbers to account for positional impact.
Overall, the biggest flaw right now is the calibration of the Risk Measure and PVMs, their subjective. However, I attempted to balance the relative magnitude of both of them. Additionally, if we step back and look at the overall measure, we see that relative importance is as follows:
– Consensus ratings (by far the most important)
– Positional Value and Risk
– Individual player rating uncertainty
That looks right to me, as far as what I’m going for. As I mentioned above, the only way to arrive at a “correct” calibration is to use the system for several years, then analyze the rankings to see which parts of the formula are over-weighted and which are under-weighted.
By all means, if you have thoughts as to how to improve the system, let me know. We still have a couple of weeks to make revisions/improvements.
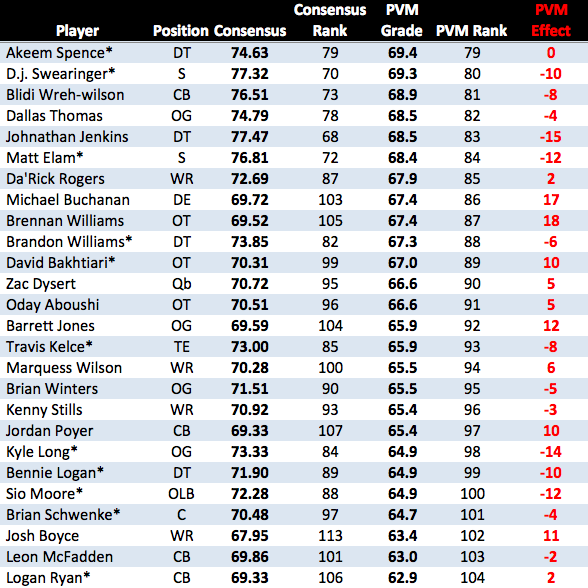
Total Prospect Rankings
Here they are, we’ll talk about them in more detail starting tomorrow.