
Yesterday we took a look at the success rates of different positions by draft position and round. Today, we’ll use the chart to go a step further, identifying Position/Round combinations that are clearly sub-optimal and eliminating them. After doing this we arrive at a modified chart that provides some valuable information and can greatly inform draft strategy. Please note that this analysis is based on the general philosophy that says: The draft should be used to maximize talent and increase the overall skill level of the team. Free agency and trades should be used to plug roster holes. I’ll detail why I believe this is the case tomorrow.
First, a few caveats. All of this relies on the assumption that our sample (draft picks from 1999-2011) is representative of draft classes going forwards. This may not be the case, but it’s a fairly large sample and I have no reason to believe it is significantly skewed.
Also, when broken down by position and round, we are dealing with small sample sizes. For instance, our sample has just 10 centers that have been chosen in the 5th round, with just 2 qualifying as “starters”. Obviously, this is not a large enough sample to conclude that 20% is the true probability of finding a starting center in the 5th round. This is a good example of why we are refraining from setting strict rules, instead using it to develop a general strategy.
Lastly, the first round of the draft is fundamentally different from the other rounds, especially in the very early picks. The goal in the first round (especially in the top 10) is to find an elite player, regardless of position. Therefore, as a general instruction for using the strategy we develop here: It should be adhered to more strictly as it gets later in the draft. So picks in the first round should be based largely on scouting and player evaluations, whereas picks in the 7th round should be based almost entirely on historical probability. This is particularly important for Eagles fans, since the team has the #4 overall pick. For that selection, throw this chart away and hope for an All-Pro caliber player at whatever position in which that skill level is available.
The Process:
Here is a sample chart comparing three positions and their associated success rates in each round:

Focus on the first two rounds and think about which positions you would select in both the 1st and 2nd round. While there is plenty of room for disagreement, my personal opinion would be that the DE position is the optimal choice in the 1st, despite the DB position having better odds of success. The reason for this is the relative decline in odds as you move later in the draft. In the second round, the DE success rate is just 36%, whereas DB success is still above 50%. Conversely, LBs are clearly not a good decision in the first round, since the success rate for the position falls off very little as you move into the 2nd round, making a 2nd round LB a MUCH better value than a first rounder.
Using that relatively simple analysis and applying it throughout the draft, we get this chart:
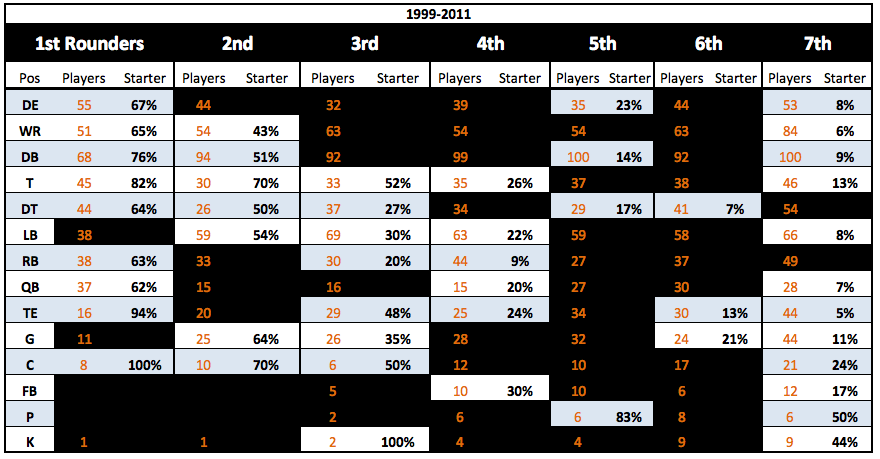
I’ve blacked out areas that, in my opinion, are not good values based on our stats. Consult yesterday’s post if you want to check the odds yourself, but in most cases I just eliminated rounds that offered no better odds of success than later opportunities. Careful observers will note that I could have gone much farther if I applied the relative draft pick value standard to each area. For example, according to the default NFL Draft Value chart, a 5th round pick is worth more than four 7th round picks (a clear example of how flawed the Draft Value chart is IMO). Applying that to the chart, you would obviously rather choose four DBs in the 7th round (9% success each) than one DB in the 5th round (14% success each). However, due to the number of uncontrolled variables and the potential for non-representative samples, we need to be careful not to go overboard and fall victim to false precision.
Now that you know the general idea/process behind the chart, take a minute to look at it and you’ll notice some interesting things (and almost definitely pick up on things that I will fail to mention or haven’t realized).
My takeaways:
– The 5th and 6th round are particularly notable for the small number of positions for which these picks make sense. The 6th round is a relative wasteland, suggesting that at this point scouting means nothing. Therefore, if we stick to the chart, a team should either choose a DT, TE, or G in the 6th round or trade down into the 7th round. Any other decision is an inefficient use of assets.
It’s possible the Patriots realize this, explaining why they were willing to move down a pick in the 6th round of 2011 (trading with the Eagles) for no compensation, in a trade reportedly made “just for fun”.
– This is also a clear illustration of why DEs are so valued by some teams. If you do not choose one in the 1st round, the next opportunity to choose one efficiently isn’t until the 5th round, when your odds of success are just 23%.
– The 7th round might be best used exclusively on the OL. Looking at the odds above, it’s clear that T/G/C have a much better chance of success as 7th round picks than any other significant position.
– RBs are incredibly hard to pick, and it is probably a better use of resources to just sign one in free agency. (Hard to believe for Eagles fans, since both Shady and Bryce were draft picks. These guys are RARE exceptions.)
– WRs are rarely an efficient pick, with just the 1st, 2nd, and 7th rounds as value opportunities according to our chart.
There is plenty more we can do with this information, but I’ll hold off on that until another day. In particular, we can use this to grade teams’ performance over the past decade, which I hope to do soon.

Love your work.
Among the most thought provoking out there.
Thanks, love hearing that.
Pingback: What kind of player can the Redskins expect to draft at No. 34?
Pingback: What kind of player can the Redskins expect to draft at No. 34? | NEWS.GNOM.ES