
Today I’m going to take a shot at divining the relative importance of luck versus skill in the NFL draft. This is a complicated subject, and as such I’ll probably try a few different methods over the next few weeks.
Before I get started, I’d like to note that this is a different analysis than the previous draft performance evaluation I did. Whereas that attempted to grade teams according to how efficiently they used draft resources, this breakdown is purely about maximizing production.
Ranking the teams:
The first step I took was to go back through each draft and rank team performance each year. I used the Pro-football-reference.com CarAV stat to gauge individual player production, then added each to get a measure of every team’s draft class by year. I then ranked each team according to that production for each year and used those rankings to arrive at an average draft performance ranking. This table should make things a bit clearer:

I know it’s tough to see, but those with good eyesight will find annual draft rankings for each team from 1999-2009. The one big note here is that the CarAv numbers do not include this year’s statistics (I haven’t updated my database yet). So players who broke-out this year will not be fully accounted for. Also, this does not account for different numbers of draft picks, so teams that trade picks for players will be undercounted here. This is ONLY a measure of total production.
As you can hopefully see, the Eagles performed quite well by this measure (as they did in our other draft analysis). Here the team is ranked 8th with an average ranking of 14th. The team’s best draft came in 2002, when the Eagles ranked 1st overall (the Brown, Sheppard, Lewis, Westbrook draft).
Other strong years for the Eagles were 2005, when they ranked 3rd overall (Patterson, Herremans, Cole) and 2009 when the team ranked 5th (Shady, Maclin).
Low points for the Eagles were 2003 and 2004 (ranked 28th and 30th).
Also, notice Super Bowl winners Green Bay, Indy, Baltimore, NYG, and Pittsburgh all placed in the top ten.
FYI, if you are examining the chart, you shouldn’t get too hung up on the 2009 rankings (or even 2008), as those are most subject to change once I add this year’s data.
Luck Vs. Skill:
Now that we have annual rankings, we can look to see if performing well one year gives any indication of performing well the following year. If the draft is mostly skill, then those front offices that are “good” at drafting should be consistently ranked towards the top, with “bad” drafters consistently at the bottom. Theoretically we’d see less consistency among the “bad” drafters since presumably being bad would lead either a change in strategy or a change in decision-makers.
The are some obvious caveats before I get to the numbers. I did not account for changes in front office personnel. The CarAv measure is far from perfect, as we’ve discussed before, so the rankings are bit subjective. Additionally, not every team is trying to maximize production. Some use draft picks to fill roster holes, so judging teams by player production doesn’t give them credit if they have other goals in mind (whether they should have any goal besides maximizing production is another story).
Below is the chart, but let me make something abundantly clear before I show it to you. I AM NOT SUGGESTING THE DRAFT IS COMPLETELY LUCK. As I just mentioned, there are a lot of caveats to this type of breakdown. Also, as I said at the top, there are a number of different ways to look at the subject, so we can’t jump to conclusions from just one.
Still…

Pretty much the definition of no relationship.
I also looked at multi-year averages in an attempt to get rid of some of the noise caused by a random bad/good year. Below is the same chart, using average rankings from 99-01, 02-04,05-07,08-09 instead of individual years.
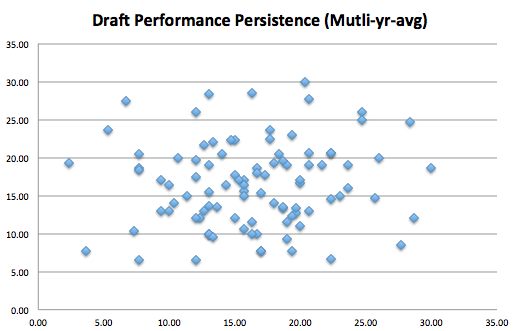
Yet again, nothing there.
Again, this doesn’t mean there is NO skill in drafting, it’s just a starting point that suggests there MIGHT BE a lot of luck (and certainly a lot more than GMs would like people to think). I’m going to try to account for some of the holes and weaknesses in this analysis, and I’ll repost when I finish. There is a lot of potential noise here.
One more chart:
This is the frequency chart of our rankings. Sure looks a bit Normal doesn’t it? (Normal=random). The standard deviation is 3.37, meaning if it’s normally distributed we would expect about 68% of the values to be between 13-19 (inclusive). In our table, 22 out of 32 are within that range….or 68.75%.
Additionally, we’d expect 95% of the values to fall within 2 standard deviations (outside the 10-22 range in our table). We have 2 30/32…or 93.75%.
What this means (I could be wrong, I’m not a statistician) is that if luck was the sole determining factor for the draft performance rankings, you’d get a distribution that looks A LOT like the one we see above.
Lot’s more to do on this subject, but for now its Luck 1 – Skill 0.
