
Today I’m going to take a shot at divining the relative importance of luck versus skill in the NFL draft. This is a complicated subject, and as such I’ll probably try a few different methods over the next few weeks.
Before I get started, I’d like to note that this is a different analysis than the previous draft performance evaluation I did. Whereas that attempted to grade teams according to how efficiently they used draft resources, this breakdown is purely about maximizing production.
Ranking the teams:
The first step I took was to go back through each draft and rank team performance each year. I used the Pro-football-reference.com CarAV stat to gauge individual player production, then added each to get a measure of every team’s draft class by year. I then ranked each team according to that production for each year and used those rankings to arrive at an average draft performance ranking. This table should make things a bit clearer:

I know it’s tough to see, but those with good eyesight will find annual draft rankings for each team from 1999-2009. The one big note here is that the CarAv numbers do not include this year’s statistics (I haven’t updated my database yet). So players who broke-out this year will not be fully accounted for. Also, this does not account for different numbers of draft picks, so teams that trade picks for players will be undercounted here. This is ONLY a measure of total production.
As you can hopefully see, the Eagles performed quite well by this measure (as they did in our other draft analysis). Here the team is ranked 8th with an average ranking of 14th. The team’s best draft came in 2002, when the Eagles ranked 1st overall (the Brown, Sheppard, Lewis, Westbrook draft).
Other strong years for the Eagles were 2005, when they ranked 3rd overall (Patterson, Herremans, Cole) and 2009 when the team ranked 5th (Shady, Maclin).
Low points for the Eagles were 2003 and 2004 (ranked 28th and 30th).
Also, notice Super Bowl winners Green Bay, Indy, Baltimore, NYG, and Pittsburgh all placed in the top ten.
FYI, if you are examining the chart, you shouldn’t get too hung up on the 2009 rankings (or even 2008), as those are most subject to change once I add this year’s data.
Luck Vs. Skill:
Now that we have annual rankings, we can look to see if performing well one year gives any indication of performing well the following year. If the draft is mostly skill, then those front offices that are “good” at drafting should be consistently ranked towards the top, with “bad” drafters consistently at the bottom. Theoretically we’d see less consistency among the “bad” drafters since presumably being bad would lead either a change in strategy or a change in decision-makers.
The are some obvious caveats before I get to the numbers. I did not account for changes in front office personnel. The CarAv measure is far from perfect, as we’ve discussed before, so the rankings are bit subjective. Additionally, not every team is trying to maximize production. Some use draft picks to fill roster holes, so judging teams by player production doesn’t give them credit if they have other goals in mind (whether they should have any goal besides maximizing production is another story).
Below is the chart, but let me make something abundantly clear before I show it to you. I AM NOT SUGGESTING THE DRAFT IS COMPLETELY LUCK. As I just mentioned, there are a lot of caveats to this type of breakdown. Also, as I said at the top, there are a number of different ways to look at the subject, so we can’t jump to conclusions from just one.
Still…

Pretty much the definition of no relationship.
I also looked at multi-year averages in an attempt to get rid of some of the noise caused by a random bad/good year. Below is the same chart, using average rankings from 99-01, 02-04,05-07,08-09 instead of individual years.
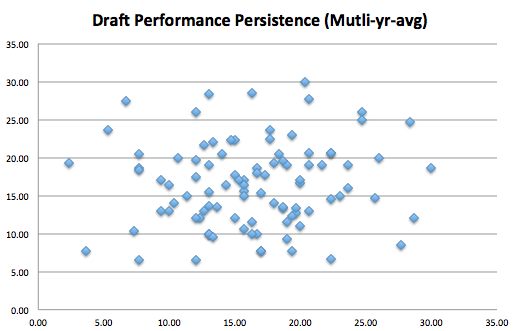
Yet again, nothing there.
Again, this doesn’t mean there is NO skill in drafting, it’s just a starting point that suggests there MIGHT BE a lot of luck (and certainly a lot more than GMs would like people to think). I’m going to try to account for some of the holes and weaknesses in this analysis, and I’ll repost when I finish. There is a lot of potential noise here.
One more chart:
This is the frequency chart of our rankings. Sure looks a bit Normal doesn’t it? (Normal=random). The standard deviation is 3.37, meaning if it’s normally distributed we would expect about 68% of the values to be between 13-19 (inclusive). In our table, 22 out of 32 are within that range….or 68.75%.
Additionally, we’d expect 95% of the values to fall within 2 standard deviations (outside the 10-22 range in our table). We have 2 30/32…or 93.75%.
What this means (I could be wrong, I’m not a statistician) is that if luck was the sole determining factor for the draft performance rankings, you’d get a distribution that looks A LOT like the one we see above.
Lot’s more to do on this subject, but for now its Luck 1 – Skill 0.

Great stuff. I had to blink twice and scroll up and down on my browser when I saw the “Draft Performance Persistence” chart. I’ve given this some thought and I perhaps can offer a plausible explanation: CarAv is the issue. The measurement rewards teams who: 1. play rookies immediately, and 2. avoid free agency. This maximizes the CarAv of the player through longevity at the position, and also rewards the team because they use a lot of rookies. I would argue that the top 5 (and even top 10) teams are known to follow the “home grown” approach. This obviously leaves more roster sports for drafted players, ergo more CarAv draft value. I have an interesting solution to this issue: weight the team totals for CarAv against team wins from Year of player draft to end of sample data (e.g. 2011 Eagles would get a 12-20 record weighted against their CarAv). This may better illustrate the “effects” of the players on team performance and show which teams are really winning in the draft.
One more suggestion: perhaps looking at the standard deviation of each team’s draft performance will show something a different picture. Good teams should have less SD (consistency), while bad teams should have a higher SD (they may miss or hit due to error). A quick critique would be that bad teams would be “consistently bad”, but I think there are more “lucky hits” on false negatives than whiffs by good teams on false positives.
CarAv definitely has some issues, which is why Im going to try to adjust it a few ways. Playing rookies definitely helps juice the numbers.
However, the teams here get credit for the players they draft, regardless of which teams those players end up on (I should have made that clear). The idea is that a team should get credit for talent identification and selection, even if the players go on to be good for other teams. So the Eagles get credit for Derrick Burgess. I know its not perfect, but Im trying to isolate the draft from things like coaching/scheme. THe theory is if the player is talented, they’ll be successful somewhere.
I did consider looking at the SD of each team, but I was worried about how small the sample is. Teams with skill should have less variation though, so I’ll take another stab it.
I’m going to make a few adjustments to the CarAv and rerun (ill add this years stats and adjust for draft position). That should gives us a better idea.
Still, I was pretty shocked to see the above analysis come out as COMPLETELY random. I expected a small positive relationship. Maybe just too much noise, but now I expect the next analysis to be quite random as well.
Hope to have it up next week.
Thanks for the quick reply. The issue we run into by rewarding teams for draft picks that end up starting elsewhere is that there is a very finite number of starting positions in the NFL. For example, the Eagles signed Jason Babin, thus effectively reducing the snaps for Brandon Graham. The Eagles appear to have a weaker draft, despite Graham arguably being a better player than Babin. If the NFL was a pure meritocracy, this would not be an issue. However, GMs and coaches are self motivated to justify their acquisitions and start expensive FAs over draft picks (see Babin and Nnamdi). Thus drafted talent does not always have a chance to prosper.
I also have some issues with viewing a player’s success outside of the organization as representing “drafting acumen” by the team. The point of the draft is to maximize effective team talent, not to maximize individual player talent. I would hypothesize that drafting a player who ends up being a better fit elsewhere is an example of under-utilizing the draft, and indicative of drafting error rather than drafting skill.
These are not factual statements and may just be me reaching to explain the seemingly random data. Let me know if you disagree with the aforementioned assertions.
The other problem with adjusting by team success is you end up in the ludicrous situation where the Tim Tebow draft year looks like a better deal for the Broncos because they got rid of him and brought in Peyton to win a bunch of games.
As to free agents, in your Babin example, they signed him one year after they’d drafted Graham. If they’d been confident in Graham after what they’d seen in him for the first year, they would not have done that. That’s as much an indicator as anything else.
I think there’s lots of value in the numerator here. It’s not perfect, but no stat ever is, and CarAv is better than just counting starters or Pro Bowls the way so many people do.
Having said that, I still think there’s a lot more work to be done on the denominator. This works for looking at total drafted value over a 10-year period, but if you want to compare Year1 to Year2, you really need to control for the number and order of picks made in each year. That goes double if you’re trying to look at year-to-year performance to see if this is luck or skill.
Hey Derek (for some reason I cannot reply directly to anyone but Brent),
Your critique of using w/l to help illustrate the “true success” of a draft pick is fair, but I am not sure the example you are providing is illustrative:
1. It is pretty much a consensus that P. Manning was the greatest FA acquisition in history, thus by definition making the example an outlier. Plus, if the Broncos made the playoffs with Tebow, it is arguable how much value Peyton actually brings to the team. Remember, the team also has a top flight defense and a lot of talent on the offensive line. Tebow/Manning aside, generally teams that miss on a first round QB pay the price for it with their W/L record.
2. Graham was also coming off an injury, so signing Babin as at least “insurance” was very prudent. Also signing Babin’s former coach, however, ensured that Babin would start irrespective of performance (see 2012 season).
Since we do agree that the W/L multiplier is not perfect, however, perhaps weighting it would resolve some of the “false positives” that it may provide. One option is to weight it less in future years (y1 = 1.0, y2= .95, etc.). Another option is to play around with what the W/L ratio actually means. You are thinking of it as a pure multiplier, but perhaps the relationship should be discounted (i.e. CarAv * (1 + (W-L)/16)). Just some food for thought. ^^
Pingback: Let’s Kick It Again … and a look at Washington’s draft history