
Last week I showed a couple of tables that illustrated the relative performance of each Eagles team under Andy Reid (other than his first year). To do that, I compared the PPG and Points Allowed Per Game to EVERY other team from the past 10 years. The results were interesting, and showed that the Eagles typically performed very well in at least one of those categories; but also showed that while offensive performance trended up over time, the defense fell off by a larger amount.
The problem, though, is that the analysis did not take into account the annual league-wide scoring fluctuations, and specifically, the general increase in scoring over the past 13 years. I’ve done a similar analysis today, but this one shows how each team performed relative to the rest of the league FOR THAT YEAR.
Before I get to the charts, here’s an example of what I did (it’s very simple):
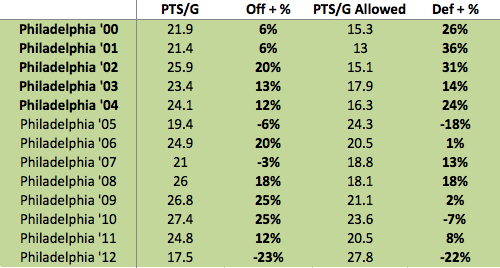
The 2002 Eagles scored 25.9 PPG. The NFL average that year was 21.7.
The Eagles scored 4.2 PPG more than the league average or 20% (4.2/21.7).
The tables below will show the % over or under league average for each Eagles team.
First, the Eagles Offense:

As we can see above, after his first year, Andy Reid’s offense only finished below-average 3 times, with 2012 marking the only really poor performance. Interestingly, the best offensive years for the Eagles were in 2009 and 2010, when the team was 25% better than the league average.
The 2004 Eagles team, the Super Bowl team, was just 12% better than league average. However, that team (after clinching) shut it down for the last two games of the season, scoring a combined 17 points in losses against the Rams and Bengals. If we remove those two games, the 2004 Eagles averaged 26.4 PPG, or 22.5% better than league average. While that is a very strong performance, it still doesn’t rank better than the ’09 or ’10 teams, and is just above ’02 and ’06 teams.
Taking a step back, we can compare the “Andy Reid Peak” to the rest of his tenure and get an idea of how things changed. For this, I’m going to ignore last season, since it was a clear outlier.
Andy Reid Peak (’00-’04) – The Offense averaged 2.4 PPG more than the league average.
After Peak (’05-’11) – The Offense averaged 2.8 PPG more than the league average.
Or put differently, during The Peak the offense, on average, was 11% better than league average. After the Peak, the offense was 13% better than league average.
So over time, the Eagles’ offense got better (which we knew from last week), but by a relatively small margin.
Now let’s look at the defense:

This table shows a much clearer break between the “peak” and “after-peak”. Four of Andy Reid’s best defensive performances (and 5 of the top 6) came during the 5 seasons “Peak” stretch. During this time, the Eagles defense allowed an average of 5.5 FEWER PPG THAN LEAGUE AVERAGE. That’s a truly amazing run of performance. On a percentage basis, the team was, on average, 26% better than the league-wide average.
After the peak, the Eagles allowed an average of 0.5 fewer points per game (2%) than the league average, which means the Eagles went from being a historically great defense (from ’00-’04) to being an average one.
Here is a table showing the performance of both the offense and defense side-by-side, and a graph showing the performance of each over time:
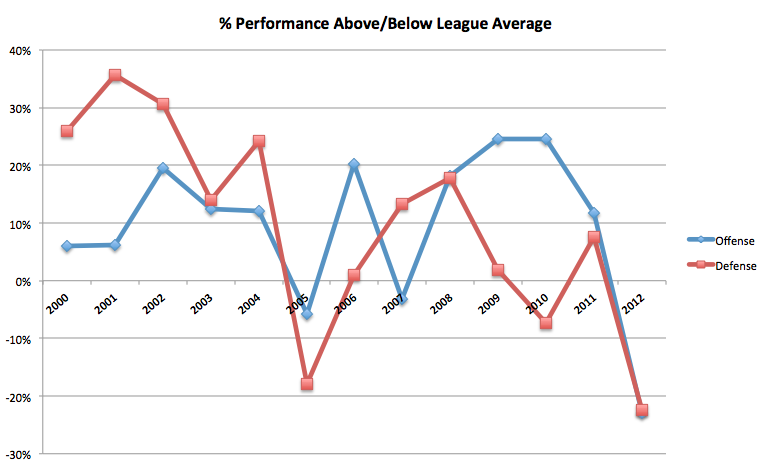
Here is another chart, which hopefully provides a clear illustration of the overall performance trend for both the offense and defense.

This chart provides the clearest picture yet of the overall shift in team performance as time passed. While it’s not as easy to see as I had hoped, the slope of the defensive line (red) is much larger (absolute value) than the offensive line (blue). That means the team’s offensive gains were MORE than offset by corresponding drops in defensive performance.
Tomorrow I’ll show you how the best offenses and defenses since 2000 and how they stack up when adjusted for league average. Hint: the 2007 Patriots were OUTRAGEOUSLY good on offense (which we knew), but so were the 2000 Rams (who everyone remembers but forgets just how dominant that offense was).
