
I’ve gone over a lot of different statistics over the past few months, most of which illustrated just how bad the Eagles were last year. Throughout that effort, I’ve been attempting to come up with a way to visualize all of these stats together. The goal is to create a kind of dashboard that shows, at one glance the strengths and weaknesses of the team and its performance relative to historical averages. Today, I’d like you to look at a first draft.
I’m far from an expert at Excel (at least when it comes to the graphing tools), so if you know of a better way to visualize the data, please let me know. Here’s what I’ve got so far:
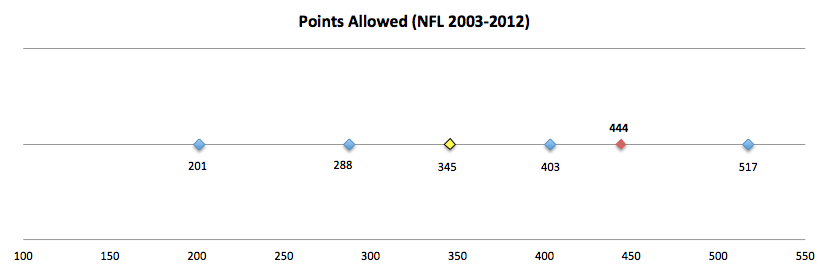
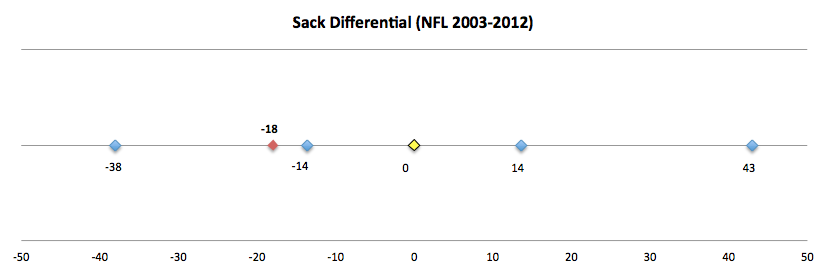
Below are several charts that each contain 6 data points. They are as follows:
Max, Min, Avg, +1 StDev, -1 StDev, and the 2012 Eagles
I’ve highlighted the 2012 Eagles in Red and the Average in Yellow. The timeframe for included data is noted at the top of each chart.
For example, here is Points Scored:

So the 2012 Eagles scored 280 Points, which is significantly worse than the time period average (345), but within 1 standard deviation (272).
Simple enough? It’s not elegant, but my hope is to create something for which I can show a lot of charts next to each other with minimal explanation. Hopefully, since they’re all formatted the same, it will be easy to visualize everything at once. I’ll list a few more below so we get a better idea of what it would look like.
In the run-up to the season, I hope to put a comprehensive set together so we can see all of last season, statistically, at a glance. Hopefully, this will also help illustrate which areas of the game we should expect significant improvement in.


Interesting? Suggestions?
———————–
Tonight is the NBA draft. Normally this isn’t that noteworthy of an event, unless the Sixers have a high lottery pick (tonight they pick 11th). However, the Sixers have a new GM, so perhaps something interesting will happen.
Most mock drafts have the Sixers taking a Big (C/PF), noting that the team “needs” help at that position. That analysis is remarkably short-sighted. Given the structure of the game (small rosters, 5 men on the court at a time, etc…), the NBA is HEAVILY dependent on “stars”. This means that NBA teams should draft BPA no matter what. It is even more important to do this in the NBA than it is in the NFL (and we’ve seen how vital it is in the NFL).
Fortunately, the new GM (Sam Hinkie), is a member of the “analytics” crowd, so surely he knows this. I don’t follow the NBA draft nearly as much as the NFL draft, so I won’t make any specific player recommendations. However, even though he hasn’t made a single move yet, I have more confidence in Hinkie than I’ve had in any Sixers GM during my lifetime (28 years). That itself is cause for optimism.
It may be time to start paying attention to the Sixers again. If you’ve tuned out the past couple years, let me catch you up on everything you NEED to know:
– Jrue Holiday is VERY good, and has a legitimate shot at being a “star”-level player.
– It is VERY difficult for the Sixers to sign marquee free agents because Pennsylvania has a state income tax (unlike Florida or Texas). It might also be because Philly is not a “warm-weather” location, but I think that aspect is largely overblown (you’ll hear it a lot from the press).
There you go, you’re caught up. The rest would just make you sad and remind you why you tuned out in the first place.
