
Today we’re going to revisit the Run/Pass play selection series I began a few weeks ago. For those of you have didn’t see it, here are the primary articles:
Marginal Value of 1 yard on 3rd and 1
Nash Equilibrium and 3rd Down Strategy
The overall theme of the articles was that NFL play-callers are not running as often on 3rd and 1 as they should. I supported this argument with a fair amount of evidence, using expected points and run/pass success probabilities. However, there were a couple of holes in there. Today I want to close one of those, refining the analysis and consequently lending it more confidence.
First, from the first link above, this is what I’m talking about:
Let’s just assume for a second the odds of success for each are equal to the Run/Pass odds we saw yesterday (I know that isn’t right, but its instructive). That means the expected payout for each is:
Run: 2.39 expected points * 70.7% success = 1.69 Expected Points
Pass: 2.65 expected points * 54.6% success = 1.45 Expected Points
For that to be correct, that expected yardage for a run on 3rd and 1 would have to be 1 yard and the expected yardage for a pass would have to be 5 yards, neither of which is likely the case. However, as you can see, the difference in expected yardage gained would have to be very big to account for the difference in success rates.
The section in bold highlights a particularly large potential weakness, which I’ve now fixed. Using the Pro-Football-Reference play finder, I was able to provide a higher level of resolution. For my data set, I used all 3rd and 1 plays run over the past 5 seasons. From this, we need the following pieces of information:
– The average gain of a successful run on 3rd and 1.
– The average gain of a successful pass on 3rd and 1.
– The odds of success for a run.
– The odds of success for a pass.
Using the play-finder, we can see that the average successful run gained 4.43 yards. The average successful pass gained 11.26 yards.
While I previously used this site for out success rates, we can now find them ourselves using Pro-Football-Reference. Since our data set is now just 5 years, we need to update our rates. Over that time frame, on 3rd and 1, run plays succeeded 69.3% of the time. Pass plays were successful 57.7% of the time.
Now we have our building blocks. Just as we did before, we can use them in combination with Expected Points (AdvancedNFLstats.com) to calculate the expected value of each (run/pass), which will tell us which is the better choice (on average for the league).
To refresh, here is the expected value of each yard line:

Using this concept, we can calculate the value of the average gain on 3rd and 1 for both run plays and pass plays. For example, given 3rd and 1 at the 20 yard line (opposing), a successful run can be expected to gain 4.43 yards, leaving the offense with a 1st down between the 16 and 17 yard line, which is worth 4.35 expected points. Similarly, a successful pass will gain, on average, 11.26 yards, giving the offense a first down between the 8 and 9 yard line. That position is worth 4.86 expected points.
However, we’re not done yet. We need to factor in the different success rates. Here is a table, summarizing the previous paragraph and adding the expected success rates:

As you can see, once we factor in the expected success rates, the Run option stands out as the optimal choice. It’s expected value is 3.01 versus an expected value of just 2.81 for the pass option.
If this sounds counterintuitive, remember the chart I gave you in the “Marginal Value” post, seen below: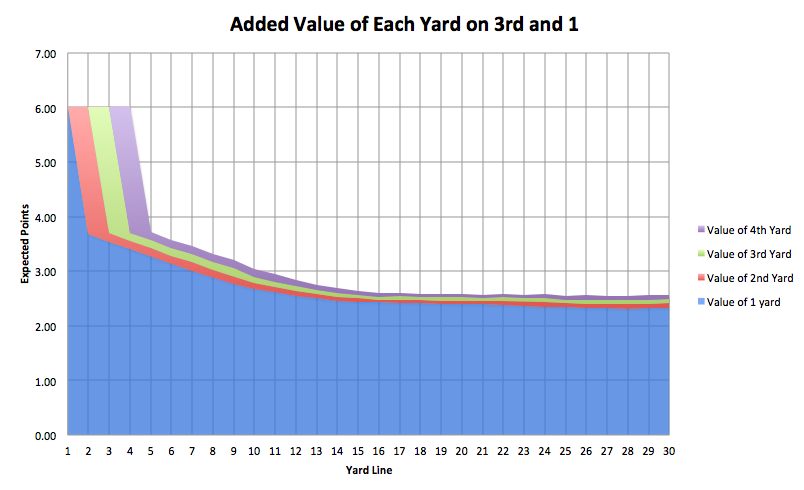
The bulk of the value in any successful 3rd and 1 play lies in the first yard gained. To that end, sacrificing additional yards in exchange for a higher success rate is typically a good trade-off.
Finally, I ran the numbers at each yard line, giving me this chart, which shows the expected value of a run and a pass at each yard line, in a 3rd and 1 situation:

Now that’s interesting. It’s hard to see, but the optimal play call switches from run to pass at the 53 yard line (so own 47 yard line) as you move farther away from the end zone. Here is chart that illustrates the difference more clearly.
Values above zero mean the Run is the better option, values below the axis mean Pass: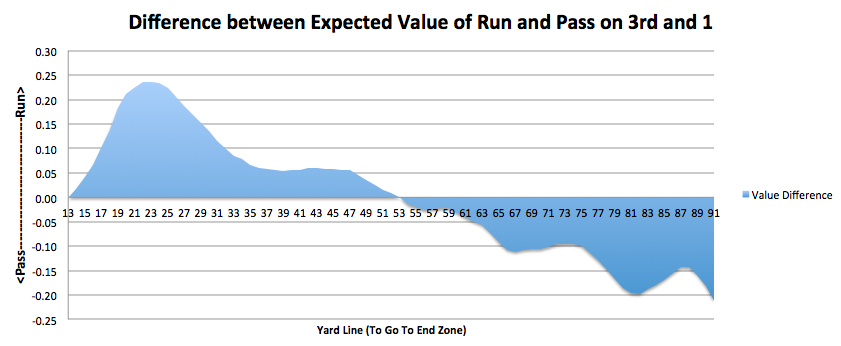
So it looks like our overall thesis needs some updating. Note that the lumps in the data (particularly on the right side of the chart) probably reflect statistical anomalies in the Expected Points data. Theoretically, that should be a smooth line. However, the magnitude of the difference isn’t that important, so it doesn’t effect the overall point.
Given recent NFL success rates on 3rd down and the expected value of a first down at each yard line, NFL teams should RUN when they are beyond their own 47 yard line, and PASS if they aren’t. Note that the values once again converge with 13 yards to go until the end zone. Obviously, beyond that the 11.26 average pass gain gives you a TD, which skews the results and likely isn’t representative of what happens in real life (presumably the average gain for a pass declines when you’re that close to the end zone, it kind of has to).
We can also assume that if NFL play-callers followed this analysis, the success rates would change, leading to the overall equalization in expected value of a Run versus a Pass, eliminating the inefficiency. That point would represent the Nash Equilibrium. However, until that happens, smart NFL teams can exploit this for an advantage.

Really like this. I had some misgivings about the earlier article but you have addressed them very well. Good job.
Something that may fold into this: how field position affects net punting yards. If you punt from the opponent’s 40, your optimal result would be to net 39 yards but what is the expected result? Would it be better to go for it on 4th and 4? How about from your own 40? How do the numbers change? Intuitively, I would expect going for it in the first instance to be a good bet; in the second, not so much.
As you can tell, this is going to be an analysis that requires more work. I hope to make periodic improvements to the resolution (for example by getting expected yardage for each section of the field).
That ties into the 4th down play calling as well. Now that I’ve discovered the PFR tool, it’s a lot easier to do this stuff, so we’ll be able to get more actionable intelligence, rather than just high-level theory with a bunch of caveats. 3rd and 1 and 4th and short are the two situations I’m most interested in, so I’ll tackle the whole punting vs going for it in more detail at some point (like I did today with the 3rd down scenario).
On Thu, Aug 22, 2013 at 2:09 PM, Eagles Rewind
Just curious, does this account for QB scrambles. Cause if not this would certainly inflate the running success rate. Only successful QB runs would count as runs, non-successful ones would count negatively against the pass.
Good catch. It does not filter out QB scrambles, nor can it at the moment. It should skew the results a bit, as you’ve suggested. However, given the number of included plays I’m hoping the skew isn’t extreme. Regardless, that’s an area for future improvement.
As I just said to the other comment, think of this analysis as very much a work in progress. I hope to make incremental improvements over time. Tackling it all at once just isn’t an option at the moment.
On Thu, Aug 22, 2013 at 2:39 PM, Eagles Rewind