
Limited commentary with this post, because it’s somewhat self-explanatory. I decided to go back and calculate an on-going QB Rating for several prominent players to see how each would have looked, statistically, after every appearance made. Obviously, this relates to Nick Foles. Basically, I cannot think of a single QB who has had a start to his career anywhere near as good as Foles has (statistically) and then NOT gone on to have a good career. However, I figured it would be instructive to look at some successful QBs and see how they progressed over time. Below is the chart.
Before we get there, though, a PSA: The NFL QB Rating calculation, while useful, is very convoluted. Almost nobody knows it or has even seen it, so for your education, here it is (from Wikipedia):
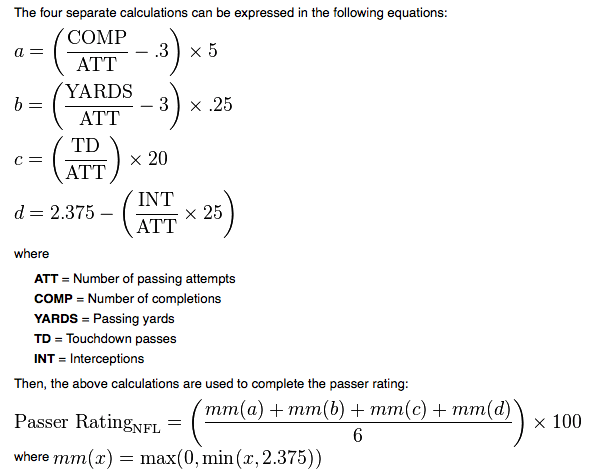
Fun stuff, eh?
Anyway, back to the subject. Here’s the graph, I suggest you click to enlarge:
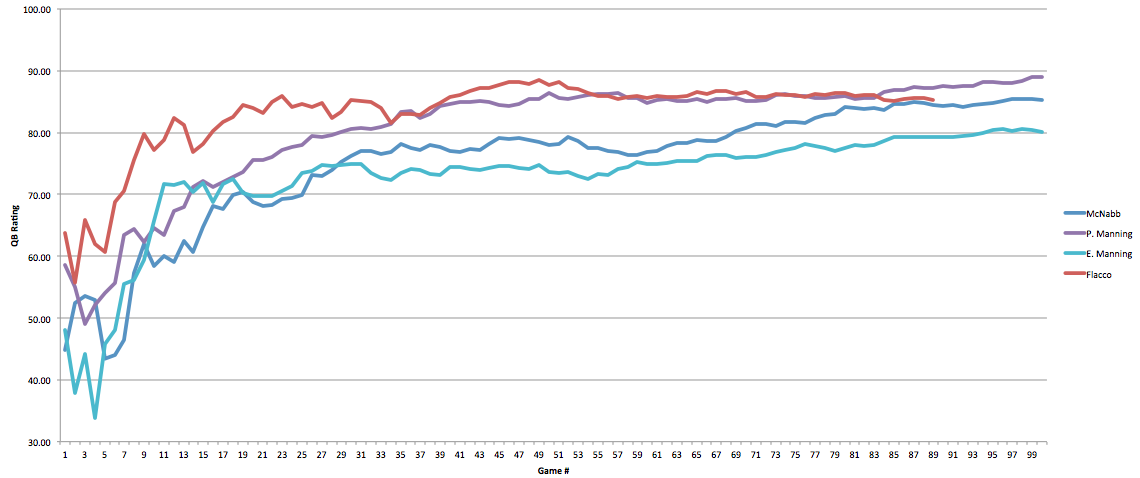
I only included the first 100 appearances (NOT starts) for each player. Note that this is an ongoing calculation, so it becomes less susceptible to change with every appearance. I’m hesitant to draw any conclusions from such a small sample size, but including other QBs (I originally included Vick, Brady, Brees, and Josh Freeman) makes the graph too hard to read.
In any case, I’m going to build the sample from here to see if we can divine a good idea of when, regarding Foles, we can exhale. For now, just take note of how “poorly” each of the included QBs played to start their careers. And because you knew I would, I included Foles below, along with Brady and Brees. Notice that none of these guys had as high a QB rating after 14 appearances as Foles does. Moreover, among these guys, Foles tracks most closely with…Tom Brady. I know attempts would be a more helpful measure, but I don’t have data for that, so…this:

Update: Should have noted this originally, but the chart doesn’t account for the general offensive inflation the league has seen since guys like Peyton started their careers. Regardless, the adjustment would only involve shifting Foles’ line down slightly, and would’t significantly change how things look. The trend, obviously, would remain the same.

Nice use of selection bias….are there comparables out there where QBs with hot starts fell off the wagon in their second, third or fourth year? Not saying that’s going to happen to Foles but curious what future lie ahead other Foles becoming the next Tom Brady (without the super star good looks)
I was actually looking specifically for “false positives” and haven’t come up with much at all. Certainly nobody who has had a rating like Foles this far into his career…still looking though
I haven’t really done any of the work, but the guys who come to mind are Charlie Batch, Matt Ryan, and maybe even Cam Newton.
(And I haven’t looked up any of those guys. They are just guys I remember being trumpeted early in their careers more so than later.)
RGIII had the best passer rating / td – int ration ever for a rookie i think.
Another interesting thing shown well by this data/graph is a “Rule of 25”–that QB rating plateaus very predictably at approximately start 25. There is huge variance before that and very little after.
and that’s what I want to works towards. Once I add a lot more QBs to the sample, maybe we can divine some sort of guideline that will tell us ho long we have to wait for Foles’ performance to be “set” or at least anchored within a predictable range.
Thanks for putting this together Brent. Great work!
Greg Cosell, without citing any statistical basis, claimed that it takes 20 starts before you can tell how good the QB is. He said that after a while, the NFL defenses get to know the QB better and how to best defend against him, and that it’s how well the QB adjusts at that point that firms up his success or failure.
Zach, I think the lack of variation has more to do with the stats being averaged than it does a veteran QB not having ups and downs.
You may have seen this already, but it seems right up your alley: The Coach Who Never Punts
http://www.grantland.com/story/_/id/9970245/grantland-channel-coach-never-punts
He never punts and always goes for onside kicks, because science.
Good stuff. I wonder how Foles compares against some of the other up and coming qbs like luck, rg3, Wilson, etc.
Once I get a good sample of established (and failed) QBs, then we can compare the new guys and see how they’re doing.
I like the “running average QBR” concept, and it does seem like a viable method for determining when the sample size has become sufficient, and you “know what you have.”
In the same way that comparing Foles to established good quarterbacks like Manning, Brady, Brees, et al. shows that he’s on track, I’d be interested to see him compared to some of the rising stars of the past four years (which would also eliminate the offensive inflation effect). A chart with the 2012 QB class (Foles, Luck, RGIII, Wilson, Tannehill), then maybe also include Stafford, Bradford, Newton, Andy Dalton…
Brent –
With your keen eye toward 4th down decisions, I’m curious what you think about today’s decision to go for it, 4th and 1 at WAS 38, 13:16 left in the 4th quarter, Eagles up 24 – 0.
At first blush this seems like exactly the sort of “go for it” scenario you’ve described before, but my gut reaction (even as a 4th down renegade) was to punt.
I realize a touchback would only net 18 yards and the reward for getting the 1st would be considerable clock chewage, but is that a situation where the risk / reward strongly favors aggression? Up three scores with the defense playing well (at that point), how much worse would it have been to back Washington up to make them earn a first down in “hostile” territory.
I guess clouding matters is Kelly’s inconsistency with 4th down strategy. He seems conservative at times, which is why I was surprised he went for it then…
Maybe I’m just all aflutter with 4th downs now…
The way I saw that thought process was ‘If we get it, we’ve pretty much won the game. If we don’t get it, they still need 3 scores and our D has been playing well.’
Yeah, I firmly supported it. Hope to say a bit more about it in a short post, but generally, should be “conservative” at that point, but that still doesn’t get you to punting from there. Reward in getting it is far greater than risk of not getting it when you factor in difference in field position with a punt
On Mon, Nov 18, 2013 at 3:39 AM, Eagles Rewind
I’m sure you’ll get into this when you list QB’s that may have had prolonged success and then seem to taper off, but Matt Schaub this season comes to mind. Since 2009, he has had a QB rating of 98.6, 92, 96.8, 90.7 and this season it’s 77.8…which actually seems to be higher than many would guess given the perception of how abysmal he has been playing. He still has a career QB rating of 90.7, so it is interesting to see where he goes from here.
I’m interested in this line of thinking. For a QB who starts with a few good seasons and then tails off, is it possible that average QBR is too resistant to change to tell us that the QB is now average?
Could be. Hope to find out. However, it’s not as if the average is weighted towards the better games. If the QB sucks, eventually his rating should reflect that (at least partially).
Derek Anderson? While not ever posting the ridiculously good numbers Foles has posted, Anderson had a strong 2007 before plummeting pretty damn fast.
I think one of the things we need to caution is how much of an advantage is Nick getting based on a pretty new scheme that the NFL hasn’t really seen before? Is it possible that Nick crashes down to earth (Just like he is risen) more like the norm once NFL teams get an offseason to study Chip’s offense?
Definitely possible. However, the lack of interceptions mitigates that risk a bit. His YPA and TD numbers are probably a bit inflated just because of the scheme-novelty, but I don’t see that affecting the INT side of the equation much. Something to keep an eye on though. However, Plenty of tape now available….but we’re still waiting to see them take on a good defense.
I’ll add Anderson to the list for review
THe throwing speed test at the combine had FOles at 57mph. This is more than Cam Newton, Russell Wilson and Joe Flacco. Why are they credited with strong arms and not FOles? Also, Foles may be suffering from the bias of favoring potential over achievements. NObody expected him to do so well, so they think give greater weight to
others with more obvious physical attributes
http://blogs.ourlads.com/2013/03/27/quarterback-ball-velocity-at-nfl-combine-2008-2012/
Chad Pennington is an interesting comparison. In 2002 (first season with significant playing time) he had 11 games with a QB rating of 93.9 or better including 7 100+ ratings. Really was brutally efficient that season. Pennington threw 18 TD’s to 0 INT’s in the RZ (Foles ended at 16/0) and both share knocks about arm strength. I think that comparison is better than the one to RG3 that someone in this comment section brought up. He was very efficient but I think the difference in play style takes away from the credibility of the comparison. I would rather see how players with similar skill sets match up. That’s just my opinion though.
Can’t wait for you to update/add to this particular subject. Great stuff on this site. It’s on my daily rotation of websites to visit.