2014 TPR Rankings

They’re here.  Below you’ll find the TPR rankings for the 2014 draft.  Scroll down if you don’t just want to see the numbers, but there are a few things we have to discuss before getting there.

As you know from my most recent posts, I’ve had to change the formula this year.  Part of that was by design; I always intended to tweak it over time in order to provide a better representation of what I think is, conceptually, the right way to think about the draft.  So what’s different this year?

I’ve dropped the individual standard deviation.  In theory, I still like this variable as a proxy for each prospect’s individual risk.  If scouts widely agree on a prospect’s ability (i.e. rating), that prospect should represent less risk than a prospect for whom there is wide disagreement.  Unfortunately, the change in grading scales has made using StDev much more complicated.  That, combined with the fact that I only have three different scouting ratings for each prospect, means StDev, as I can currently calculate it, is probably not a reliable proxy for idiosyncratic risk.  However, I still hope to use it in the positional ranking charts.

– Without StDev, we’re left with two factors: Systematic Risk and Positional Value.  This year, I’ve combined them into one factor, an overall Risk/Reward Multiplier.  Our stand-in for Systematic Risk is the Positional Hit rate I calculated for each position when I put together my “Hack the Draft” cheat sheet.  I’ve taken that measure, and multiplied it by the PVM values I posted yesterday.  Basically, we’ve now got an “Expected Positional Bonus” that combines positional impact with historical positional risk.  Make sense?

Just to recap, our formula now looks like this:

Consensus Rating * (1 + (Positional Hit Rate * PVM))

Also, I want to remind everyone what the goal is.  We are NOT trying to predict the draft.  Every team has it’s own scheme, for which different players fit and do not fit.  Additionally, while Relative Value (BPA+) is the best drafting strategy, you can’t be 100% blind to need.  For example, the Seahawks aren’t taking a QB in the first round.  The rankings below tell us, in a probabilistic sense, what the default ranking of prospects SHOULD be if we wiped everyone’s roster clean.

In other words, if the league was starting from scratch, this is how I would rank the players.  Note that I’ve shown each factor.  Miss rate does indeed show the miss rate by position.  I’ve adjusted that in the calc (to flip it to Hit Rate), so it’s not a mislabel or mistake.  Also, for the consensus ratings, if NFP did not rate a player, I plugged in a score of 5 for him (which is a very bad score).  NFP claims to not rank anyone they rate as 4.9 or below.  In the far right column, you can see the players for whom the Risk/Reward adjustment made the biggest difference; a positive number means they were helped by the adjustment.

Here’s the top 150, sorted by TPR Rank:

Screen Shot 2014-04-28 at 9.25.57 AMScreen Shot 2014-04-28 at 9.28.48 AMScreen Shot 2014-04-28 at 5.56.38 PMScreen Shot 2014-04-28 at 9.29.59 AMScreen Shot 2014-04-28 at 9.30.54 AMScreen Shot 2014-04-28 at 9.31.55 AM


2014 Positional Value Multipliers

As promised, I’ve calculated new positional multipliers for 2014.  Obviously, the main purpose of deriving these values is to apply them to our Consensus Ratings.  However, before I did that, I wanted to give the Multipliers their own post, because they show slight differences from last year.

As a refresher: The general idea of the multipliers is to properly account for the differing impacts of each position.  For example, a QB has a much bigger impact on the game than a Center does.  Therefore, all other things being equal, the QB prospect will be of more value than the C prospect.  The question is, how do we account for this?

Fortunately, the NFL has a salary cap, which means the league has done our work for us.  Since each team has finite resources, the way they distribute their cap space can, in theory, tell us how they value each position.  Looking at the league numbers in aggregate, we can get a sense of the default relative value the league places on each position.  However, it’s not as easy as just taking an average of every salary at each position.

We’re mostly concerned with the top of the draft (first 3 rounds), where teams are, hopefully, trying to identify and select future starters and stars.  Additionally, we have to account for positional scarcity.  There are a lot more CB snaps than QB snaps, by virtue of two CBs being on the field for every offensive play.  So, here’s what I did:

1) Used Pro Football Focus to determine how many players at each position played at least 50% of their team’s total snaps.

2) I then divided each of those measures by 4.  Basically, this tells me how many players are in the top 25% at each position.

3) Then I simply took the average of every cap hit that fell within that measure.

For example, 28 QBs played at least 50% of their team’s offensive snaps last year.  Divided by 4, that means 7 QBs comprise the top 25% of starting QBs (roughly speaking). The average of the top 7 QB cap hits this year is $18,407,457.

Pretty straightforward.  I did that for each position, then used their relative values to arrive at the PVM values listed below.  Next to them are last year’s values, along with the change year-over-year.

Screen Shot 2014-04-26 at 11.26.30 PM


The biggest gain in value was at the Center position.  The multiplier for Centers, while still relatively small, is 2.87% higher than it was last year.  Conversely, both CBs and RBs have seen their values decline somewhat substantially.

Perhaps most interesting is the placement of Safeties.  Despite the conventional wisdom being that Safeties are increasing in importance, the values above show they’re actually worth LESS than they were last season.

The top four spots remained the same (QB, DE, DT, WR), but after that, the order shuffled quite a bit.  However, note the spread of values between the 2nd highest and the lowest for both years.  As you can see, this year there’s a much narrower range.  With just two years of data, we can’t draw any substantial conclusions, but it’s certainly something to keep an eye on.

Next up, we’ll slap the Consensus Ratings and the PVM values together, along with our Risk factors (which I’m changing slightly), and arrive at our PVM Big Board…finally.  Sorry for getting this up so late in the game.  Turns out the NFL’s new draft schedule coincides precisely with law school finals.

Consensus Ratings

I’m compiling this year’s PVM Rankings, and the first step is to compile the consensus scouting ratings.  If you remember, I take the average of each prospects individual rating from ESPN (Scouts, Inc.), NFL.com, and the National Football Post.  I use this as a proxy for prospect quality, and then apply the additional bonus and risk factors I’ve explained before.

Anyway, NFL.com and NFP are actively trying to destroy this exercise.

Check out the table below.  I’ve taken the top 20 players from last year and lined them up with the top 20 players this year (by Consensus Rating).

Screen Shot 2014-04-24 at 9.56.16 PM

The reason for the significant difference is that both NFL.com and NFP have changed their grading scales.  Not only did the site switch to a 10 point scale, but it looks like the relative value changed as well.  That means that even after adjusting for the new scale, the ratings aren’t directly comparable. However, even accounting for that difference, it looks like ratings are lower across the board.  NFP did not make any adjustments that I can see, it just rates this year’s players as worse prospects.  (As always, please correct me if I’m wrong.)

Last year, NFL.com’s ratings were out of 100; this year they’re out of 10.  Previously, the 85-95 rating tier was defined as: “Immediate Starter – An impact player with the ability/intangibles to become a Pro Bowl player.  Expect to start immediately except in a unique situation (i.e. behind a veteran starter).

This year, the top tier, 9-10 is defined as: “Once-in-a-lifetime Player”.  8-9 is now defined as: “Perennial All-Pro”.

NFP has made a similar switch.

As you can see, this is a fairly dramatic departure.  The upshot, unfortunately, is that we won’t be able to compare this year’s draft class to last year.  It’s possible that both of these organizations believe the new systems are superior to the ones they used last year.  It’s also possible that they’ve realized changing the scales makes it really hard to critique the ratings over time.

Whatever the cause, the result sucks for us.  It shouldn’t hurt this year specifically (and may help if the new systems are, in fact, superior), but we can no longer compare players year-over-year to answer questions like: Where would Jadeveon Clowney rank compared to last year’s prospects?

Still working through potential adjustments, but for now, here are this year’s top prospects, by consensus rating (as I’m currently calculating it, which is just an average).

Screen Shot 2014-04-24 at 9.57.03 PM

Draft Talk and Chip Kelly’s Alpha

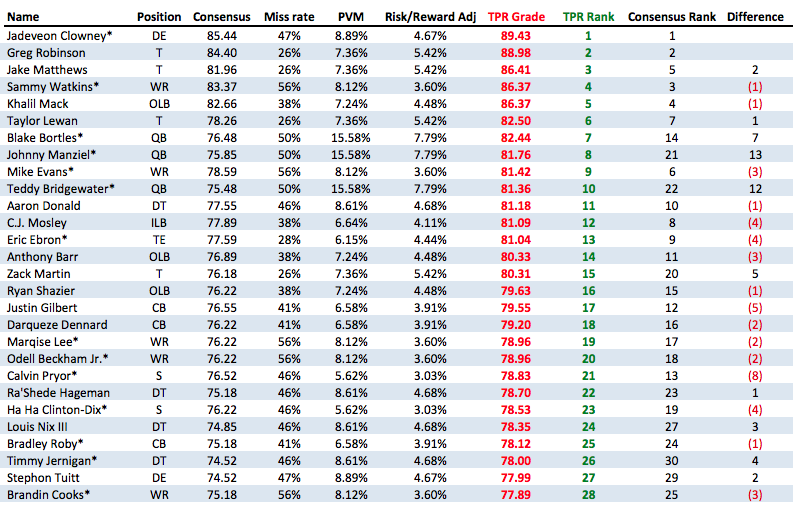
Sorry for the silence recently, haven’t had much time to get a post up.  However, the draft is approaching quickly, and there’s much to do in preparation.  I do intend to compile the PVM rankings again this year, with a few updates to the formula.  For now, though, I want to look at things from a higher level.

Over the past few weeks I’ve seen a lot of mock drafts and projections.  Many of them have the Eagles selecting a WR in the first round.  I’ve spent a lot of time in the past explaining why it’s foolish to project a specific position for any team, assuming their drafting the correct way, but this particular projection has other issues as well.

First, there seems to be a pretty big inconstancy in some of the logic.  The basic story seems to be:  Without DeSean Jackson, the Eagles really need another weapon on offense.

To me, that makes very little sense.  Perhaps if the Eagles were an incompetent organization.  But they’re not.  The Eagles did not NEED to cut Jackson.  There was no deadline or legal problem or imminent salary cap issue.  I disagree pretty strongly with how the team handled that whole situation, but I think it’s safe to say the Eagles would NOT have released Jackson if they felt it would create a huge hole in the roster.

The counter to that is to suggest that the Eagles felt comfortable cutting Jackson precisely BECAUSE they knew they could get a good WR in the draft.  On the surface, it makes sense.  At least it does until you remember that the Eagles can’t KNOW ANYTHING about the draft.  It’s impossible to project who will and will not be available when the Eagles pick.  Banking on a certain player or one of 2/3 players to be there when you pick is an absolutely terrible strategy.  Nothing Howie or Chip has done to date suggests they’re that stupid.

Morevoer, if the Eagles felt they could replace D-Jax in the draft, why wouldn’t they just wait and make sure?  Again, the Eagles didn’t need to cut Jackson WHEN they did it.  To my knowledge (and please correct me if I’m wrong), there was no bonus or salary cap impact that would have ben different had they waited until draft day.

Put simply, if the Eagles felt that they needed to:

a) Get rid of Jackson

AND

b) replace him with another weapon at WR

then they would have been much better served by waiting until the draft.  There just isn’t a good reason to believe the front office wouldn’t have realized this or wouldn’t have cared.  Therefore, it’s likely NOT an accurate read of the team.

Instead, I think there’s more credence to the asset allocation theory behind Jackson’s release.  Basically, the Eagles may have decided that they do not wish to tie up a lot of cap space in the WR position.  Paying Jackson $12 mil a year obviously kills that goal.  Instead, Roseman might be looking to teams like the Patriots and Saints for a template.  Of course, both of those teams have HOF QBs, so it’s a tough template to match, but the basic logic is sound when you consider the main point of today’s post:

Chip Kelly’s Alpha

Let’s start with a straightforward question:  What is Chip Kelly’s competitive advantage (if any)?

The real answer, at this point, is “we don’t know”.  However, we can probably all agree that if he does have an advantage, it’s the result of his offensive abilities.  Assuming that’s the case, it raises another question:  In a salary-capped league, what’s the best way to leverage that advantage?

If Chip’s competitive advantage is the ability to outperform on offense, does that mean the team should devote more resources to that side of the ball, or less?  The answer, at least as I see it, is very clearly LESS.

Remember that each team, by virtue of the salary cap, has a finite allotment of resources with which to build a roster.  Given the same allocation on offense, we’re assuming Chip Kelly can squeeze more production from it than an average coach.

This needs a more detailed treatment (which I intend to give it), but the key is that there is an upper limit to how good offenses can be.  I will fill this in with data later, but conceptually, we’re talking about diminishing marginal returns.  Adding a great player to a mediocre offense will have a larger marginal effect on production than adding that same player to an already great offense.  There is only one ball, and only so many plays an offense can run (even when going at a high pace like the Eagles).  Think back to the 2007 Patriots.  Adding another Pro Bowl WR to that team would not have made much of a difference in terms of points scored; they simply could not get much better.

Applying that to the Eagles situation, it raises an interesting strategic question.  If we assume Chip can utilize offensive resources at a higher rate than other coaches, what’s the optimal allocation for him?

As I said above, I need to revisit this point with data, but my guess is it’s a relatively low amount.  The Eagles, because they have Chip Kelly, can achieve an above-average offense while spending just an average amount.  That’s Chip Kelly’s alpha.  If he’s as good an offensive coach as we hope, it could be a MASSIVE advantage.  Every dollar saved on the offense can be applied to the defense.

The upshot is, the Eagles probably don’t need to be using 1st round draft picks on “weapons”.  Naturally, the team needs to reach a minimum threshold of talent on that side of the ball, and perhaps they’re no there yet.  But in theory, we should be seeing a lot more spending on defense than on offense.

Looking at it from that perspective, the Eagles should probably NOT take a WR in the first round of the draft.  There’s certainly some BPA/relative-value analysis that has to go into that, but barring something crazy, a WR is unlikely to be the “optimal” pick.

That assumes the Eagles don’t think they’re far from the optimal offensive allocation point. We don’t know that, but the Jackson release might provide some insight here.  Specifically, the Eagles just got rid of a star WR because he was a) an asshole and b) expensive.  While rookie WR are much less expensive than Jackson would have been, the fact is in a few years they’ll be right back where they started.  I think they avoid it and rely on Ertz’s development, Maclin’s return, and Chip Kelly’s alpha to get by on offense, allowing them to over-allocate to the defense.

That’s the theory at least.