The season is just one week away, and I haven’t been able to do anywhere near as much as I’d like to regarding a season preview. However, I’ll try to remedy that this week, starting with a lightning-round style rundown of potential areas for regression. Before I get there though, take a minute to download your copy of the 2014 Eagles Almanac here. Just $10 for a PDF, and you’ll find a lot of great articles to get you ready for the season.
Now, the important things.
Before last season I spent a lot of time explaining why the Eagles would likely rebound strongly from the 4-12 season. I projected the team to win 9 games and challenge for the division title when most pundits had them relegated to 5-6 wins. What did I know that they didn’t? Regression factors.
It won’t be news to any readers here, but there is a large degree of luck involved in nearly every aspect of the game of football. A few specific areas, in fact, have a significant impact on the game and are almost entirely random. That means we can get a lot of information about this year’s expected performance by looking at last year’s statistics and combing for outliers. For example, the 2012 Eagles recovered just 35% of all fumbles. Fumble recovery is almost all luck, and we’d expect a team to recover close to 50%. That means, holding all other factors equal, the Eagles were likely to improve last year because they were very likely to recover a greater percentage of fumbles. For the 2013 season, the Eagles actually recovered 43.75% of all fumbles. That’s still less than we’d expect, but it’s a sizable improvement from 2012.
Now that I’ve explained it, let’s take a look at a handful of specific areas for which we’d expect mean-regression.
Pythagorean Expectation
This isn’t really a “mean-regression” candidate, but it’s vital to point out. Last season the Eagles scored 442 points and allowed 382 points. That performance would lead us to expect a Win/Loss record of 9.4-6.6 (from Pro-football-reference.com). The upshot is that the Eagles record was slightly better than they “deserved”. A difference of .6 wins isn’t big, but the direction is important. The Eagles weren’t quite as good as their record from last year suggests.
Fumbles and Fumble Recovery Rates
I covered this a bit in the example above, but this is pretty low-hanging fruit as far as statistics with the potential for mean-regression. Last season, the Eagles recovered roughly 44% of all fumbles. They fumbled the ball 1.1 times per game. Both of those numbers are good news for Eagles fans. 1.1 fumbles per game is close to average, and a 44% recovery rate suggests the Eagles are more likely to be better this year than worse.
However, there is one potential flag. Opponents fumbled the ball 1.7 times per game when playing the Eagles. That placed them tied for 1st in the league (with 4 other teams). Now, if you remember this post from last year, you’ll know that there is no significant persistence in forced fumbles from year to year. Here is the chart:

Therefore, we can’t say that the Eagles were “good” at forcing fumbles last year and will be again this year. Instead, we can expect that other teams will NOT fumble the ball as often as they did last year. That’s bad.
However, 1.7 fumbles per game is not an outrageous amount. So while there will probably be some regression, it won’t be huge and it might also be balanced out with positive regression in the overall recovery rate.
Fumbles verdict: Neutral
Injuries
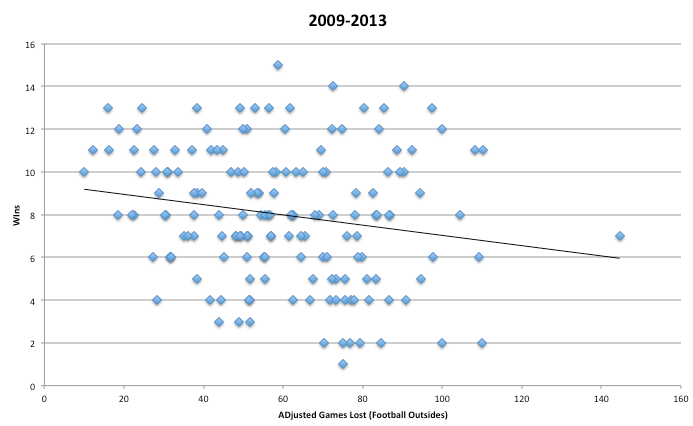
I covered this a couple of weeks ago, but it’s important enough to repeat. According to Football Outsiders, the Eagles were 2nd in the league last year in Adjusted Games Lost (behind Kansas City). That means they were healthier than every other team, as measured by this statistic. Here’s the good news: AGL might persist. I looked at this stat in last season’s run-up, and found a correlation value of .30. So, at least within the data I had, a good performance in AGL one year DOES suggest an increased likelihood of a good performance the following year. Also, we have Chip Kelly’s “sports science” regime to consider. It’s certainly logical to believe improved nutrition and fitness will lead to fewer injuries. This is actually a really important aspect of the Eagles season to track. If Chip Kelly really can keep his team healthy to a greater extent than other teams, it will be a big advantage for the Eagles going forwards.
Overall, we still have to expect some regression. The Eagles will probably not finish in the top 2 again in AGL. Still, with the modest persistence in AGL and Chip Kelly’s focus, I don’t expect as much regression as we might otherwise assume.
Injuries verdict: Slight negative
Interceptions
I won’t spend much time on this one, because I cover it in the Almanac and have addressed it previously. Basically, Nick Foles was so good last year at avoiding interceptions that it’s nearly impossible for him to duplicate that performance. However, Foles college and rookie stats do suggest an ability to avoid interceptions. Hence, I expect Foles to throw interceptions at a higher rate, but to still rank among the best in the league in that category. All other things equal, though, this is a negative regression indicator for the team.
Interceptions verdict: Negative
Field Position
This one is a bit under-the-radar. Net Starting Field position is a byproduct of both turnovers and special teams, making it largely random from year-to-year. Here is a persistence chart showing 5 years of data from Football Outsiders (2008-2012):

The correlation value is 0.14. That’s large enough to note, but shows there’s a very large degree of variance from year-to-year.
Last season, the Eagles Net Field Position was 0.93. That means the offense, on average, started with the ball nearly one yard farther than the other team’s offense. 0.93 was good for 11th in the league last season. For reference, the 2012 Eagles had a Net Field position value of -6.67 yards, worse than any team from last season. Kansas City led the league last year with a value of +9.61 yards (which is ridiculous and will definitely regress).
I’ve already explained why the Eagles will likely be worse in the turnover department this year than last. Thus, we should expect field position to be a bit worse. However, we also have to account for special teams. This is a bit qualitative, but it’s clear the Eagles roster is deeper this year than it was last year. That should result in a stronger STs unit. I don’t have much confidence in that “analysis”, though. It sounds reasonable, but STs performance is very unpredictable.
Of course, there’s another major piece to this puzzle that I still haven’t mentioned….Alex Henery. More accurately, the absence of Alex Henery.
According to Football Outsiders, the Eagles had the 2nd worst performance on kickoffs last season, and Henery had the lowest gross kickoff value in the league. I have no idea how well Parkey will play, but at the very least, he has a stronger leg then Henery. Again, that should result in better kickoff performance. Last season the Eagles recorded touchbacks on just 40% of their kicks, which ranked 24th in the league.
So where does that leave us? Well we should expect some negative regression due to worse performance in turnovers. Conversely, special teams can be expected to improve a little, at least in the areas that most directly effect field position.
Field Position Verdict: Neutral
Wrapping it up
There are other areas to explore, but these are the primary ones. I know I haven’t said anything groundbreaking here, and this analysis isn’t nearly as fun as it was last year (when there were a LOT of areas with very large positive regression expectations). However, this is, in general, very good news for Eagles fans.
It says, basically, that last year was not a fluke. The Eagles improved greatly from 2012 to 2013, and whenever you see a 6-win jump in one year, you should look carefully for luck-driven performance. That’s not the case here. The Eagles didn’t win games last year because of anything unsustainable, with the notable exception of Foles interception rate.
Thus, we shouldn’t expect and significant negative regression. The fill-side, of course, is that the team isn’t likely to get a natural boost from any luck-driven areas. That means improvement, if it comes, will have to depend more heavily on the actual skill of the players.
Final note: remember that there’s no guarantee the Eagles will finish where we expect them to in any luck-driven category. Just because the “natural” recovery rate for fumbles is 50% doesn’t mean the team will hit it. As explained above, teams can and do deviate significantly from the mean every year. Just because the Eagles weren’t particularly lucky last year doesn’t mean they won’t be unlucky this year. It’s just not our expectation.