
Given all the hyperventilating going on about Bryce Brown’s supposed fumbling problem, I thought it would be helpful to take a data-driven look into fumbling rates and see if there truly are players with “fumbling problems” or if it’s largely a result of chance.
Verdict? While there are certainly some players that are better/worse than others at holding onto the football, most of it really is a result of luck (despite all the crap you hear from analysts).
How did I get there? Stay with me while I explain:
I gathered a sample of relatively prominent running backs over the past ten years. Admittedly this is non-random, however I wasn’t picking by any specific stat and after reviewing the sample I don’t see any particular reason to suspect that it’s largely skewed (one big caveat that I’ll get to later).
I ended up with 31 running backs of varying career lengths/prominence/etc… I’ve listed the full sample at the end of the post. In all, this produced 167 seasons of 100 carries or more. I then looked to see if there was any correlation between a player’s fumbling rate (fumbles/attempts) from one season to the next.
The end result was a correlation coefficient of .17. For those unaware, correlation coefficients run from -1 to 1, with 1 suggesting perfect positive correlation and 0 suggesting no correlation from one year to the next. A value of .17 tells us that while a player’s fumbling rate from year-to-year is somewhat correlated, the relationship is weak and largely dictated by chance.
So about Bryce Brown: While his fumbling rate this year is very high (3.9%), it’s way too soon to really worry about this as a long-term problem. In fact, within the sample there were 7 RBs who carried a fumble rate of greater than 2.5% over the course of a full season (with 100+ carries). Of those, only one RB recorded that high of a rate a second time in his career (Ricky Williams).
– Hat tip to Matt Swartz from Fangraphs for insight. Follow him on twitter if you like analytical baseball stuff (@Matt_swa).
More Notes from the data:
– The highest fumble rate within the sample was Reggie Bush’s second year with 100+ carries. That year he fumbled 4.46% of the time. However, in every other season of his with 100+ carries (there were 4), his fumbling rate was never higher than 1.89%.
– Just two of the included RBs had career rates greater than 2%, Reggie Bush and Travis Henry.
– The lowest career rate was recorded by none other than Brian Westbrook, who fumbled on just 3 carries out of a total 1385, or just 0.22% of the time.
– Below are the charted season rates for Adrian Peterson and Tiki Barber, two players noted for early career “fumbling problems”. I’ve explained that most of this is likely result of chance, but felt it was interesting to see given the reputation of each player (the chart should probably not have the data points connected given what I’ve talked about, but it makes things easier to see):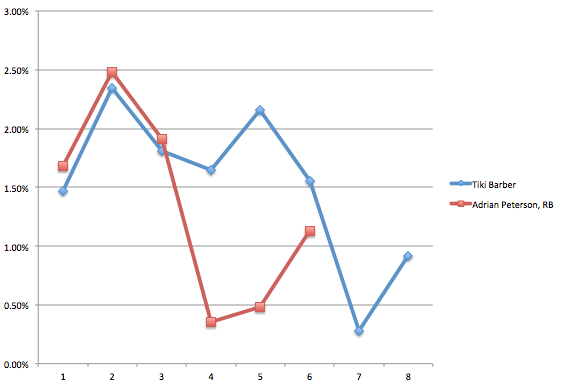
-Now for the caveats: As I mentioned above, this was a non-random sample chosen mainly because I was looking for RBs with a large enough number of carries to make for a significant sample. It’s likely that players who fumble a lot do not get many seasons with 100+ carries, though there were several players included who fumbled a lot in their early career and continued to get carries. I will take a look at the records to see what the fumbling rates look like for players who did not have long careers (at least 3 seasons with 100+ carries).
-The data I used only includes RUSHING fumbles. So if an included player caught a pass and then fumbled it is not counted. I wanted to get a pure representation of rushing. Westbrook in particular, had several fumbles after receptions.
– The data for current players did not include this past week’s games.
– Here is the sample of players used:
| Ladanian Tomlinson |
| Fred Taylor |
| Ricky Williams |
| Eddie George |
| Jamal Lewis |
| Willis McGahee |
| Steven Jackson |
| Frank Gore |
| Clinton Portis |
| Tiki Barber |
| Shaun Alexander |
| Chester Taylor |
| Ahman Green |
| Adrian Peterson |
| Maurice Jones-Drew |
| Travis Henry |
| Marshawn Lynch |
| Brian Westbrook |
| Michael Turner |
| Chris Johnson |
| Willie Parker |
| Ray Rice |
| Brandon Jacobs |
| Reggie Bush |
| Jonathan Stewart |
| Fred Jackson |
| Ahmad Bradshaw |
| LeSean McCoy |
| Felix Jones |
| Arian Foster |
| Jamaal Charles |


