
I told you there was more…today I’ll try to knock a few more things off the list. For this post, I want to focus entirely on the 2013 season. While it’s not a large sample, it does represent the “DeSean under Chip” timeframe. Seeing as how Chip Kelly remains the coach, it seems as though this might be pretty relevant information with which to evaluate DeSean’s importance to the team for next season.
So just how good was DeSean’s 2013 season?
Yesterday I covered Approximate Value and Receiving Yards. Instead of repeating the analysis, I’ll just say that DeSean had a 2013 AV of 11 and 1332 receiving yards. That puts him in a tie for 10th in Approximate Value and 9th in yards.
That’s really good, but hardly spectacular.
BUT…(you knew that was coming), there’s more to consider. Beyond the production, there’s the qualitative (for now) value that DeSean adds to the offense. His unique talent opens up the offense for the rest of the team, with the benefit redounding to other members of the offense rather than appearing in his stat line. Let’s go beyond the generic “his speed stretches the defense” and try to illustrate, with stats, what makes him unique.
Below is a chart illustrating the Catch Rate for a sample of WRs along with their Deep Pass Attempt %. These numbers are from AdvancedNFLStats.com. For the sample, I included every WR who had 40 or more receptions last season.
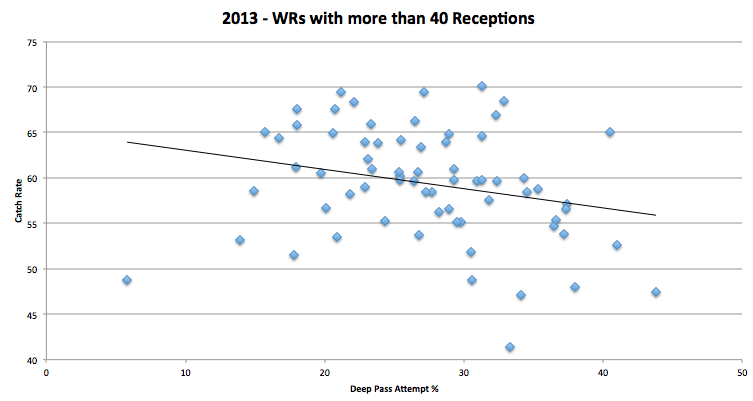
I added the trend line to illustrate the correlation (value is -.25). That’s fairly intuitive. Longer passes are harder to complete, so the catch rate for “deep threats” should be relatively lower.
Now let’s play a game. Go to the chart above. Using just the information displayed, which WR would you want on your team?
I think the answer is pretty obvious, but it might depend on your personal offensive philosophy. However, regardless of your philosophy, it’s clear there are only a couple of logically defensible choices. Now let me try to guess which one you chose.

I thought so. Now for the fun part. As you might have guessed, the player I highlighted above is DeSean Jackson. He’s a fairly significant outlier. In other words, given the frequency with which his targets were “deep”, we’d expect his catch rate to be much lower.
In fact, just two other qualifying players had Deep Pass Attempt rates above 40%, Torrey Smith and Reuben Randle. Smith’s catch rate was 47.4%. Randle’s was 52.6%. DeSean’s was…65.1%. Clearly, one of these guys is not like the others.
Now let’s sort by Catch Rate. Here are the top 20 from last season (remember we’re only including WRs with 40+ receptions.)
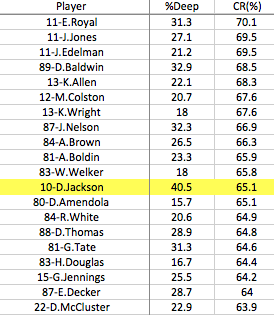
Notice anything interesting? Look closely at the Deep Pass Attempt rate column. Among the top 20, DeSean has, BY FAR, the highest percentage of deep pass attempts. In fact, the next closest player above is Doug Baldwin at 32.9%. That’s a huge difference. Now let’s flip it slightly and sort by Deep Pass rate.
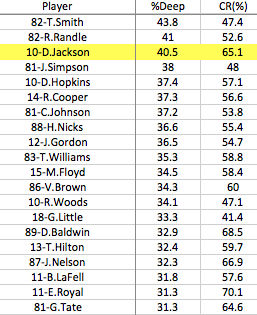
So now we have all of the major “deep threats” represented. Look at the Catch Rate. Again, near the top of the list, DeSean blows everyone else away. Also note that Riley Cooper now makes the list, with the 6th highest Deep Pass rate. However, his catch rate is “just” 56.6%. I say put “just” in quotations because that’s still a very good catch rate, as you can see from the chart. But it’s nowhere near DeSean’s 65.1%.
So, last season DeSean had a Catch Rate similar to the best possession WRs in the game, just behind Wes Welker actually. Of course, he did so while operating as a true “deep threat”. That’s a unique, and extremely valuable combination.
You see, last year the Eagles were able to attack downfield with DeSean without taking the normal reduction in Catch Rate. Obviously, that makes the offense extremely efficient and dangerous. More to the point, not a single other WR in the game put up numbers anywhere close to DeSean, at least not while catching more than 40 passes.
Now, the caveats. It was just one season, so it’s certainly possible that DeSean’s Catch Rate and Deep Pass Attempts combination is unsustainable. We’ll just have to wait and see on this one. Additionally, you could credit a lot of DeSean’s stats to the genius of Nick Foles. That too is possible. Of course, that’s a LOT of credit to give to a 2nd year QB with mediocre arm strength. As always, the “truth” is probably a combination of several factors. One of them, though, is DEFINITELY DeSean’s skill.
Is there more? Well yes, lots more, but let’s keep things relatively short. It turns out AdvancedNFLStats.com also tracks Expected Points Added. I’ve used the Expected Points concept in great detail before, so I’m not going to do a full explanation here. Anyway, here are the WRs who registered the highest EPA last season:
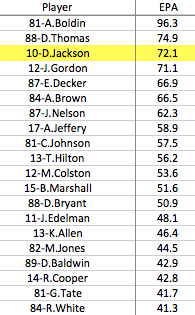
Yep, that’s DeSean, ranked ahead of guys like Josh Gordon, Eric Decker, and Calvin Johnson. On a per play basis, DeSean also ranked 3rd, behind only Anquan Boldin and Doug Baldwin.
Like I said yesterday, DeSean Jackson is a GREAT player. We can argue about what he’s “worth” contract-wise. We can argue about whether he fits the “culture” that the team is trying to develop. We can argue about how he’ll perform as he gets older. When it comes to production to date, though, there is no argument. Since entering the league, Jackson has been among the most productive receivers in the game. Last season, with Chip Kelly calling the shots and Nick Foles at QB, Jackson became a tremendously unique and valuable weapon. Don’t lose sight of that.
Scheme Fit
My final comment is a short one. There was some talk about DeSean not “fitting” the scheme that Chip Kelly is trying to run. Without engaging completely, because I think that grants too much credit to what is a ridiculous argument, let me just say this:
1) Chip Kelly is a great, creative, perhaps genius-level offensive mind.
2) DeSean Jackson, as shown above, is a unique talent and the premier deep threat in the league.
I’ve pretty much proven the second statement. If you’re going to make the “scheme” argument, it stands to reason then, that the first statement above cannot be true. Put simply, if Chip Kelly can’t find a way to use DeSean Jackson in his scheme, then he’s not the offensive mastermind everyone believes he is. Of course, he did find a way to use Jackson productively last season, so….I told you that argument was ridiculous.
Update: I forgot to mention that DeSean ranked 11th by Win Probability Added (also from AdvancedNFLStats.com). That’s good, but given the EPA numbers I expected him to be higher. I haven’t quite figured out a reason for the discrepancy, hence why I didn’t talk about it. However, I don’t want it to seem like I’m hiding “unfavorable” stats, so there you go.

Based on his career, I say last year was a huge outlier year for Jackson:
This is his catch rate the 4 first years of his career:
2009: 52.8
2010: 49.0
2011: 55.8
2012: 51.7
Maybe Kelly’s scheme made it easier for him to catch 15+ yards passes.
Maclin’s career catch rate is 7% higher than Jackson’s even with Jackson’s outlier year and Jackson is actually under that trendline for his career (maybe, because advancedstats has him playing since 2000 for other teams as well), where a guy like Maclin is slightly over
Maclin’s drop rate is also a lot higher, so there’s that.
advancedstats.com do not have drop rate, so where do you see it? I also remember Jackson have shit ton of them in 2011
I agree. It would be interesting to see if Jackson is still that good of an outlier in a different scheme. If its the same in his previous years with Andy then i can accept this notion of Jackson being unique and extremely valuable. If not, than it speaks more about Kelly’s offensive scheme being unique and extremely valuable.
Just like we do with Foles, I think we have to add the huge caveat(s) to Jackson’s 2013 numbers:
1. Kelly’s offense’s first season, which gave some advantages of surprise.
2. The absolutely brutal secondaries the team faced during the season, against which both Jackson and Foles feasted. Against some more average secondaries, late in the season (hence likely the surprise factor fading) both Jackson and Foles came back down to earth.
Jackson’s a very good receiver, but for the same reasons I don’t think Foles can sustain his TD/int ratio, I think Jackson’s 2013 numbers aren’t a true reflection of his impact on the game. I think he’ll regress to around the trend line established through his career, which is still quite good, but not elite.
So what Jackson did against the Bucs or the Cardinals should just be discarded?
Absolutely not. But we should acknowledge that the Eagles played a schedule that was primed to be passed on last season. Like I said, it doesn’t negate what he did – which was elite productivity – but it does caution against assigning those games great weight in predicting future performance. I think my point was fairly close to the point you made in the first post on this thread: Jackson’s 2013 performance is likely an outlier, and he’s going to regress towards his mean in the future (which is still a very good receiver).
First time reader. Loved this post. You have me hooked. Question: was there a difference in Jackson’s production between Vick and Foles? I saw some stats showing that Jackson’s catches, yards and touchdowns dropped fairly significantly once Foles became the quarterback. Does the same hold true for his catch rate and/or EPA? If so, I think an argument can be made that we need to look at an even smaller (and yes, less reliable) subset of this, and focus exclusively on his catch rate, target rate and EPA with Foles as his QB in 2013.
Another interesting stat is that Jackson had the highest QB rating in the league when thrown to. In other words, QBs (Foles, Vick and Barkley) had a QB rating of 124.4 when throwing to Jackson. The next highest was Demaryius Thomas at 122.2, then Boldin at 118.6.
The comments on here and other sites on Jackson’s drop rate re Maclin also need to be kept in perspective. Jackson had a very low drop rate in 2012 and 2013, but he had one of the highest rates (horrible rates) in the league in 2010 and 2011. Maclin has been fairly steady at about the league average.
Brent:
What impact to TDs have on the ratings you’ve presented — beautifully, by the way.
I love the energy and due diligence put into this post, thank you.
As a Redskins fan, I’m concerned of DeSean’s likelihood of regressing to the mean. If you’re at all interested, I’ll offer the follow up question:
“What is the likelihood that WRs who had outlier-esque seasons, in regards to catch rate vs deep pass attempt, regressed to the mean the following season?”
Another commentor hinted at this, looking at his previous seasons which came to an average of 52.3%. I think we can all agree that Eddie Royal will regress to the mean next season, what makes DeSean statistically different?
Pingback: Short term setbacks and My Response to Tommy Lawlor | Eagles Rewind