
Round 1 looked at historical draft performance and persistence based purely on total production as defined by CarAv. Today we’ll make an adjustment to the model and rerun the analysis to see if anything changes.
For reference, Round 1 found absolutely no correlation in team performance from one year to the next.
The adjustment for round 2 is accounting for draft position. Using the default NFL Draft Chart, I assigned a draft points value to every player selected from 1999-2009. I then summed up the total draft points used by each team each year, and divided that number by the total CarAv to arrive at a Points per CarAv value, which I then used to rank teams each year.
This should sound very familiar, as it is similar to the method I used in our first draft performance ranking. However, while that analysis looked at best performance over the whole length of time, this is only concerned with performance each individual year. As such, we don’t have to adjust for the cumulative nature of CarAv, so the rankings are a bit different.
Before we start parsing the results, here is the new ranking:
This one definitely passes the eye test. At the top of the board are Indy, Baltimore, Green Bay, Pittsburgh, and the Giants. Notice anything in common?
Meanwhile, at the bottom of the board are Detroit, Oakland, Cleveland, and Arizona.
So before digging in, it appears to be a reasonable ranking according to what we know of each team’s performance.
The Caveat – Using this system accounts for teams that perennially pick at the end of the draft (or the beginning), that way a team like the Patriots doesn’t get penalized for not finding similar quality players as a team like Cleveland, which, on average, picks much higher in the draft. However, using the NFL Draft Value Chart does have a drawback. The chart is HEAVILY skewed towards the top of the first round. For instance, the #1 pick is worth 3,000 points while the last pick in the draft is worth just 2. The upshot is that using it to adjust for team draft position skews the results in favor of teams who do not have a lot of Draft Points (i.e. good teams that don’t pick high in the draft or teams that don’t have 1st round picks). This is an area that I will try to adjust for in a future analysis.
Luck vs. Skill – Remember that if the draft is mostly skill, there should be positive correlation between team performance one year and the next. How much correlation? That’s up for serious debate. Regardless, here is the chart followed by the correlation value: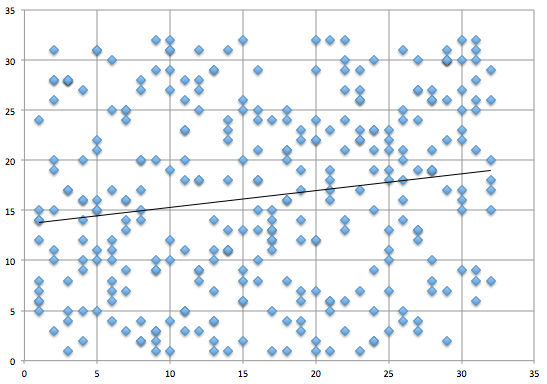
Doesn’t look like much, so I added a trendline to make it clearer. The value is .167. Not huge, but significant, and certainly a different story from the last look, which showed no connection.
If we take a step back, this comes out where I imagined the luck vs. skill argument to be when I started the original analysis. I believe that there is obviously skill involved in the draft, but that luck is far more determinant of team success in this area of the NFL. In general, my theory is that GM skill is illustrated by moving around the draft to maximize value/odds, and not necessarily in selecting players. A lot more to do to support that, but I think this analysis is a step in the right direction.
Other notes from the analysis:
– It should come as no surprise that, according to this analysis, the Eagles 2002 draft remains its best. Overall, the team’s average ranking over the subject time period was 15th.
– The Eagles were one of the most schizophrenic teams when it comes to draft performance, with a more volatile ranking than all but 3 teams (Jets, Miami, and Denver). The Broncos were least consistent.
– By this measure, the Eagles worst draft during the Andy Reid Era was 2003, when the team spent 26.71 draft points per CarAv. For comparison, in 2002 (best draft), the team spent just 6.15 draft points per CarAv. For those who don’t remember, 2003 was the Jerome McDougle, L.J. Smith draft.
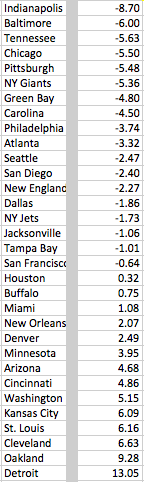
– Over the subject timeframe, the Eagles have spent 3.74 draft points LESS than the league average per CarAV, which ranks 9th best in the league. (Chart below)
– The Colts spent 8.70 LESS draft points per CarAV than league average, while the Lions spent 13.05 points MORE than league average…
– The Detroit Lions have been shockingly inept when it comes to the draft. The teams average ranking is 26th, but for a clearer illustration, here are the Lions 1st round picks from 1999-2009:
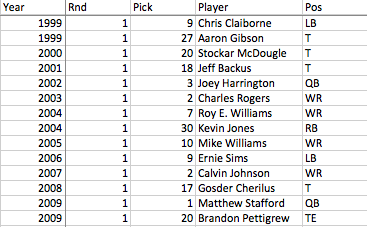
Remember the post on how important it is to hit in the first round? Needless to say, the Lions blew it…repeatedly. To be fair, the team’s most recent #1s look OK (Suh, Fairley)…if you forget about Jahvid Best.
– The Patriots have fallen off dramatically. From 1999-2003 the team’s average ranking was 10.6. From 2004-2009 its average ranking jumped to 19.
– While the above analysis looked at average ranking, here is a chart showing performance over the whole time period, as defined by average draft points per CarAV minus league average. (So average team performance versus league average). Negative numbers = better performance.
There’s a lot more I can do now that I’ve put the information together (which took much longer than I expected). So expect to see a few more points from this analysis.
Overall, the evidence still stands heavily in luck’s corner in its fight with skill for the soul of the NFL Draft, though it’s fair to say skill has landed a couple jabs.

Pingback: Let’s Kick It Again … and a look at Washington’s draft history
Really enjoy analysis along these lines, and I like the metric you created in principle. Might suggest using a different draft value system though as your results look really highly correlated with early picks. I wonder what the percentage of “successful” top ten picks is compared to the percentage for picks 23-32.