
I’ve spent a lot of time over the past few months examining just what went wrong last year. I’ve come to the conclusion that while the team was certainly not very good, it was also the victim of bad luck. It is unfortunate then, that Andy Reid lost his job here at least partially as the result of circumstances which, in general, are extremely unlikely to occur.
However, it would be incomplete to say that Reid was fired purely as a result of last year’s 4 win season. The larger issue is that the 2012 performance followed a season that saw the team win just 8 games. These consecutive sub-par performances, together with the lack of playoff wins, ultimately led Lurie to go in a different direction.
Therefore, when discussing the end of the Andy Reid Era we must also look at the 2011 season.
Why did the team win just 8 games? Was that a result of bad luck or was it close to the “true win value” of the team?
As you can probably guess, I’ve found some interesting statistical tidbits that I hadn’t picked up on before.
Let’s start with Point Differential. As we know, Point Differential is the best determination of “true win value”. For obvious reason, Points Scored – Points Against correlates extremely well with Wins (.91 value).
In 2011, the Eagles’ Point Differential was +68. Let’s look at that in a chart with every other team from the past 10 years. 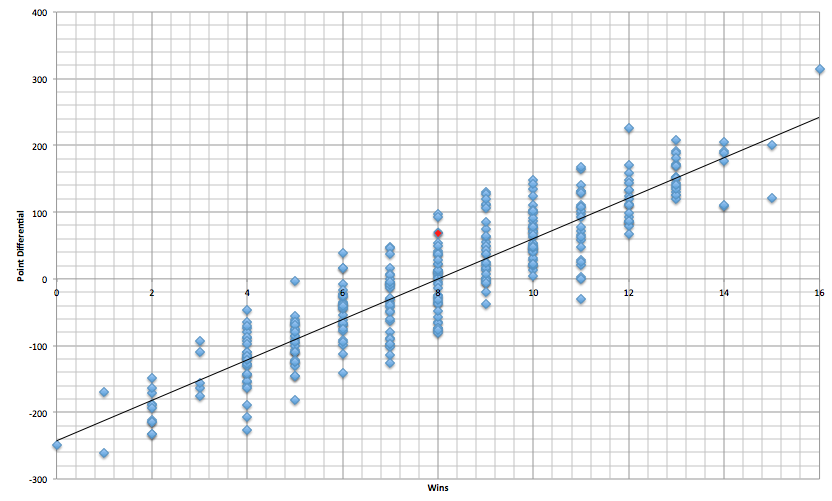
Above, we see Point Differential on the Y-axis and Wins on the X-axis. The black line illustrates the expected win total for each Point Differential. I’ve highlighted the 2011 Eagles in red.
While the 2011 Eagles are clearly not an outlier, the chart shows that typically, a +68 point team would be expected to win 10 games (which would have put the team in the playoffs). Instead, the Eagles won just 8 games, setting the team up for a true make-or-break season (in which it broke, to put it lightly).
Now let’s look at Sack Differential
Intrigued, I looked at a few more stats from the 2011 season and found another relatively surprising measure. The Eagles registered a Sack Differential of +18. As I explained before, Sack Differential (Sacks – Sacks Against) is strongly correlated with winning (.61 value).
Here is the chart: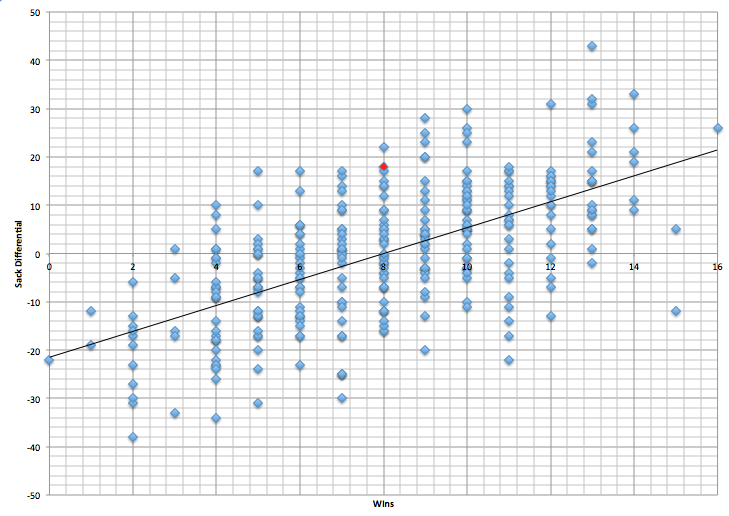
As you can see, the Eagles are again featured well above the “expected win” line. In fact, over the past 10 years, NO TEAM has registered a sack differential of greater than +18 and won FEWER than 8 games. Just 1 team won 8 games with a greater sack differential (’06 Green Bay).
Now, of course, Sack Differential and Point Differential are connected. These are not completely independent variables, so it is not that big of a surprise that the Eagles underperformed their “expected win value” in both charts.
Still, it’s interesting that in both charts, the Eagles are close the edge of each distribution range.
So what went wrong?
As you can probably guess, it was the Turnovers. I should note that I haven’t gone through each game of the 2011 season and highlighted where each loss came from. This is purely a 10,000 foot statistical view of the whole season. The Eagles registered a TO differential of -14. TO Differential is also highly correlated with Wins, with a slightly higher value of .64.
Here is the chart: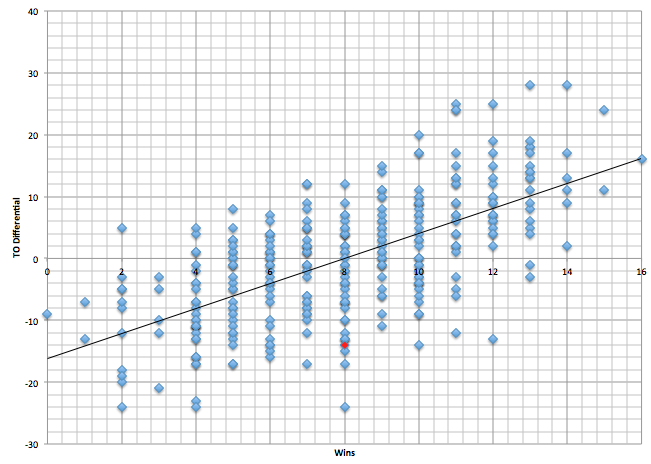
Here is where the team gave back the advantage it gained in the perviously examined statistics. Using just this statistic, we would expect a -14 TO Differential to equate to a roughly 1 win team.
Similarly to this past season, the Eagles just turned the ball over too often.
From 2003-2010, the Eagles average TO Differential was +8. They followed up that era of strong performance with consecutive years of -14 and -24. Whereas last year the culprit was fumbles (lost 22 of them), in 2011 it was interceptions (threw 25 of them).
Just for fun, here is a chart of the Eagles performance from 2003-2012, with Wins and TO Differential illustrated. The left Y-axis is Wins (Blue), the right is TO Differential (Red).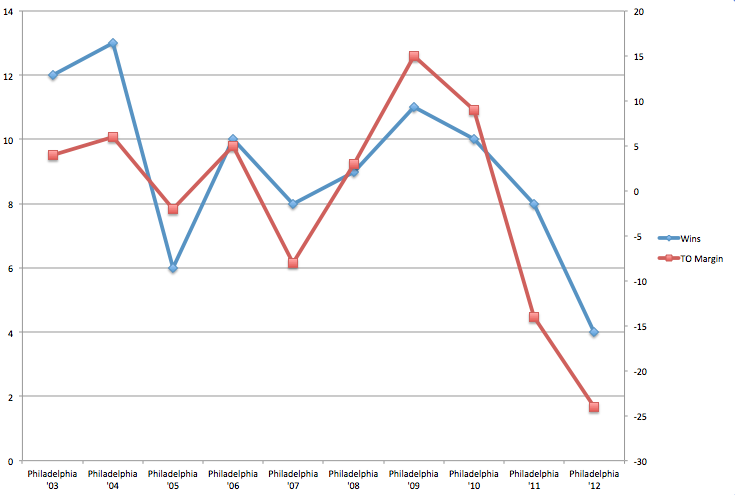
It should also be noted that 2010-2012 was the “Michael Vick Era”, though obviously Nick Foles has some responsibility for last year as well. For all his faults, Donovan McNabb was EXCELLENT at taking care of the football. The guy just did not throw interceptions (look at his rate, not totals).
While Vick put it all together in 2010, it’s possible that he just significantly outperformed his long-term skill level.
For all of Andy Reid’s reported “QB Expertise”, it looks as though a big part of his downfall was not finding another starter after McNabb declined.

That last chart, where the turnovers correlate to wins/losses, is pretty awesome. I knew TOs would be a strong predictor of success, but that strong a correlation surprises me. I assume this same correlation holds up with other teams’ seasons.
Pretty much, overall correlation is strong. Im sure some teams deviate a bit more than the Eagles did, but regardless, taking care of the football is as important as people say it is.
(Note that doesn’t bode well for Vick)
On Tue, May 7, 2013 at 2:21 PM, Eagles Rewind