
Today we look at the defense. Here are the best defenses since the 2000 season, adjusted for league average scoring. Yellow teams are Super Bowl Winners, Red are Losers, and I’ve highlighted the Eagles in Green.

Whoa…a lot more yellow than the offensive table. Also, we can clearly see the Andy Reid Peak here. While McNabb was the face of the franchise, the defense is what really carried the best Reid teams.
Again, this isn’t much different from our pervious look (which didn’t adjust for points inflation). However, it seems pretty clear from that table that a GREAT defense can go a very long way towards winning a Super Bowl.
Notice also that the 2002 Bucs are at the very top of the list. I’ve said before that the 2002 Eagles were the best of all the Andy Reid teams. Unfortunately, it ran into a historically great defense that year. Is it possible that single game led to a Reid overreaction and strategic shift away from the defensive focus that led to so much success? Yes, yes it is.
After that game, everyone talked about how inept the Eagles offense was. Meanwhile, it’s quite possible (likely?) that the Bucs that year would have shut down ANY offense. They were that good. However, I’ve talked about that before. Back to today’s topic…
Similar to yesterday’s table, here are the past ten Super Bowl winners and their defensive performances:

For reference, here is the offensive chart for Super Bowl winners:
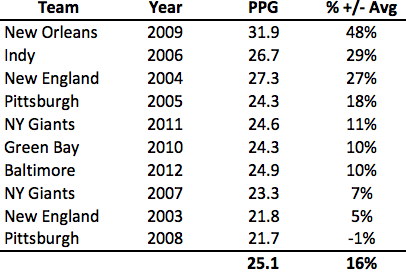
The performance of teams in both areas is strong (as it should be), but it’s clear the bar for defensive performance is significantly lower. Not only do we have 3 teams that Won a title with a below-average defense, we have 2 teams that won with a significantly below average defense.
Also interesting to note is the fact that the only Super Bowl winner with a negative offensive performance (the 2008 Steelers) had a historically great defense (37% better than league average).
What about the Super Bowl losers?

Strong performances again. In fact, the average performance of the losing teams is better than the average for the winning teams. However, we also see that, while defense is clearly important, it is not necessarily mandatory. The Arizona Cardinals of 2008 were 21% below league average on defense and still managed to come within a Santonio Holmes tip-toe of winning the Super Bowl.
Lastly, here is a chart of the past 10 Super Bowl Winners showing their defensive and offensive performance.
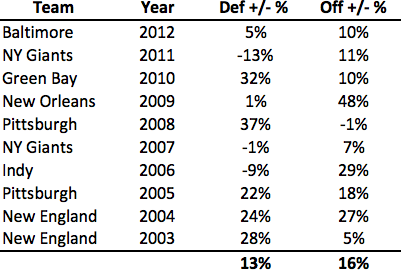
At first glance, it doesn’t look like a huge difference, though average offensive performance is better by 3%. However, if we look at the minimums on both sides, we get a clearer picture.
After all that, our original thesis stands:
– An average offense (or something extremely close to it) is required to win the Super Bowl.
– An average Defense, while certainly helpful, is NOT required.
THEREFORE
Teams should focus on the offensive side of the ball until they’ve met the average threshold, and then turn towards maximizing defensive performance.
P.S. The table above also makes it extremely clear that the Giants teams that won in 2007 and 2011 are, BY FAR, the weakest winning teams of the last decade. I’m not sure if that makes me feel better or worse, but it supports my assertion that those teams were largely lucky, and not good (not that it matters).

With the recent success of teams like the ’12 Ravens, ’08 Cardinals, and ’07 Giants seemingly being non-dominant teams that went on playoff hot streaks, it would be interesting to compare their overall regular season PPG #’s with their playoff #’s. This may lead to sample size issues, but with the growing notion that all it takes to contend for a Superbowl title is to “just get into the playoffs”, it would be interesting to compare how different their numbers may look in the postseason.
One of the Pittsburg teams was a 6th seed as well. I’m not sure if it was 05 or 08
Yeah, it was their 2005 team. They blew out Carson Palmer’s knee in the first round to beat Cincinnati, upset a truly dominant Indianapolis team in the second round, won at Denver in the AFC championship, then beat Seattle in a contentiously-officiated Super Bowl.
Very interesting point about the 2002 Eagles, and the strategic realignment that occurred following the NFC Championship defeat, and how the emphasis was removed from the segment that was most responsible for the team’s success. Not sure if I totally agree though.
In 2002-03 offseason, the Eagles traded up to draft a DE (McDougal) and didn’t add anyone significant offensively in free agency. I think it was after the 2003 NFC Championship failure against Carolina that the whinging about the offense really escalated. It was in *that* offseason that the Eagles signed TO, drafted Shawn Andrews, and started to give Marty more power within the offense.
Good point about the 2003 NFC title game, that was definitely when the “need a receiver” message hit a fever pitch. In reality, it’s a combination of both. The 2003 title game certainly reinforced the message from 2002.
In hindsight, it looks like there was a big difference between the 2002 and 2003 playoff losses. The 2002 team went down to an all-time great defense. The 2003 team looks like it just played a bad game (which doesn’t make for much of a story but happens all the time). The offense in 2003 was +13%, not amazing but clearly good enough given what we’ve seen in the tables I posted.
Unfortunately, since both losses look similar on the surface, it might have prompted the team to overreact after the 2003 game when staying the course might have been the right decision.
On Tue, Jun 11, 2013 at 3:40 PM, Eagles Rewind
How about a scatter chart with offensive performance on one axis, defensive on the other, and dots for superbowl winners and losers highlighted in yellow and red? I don’t know if it would be instructive or just a mess, but I’d be really interested in how it looks.
Thanks for all the interesting work.
Great idea. Up immediately.
I’m a bit late to the party but it looks like there’s something wrong in the Super Bowl Losers chart. The 2001 Rams are listed first at a record 56% defensive performance despite giving up 31.4 ppg.
Great work again though and really interesting stuff. Still the first chart still backs up the overused statement “Defense wins championships” as the top defenses were 5-1 while the top offenses were only 1-4 over the same span. Seen as a whole though I agree with you that offense is the true key to success nowadays.
Good catch. As usual, its a transcription error. Those St. Louis stats are for the teams OFFENSE, whereas it should have been defense.
For the record, the 2001 Rams allowed 17.1 PPG, which was 16% better than league average. I’ll update the chart to reflect that. Thanks