
This is perhaps only indirectly related to the strategic post I’ve been looking to expand upon, but it’s important nonetheless, and, in my mind, more immediately relevant. The topic, as the title suggest, is Expected Points, the concept developed by Brian Burke at AdvancedNFLStats.com.
I’ll spare you the full explanation because I think most readers here are aware of it, but basically it assigns a point value to each down/distance combination to provide a measure of how valuable each situation is. For example, 1st and 10 at the 50 yard line is worth MORE than 1st and 10 at a team’s own 20 yard line. Simple enough. However, many people (myself included) have been a bit to cavalier in using the Expected Points concept to evaluate in-game strategy.
Today, I want to clear that up. There is a major limitation to the Expected Points concept; that is, it’s an AVERAGE, and it doesn’t account for the relative strengths and weaknesses of each team. Logically, a certain field position is worth more to the Broncos than it is to the Buccaneers, right? Similarly, a particular field position is worth LESS against the Chiefs defense than it is against the Eagles. Unfortunately, that’s not accounted for, limiting the usefulness of the Expected Points analysis.
I’m not saying it’s worthless, far from it in fact; I’m just saying that we need to remember that the EP analysis for a given situation reflects average teams, and therefore must be adjusted when applying it to real-world situations.
Allow me to demonstrate (as you knew I would).
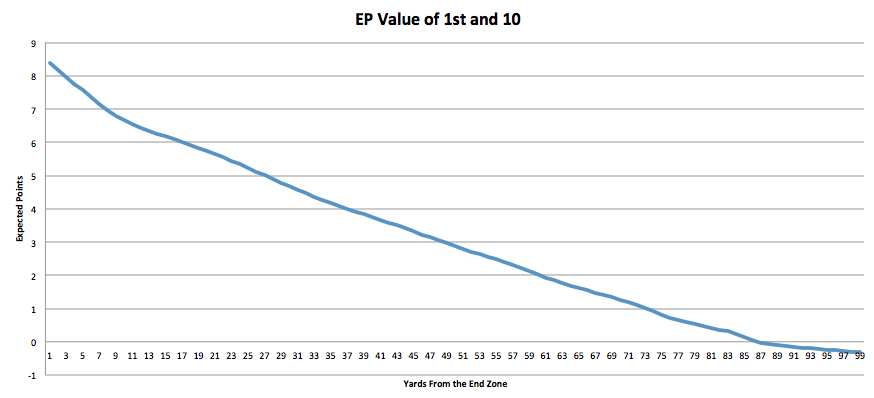
Here is the chart of EP value for 1st downs.

The problem, as I mentioned above, is adjusting for relative strength. To explain, we need to pick 2 teams. For the sake of clarity, and consistency, we’ll use Denver and Jacksonville (FO’s best and worst teams by DVOA).
Let’s just look at Denver’s offense. To adjust, we need to know how the Broncos offense compares to average. Luckily enough, Football Outsiders provides us with a measure of just that. Note that, for now, I’m knowingly glossing over the fact that FO’s DVOA might not be the best measure here.
Anyway, Denver, according to FO, ranks 40.9% better than league average. Well that makes things easy, right? All we have to do is increase the average EP value of each yard line and re-graph. Well here’s that graph:
I’m guessing you all see the problem, but if not, hang in there, I’ll get to that in a second. We ALSO have to account for Jacksonville’s relative strength/weakness on defense. Just as I did above, I can just use FO’s rating (17.9%) to adjust again, right?
Well here it is:

Perfect….now we have the adjusted EP value for the Broncos versus the Jaguars. We can do the same calculations as before, using these values, to determine the “optimal” play-call (where optimal means maximizing expected points).
Only…there’s still that problem I mentioned above, which by now EVERYONE has noticed. Looking at the graph above, it’s pretty clear that we’ve made a mistake in our analysis. Touchdowns are only worth 6 points, which means no field position can be worth more than that (violated above). Moreover, since, regardless of relative strength, scoring a TD can never be 100% assured, we shouldn’t even see a value of 6 anywhere on the chart.
Basically, as the mismatch becomes more and more favorable to the offense, the line should approach a limit of 6, but never reach it. Unfortunately for us, that complicates our plans. How do we account for this?
I’m not sure, but I do have one potential out.
We can ignore everything I did above (ugh) and go back to using the average values for EP. Rather than accounting for the relative strength here, we can instead adjust the expected success rates to account for relative strength. That raises it’s own issues, but it seems to be more intuitive.
HOWEVER, that only addresses the problem when we’re using a combination of EP and Success Rates to game out the Optimal Value of a certain situation. It does not address the issue when we are only using EP (which is how many analysts are using it.)
That brings me back to the main point: be careful when using Expected Points to justify in-game strategic decisions. It can be done (and EP remains the best model for quantifying such situations), but you have to remember that the actual results will be distorted by the relative strength of the teams.
If that reminds you of this E = R ((60 – T) / 60) + C then I’ve done my job. I apologize for the slap-dash way I’m addressing the overall concept, but it is what it is…I don’t have the luxury of taking the time to plan these things in advance.
I’ll try to return to this soon, hopefully using a real situation from Sunday to game out the options using our adjusted success rates.
Next up, though, we need to talk about Bayes and reconciling New Information (what happens during the game) with what we already “knew” (R before the game starts).
Eventually, I do believe it will be possible to create an algorithm that essentially tells you what the “optimal” decision is in every Go/Kick/Punt situation. We’re kind of there already, on an average basis. The key, of course, is to adjust for the teams involved in order to allow actually reliance and use (not that NFL coaches would ever admit that a computer can make better decisions than they can). At the very least, it’ll provide a valuable guide with which to grade coaches.
This should probably be a permanent end note, but all comments are encouraged. As I said, I’m trying to develop a useful model here, so suggestions are always welcome.
