
Anyone who has looked at the 4th down strategy chart above knows that going for it on 4th and 1 (trying to convert) is ALMOST ALWAYS the optimal play. While the multi-part series of posts (Part 1 can be found here) that culminated in that chart explained the thinking behind it, it occurred to me that we didn’t actually lay out the numbers.
So here is the theory, using the concept of expected points, of why it’s usually best to go for it on 4th and 1, from nearly ANY spot on the field. Remember that when I use expected points, I’m piggybacking off the work done by Brian Burke at AdvancedNFLStats.com (expected points).
The overall thesis is: Possession in an NFL game is EXTREMELY valuable, and NFL coaches voluntarily surrender it far too often. With just 1 yard to gain, the odds are heavily in the offense’s favor of gaining a first down and keeping the ball. Despite this, “common” strategy calls for giving the ball away in these cases. This is wrong.
Basically, we are combining what we know about the probabilities of converting 4th and 1 with the expected point values of each yard line. By doing so, we can come up with the actual expected point trade-off for each punt/go-for-it decision. Put more simply, just how valuable is “field position” gained by punting on 4th and 1?
Before I get to the good stuff, I want to make one caveat very clear. I’m using NFL averages to compute the following values. Obviously, most teams deviate from the league average to some degree. However, if I can show that all NFL teams, in aggregate, should be more “aggressive” on 4th and 1, then it’s a fairly small step to then apply it to the Eagles specifically. I just have to acknowledge that there is, in fact, another step there.
First, we need an expected success rate. Using this site, which I cited for our 3rd down play-selection/game-theory discussion, we can see that over the past 10 years, all 4th and 1 plays have been successful 66.5% of the time. Below is the output. The 66.5% is simply the weighted average success rate.
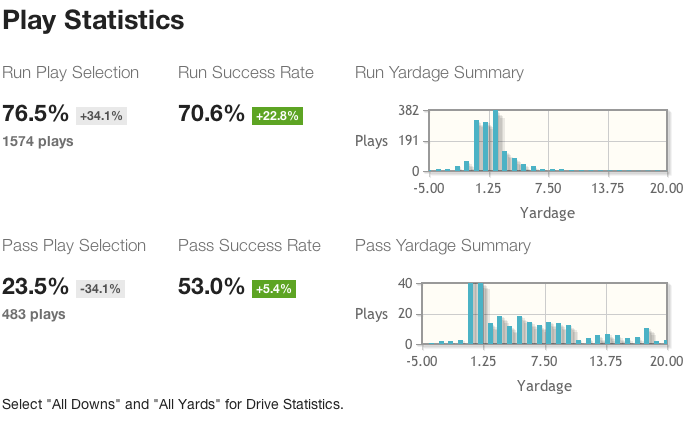
Second, we need to know just how much field position can be expected to be gained by a punt. Using ESPN’s stats, we can see that last year, the median NET punting average was approximately 41 yards (between 41 and 42).
So we have our building blocks:
– Teams are successful at converting 4th and 1 yard 66.5% of the time.
– By choosing to punt, teams can be “expected” to gain approximately 41 yards of field position.
Now let’s look at expected points and put those two things in context. Here is a graph showing the expected value of a first down at each yard line.
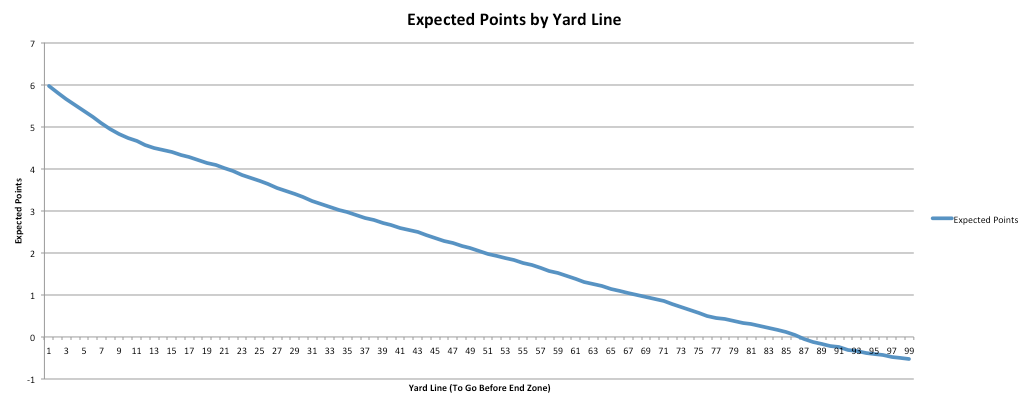
Unsurprisingly, the expected value of a first down increases towards 6 points as you get closer to the goal line. By itself, though, this chart isn’t overly helpful. However, we can use this chart to gauge the value of an average punt in each spot.
Let’s look at the scenario of a 4th and 1 at the offense’s own 9 yard line (the worst possible field position at which this can occur). Simplifying things, there are 3 potential outcomes.
– Punting, which we will assume results in the opposing team taking possession at the 50 yard line (41 yard kick).
– Going for it and converting. Here, to keep things easy, we’ll assume the offense gains just 1 yard, the minimum needed to gain a 1st down.
– Going for it and failing, the result of which gives the opposing team the ball at the 9 yard line.
Applying the success rate and expected points we saw above, we come to the following values for each scenario:
– Punting is worth -2.04 points, which is the expected value of a 1st down at the 50 yard line (for the other team, hence the negative).
– Going for it and gaining 1 yard is worth -0.21 points, which is the value of a 1st down at the 10 yard line. However, this only has a 66.5% chance of happening, which we’ll adjust for in a moment.
– Going for it and failing is worth -4.83 points, which is the value of a 1st down for the OTHER team at the 9 yard line.
Using the 66.5%/33.5% success odds, we can calculate the expected value of going for it, that is the expected value WITHOUT KNOWING if you will succeed or fail.
Converting: -0.21 * .665 = -0.14
Failing: -4.83 * .335 = -1.62
Combined: -1.62 + -0.14 = -1.76
See why that’s a big deal?
Given a 4th and 1 at your own 9 yard line, an average punt is “worth” -2.04 points, while going for it (with average success) is “worth” -1.76.
Going for it is worth 0.28 points MORE than punting.
Hopefully one example was enough, so rather than continue, I’m just going to give you a chart. Here is the expected value of both punting and going for it at each yard line (between the 9 and 50), assuming a 41 yard punt, a 1 yard gain if converting, and league average success rate when going for it.

So there you have it. As you can see, going for it is more valuable than punting regardless of field position. As I said at the top, with just 1 yard to gain, the odds heavily favor the offense, yet they don’t seem interested in taking advantage of it.
Giving up possession of the football, regardless of whether it’s the result of a TO or punt, is bad. It looks like teams are underrating the degree to which punting the football is a negative play. They also seem to be under-appreciating the odds of converting in 4th and 1 situations. As a result, “common” NFL strategy is far from optimal, leaving an opportunity for a forward thinking team to gain a significant advantage over the rest of the league.
Obviously each of these assumptions needs to be tweaked for individual teams. However, if the league, overall, should be going for it a lot more often in 4th and 1, then by definition, many teams should going for it more often. Here are some quick adjustments that result in “going for it” more often, with the reciprocals being adjustments that should result in punting more often:
Bad Punter – Go for it more often (lower net punting average)
Good Offense – Go for it more often (higher expected value of a first down)
Bad Defense – Go for it more often (value of OPPOSING team’s possession after a kick is higher)
Someday, we’ll see a team take advantage. I think Chip Kelly will be more aggressive than average (closer to optimal), but far from as “aggressive” as he should be. Hopefully, after developing a successful track record and some credibility, he’ll have the stones to implement strategy like this more fully.

Coach will no go for it enough simply because of the backlash for going for it and failing despite the odds of success. This is even more pronounced when we take into account the relatively few amount of 4 and 1 we see each game.
So a coach could make the right decision all the time, but because of bad luck, would end up costing his team a few wins and that could be the difference between him been fired or him staying.
Agree completely, just showing that someday an owner/FO will realize this and give the coach the required cover to make the right decisions.
THe problem, as you stated, is that over the longterm is almost guaranteed to work, but over the short term, there’s exposure. That’s an externality though.
Imagine playing poker can catching a few bad beats in a row. It happens, but it’s not going to change your strategy. By letting commentators/analysts/public opinion sway the decisions they’re making, coaches are actually making it harder for them to be successful on the field.
Seriously compelling analysis. Still, I have to think that time and score have to be included in the calculus. For example, it seems that a coach who decides to go for it on 4th and 1 from his own 9 with a 5-point lead and less than a minute to go is making a mistake.
Absolutely. Time and score ultimately dictates the decision. With less time on the clock, the expected value of each yard-line probably drops, meaning its no longer advantageous to go for it.
Every strategy needs a sanity check. I’m not saying teams should necessarily go for it in the situation you described, only that, in general, going for SHOULD be much more common. End of game situations are another matter altogether (as is the usual caveat with the “new” strategies I’ve proposed)
Although I believe this is accounted for by the recentness of your data, the higher-scoring nature of today’s NFL makes this strategy even more optimal. Much of the strategic convention that continues to shackle NFL coaches is rooted in the defensive, “points-at-a-premium” NFL of the 1960s. Nowadays, there isn’t as much of a difference with handing Drew Brees or Aaron Rodgers the ball at your 10-yard-line, or at midfield. Defensive penalties (which usually result in an automatic first down) and the ease with which above average modern quarterbacks can move the ball has changed the calculus. Plus, a pass that burns the secondary to a speedy receiver will score from anywhere on the field anyway, field position be damned. Moreover, the evolution of greater range and accuracy in modern NFL kickers lessens the value of punting even further. They will make it from the 32-yard-line almost as routinely as they will from the 5-yard-line.
Very good point. I dont have the data, but we can assume that the “expected value” of each yard line is now higher than it has been in the past. I have to go back and look at Burke’s work again, but it wouldnt surprise me if those values should be adjusted upwards. If that happens, as you said, going for it is even more advantageous (because of the 66/33 split in success probability)
On Tue, Aug 13, 2013 at 1:32 PM, Eagles Rewind
Math nerd here… we can take your formulas used above to calculate the success rate at which a punt is just as valuable as a punt:
-.21x + (-4.83*(1-x)) > -2.04
x > 0.60389
Essentially going for it on fourth down is more valuable to a team as long as they convert at least 60.4% of the time. I would be interested to see what the Eagles success rate has been over the last decade to compare to this 60.4%. Obviously this won’t tell us anything going forward with a new coach, but we could see if the strategy would have been beneficial for Andy Reid over his time here.
Great work. The next step to this type of analysis is definitely finding the breakeven points, which you’ve just done for this scenario.
For the Eagles, with Shady and a hopefully healthy Jason Peters, the success rate should be significantly higher than 60%…
Ill take a look at Andy Reid-specific data, but from what I’ve seen, very few coaches actually deviate from the league average to a significant degree (all the more reason for someone to do it).
I love the analytics, but I think it misses in 1 way. Can you rerun the numbers using the net punt medians for punts taken at every yard line? My hunch is that punt medians change somewhat significantly when you are on your 1 versus your 30. There’s going to be some missing data (ie 0-20 yards from your opponents goaline), but who cares? We want to know whether the averages tell us to punt 0-20 yards from our own goal line!
I assume what you’re getting it is that the expected length of a punt changes by field position. Its certainly possible. Unfortunately my data isn’t that granular, so for instance, I can’t filter for only punts kicked from between the 10 and 20 yard line.
However, what we can do is look at what the breakeven value is from the 9 yard line. In other words, how far does a team have to kick it (how much field position gained) in order to beat the expected value of going for it. From the 9 yard line, we’re looking for an expected value of 1.76. That comes in around the opposing 45 yard line (1.77).
That means, for a team to kick it from the 9 yard line, assuming average success rates, it would have to EXPECT a NET punt of at least 46 yards. That’s a tall order, considering the HIGHEST average in the league last year was just 44.8.
Now those league averages might be skewed (i.e. maybe you can expect a longer punt from the 9 yard line), but I don’t have that data. Consequently, it’s easiest just to ask yourself, how sure are you of a 46 yard net gain on the punt? Obviously, then it becomes a matter of opinion (at least until the data is available).
Fatal flaw in your logic:
If teams go for it 100%, conversion rate will drop. Did you not consider this?
I did consider that, but Im not sure it’s as certain as you believe it to be. Why would the success rates drop? It’s not as if teams are capitalizing on surprise here. Fake punts are extremely rare. 66% success sounds very reasonable to me. Remember we are only talking about 1 yard here. It’s incredibly difficult to stop someone from advancing just 3 feet, especially when he’s going all out for it (i.e. can just dive if he gets an opening).
It’s an interesting point to consider, but until teams start attempting more conversions, we won’t know, though our ten year sample is very large.
It’s 66% conversion rate because teams go for it when they have the advantage. If they all go for it, conversion rate will almost certainly drop enough to make your numbers not work.
I agree teams don’t go for it nearly enough, but no way should it be anywhere near 100%, especially from your own 9.
Interesting stuff!
One thing I don’t believe is taken into account (could be wrong) is that the instances of coaches going for it on 4th and one are not random. Surely they’ve already considered the strength of their offense vs. the opponent’s defense, strength of their kicking game/kicking games, etc.
So, my guess is that the data is comprised almost exclusively of instances where the coach felt the circumstances were advantageous to going for it.
Definitely a potential source of skew, though I looked through the #’s for different teams and didn’t see a huge shift. Needs more work though before I can rule that out.
Pingback: 4th and 1; Gaming out Chip Kelly’s first big decision | Eagles Rewind
you only site 4th and 1, yet going for it on 4th down comes with a litany of yardage needed. I think the correct analysis for Kelly changing the game would be 4th and 1 vs. average gain on a regular play (run and pass). This would be slightly less than average when you factor in the defense advantage to be able to narrow offensive play selection and the fact the stress factor has gone up on the offense and causes more mistakes. Of course on 4th and 1 the odds favor certain offenses.