Salary Cap and Roster Cuts

UPDATE:  I mentioned that GCobb had made a ridiculous assertion about Evan Mathis.  Turns out it was actually Denny Basens, who writes at GCobb.com, so adjust my previous point accordingly.

Focus has shifted to the roster and the salary cap, with everyone putting out a stay/go list and predicting who is going to stay.  Here is my take on it.  Sorry in advance for the lack of data.

First, everyone needs to understand that this is NOT a team that is one offseason away from seriously contending for a Super Bowl.  If everything goes right, the Eagles could certainly make the playoffs, but right now that’s the high-end of where the team can expect to be.

Understanding that, the team needs to be very careful with its salary cap space.  Right now, it’s more important to find the right pieces at GOOD VALUES then it is to pay up in free agency looking for impact players to help immediately turn the team around.

Free agency is essentially an auction, with all 32 teams valuing each player (obviously not all teams go after every player).  However, by definition, signing a FA means you are overpaying, in that you are valuing the player more highly than the rest of the market (winner’s curse).  It’s a dangerous game to play, as Eagles fans will know from recent “dream team” experience.  I believe the Eagles’ focus will (should) be on finding depth in free agency, with specific attention paid to “character” guys who will help Chip Kelly install his own atmosphere (Dennis Dixon seems like a prime example if he signs).

So don’t be disappointed if there are no huge player signings.  Conversely, if there is a big signing, remember it doesn’t always work out the way it seems (Nnamdi anyone?).  I’ll be much more excited with 4 or 5 low-profile “solid” signings than with 1 “big-time” addition.

In the meantime, who stays/goes?

I’ve had a lot of fun reading some articles that suggest nearly the entire defense will be released.  While few of them deserve to start, the fact is you still need to field a team, making it very difficult to cut EVERYONE.

Here is GCobb‘s.  Which is notable because he makes a ridiculous claim that Evan Mathis should go.  He believes that any player that doesn’t “dominate” should be replaced.  Ignoring the fact that Mathis was among the best guards in football this year (for those that actually watch the game), it’s outrageous to believe that any team subject to a salary cap could actually “dominate” at every position, especially at a relatively low-impact one like OG.  Needless to say, I won’t be taking anything GCobb Denny Basens at GCobb.com says seriously ever again, and I encourage all readers to do the same.

Before I go player-by-player, let me say something important when it comes to player evaluation.  As I just mentioned, you can’t expect EVERY player to be great.  The fact is, on a lot of good teams there are bad starters.  However, the overall talent allows the coaches to hide the weaknesses of these players.  The Eagles were so bad this season that there was no cover for anybody.  For example, on a good team, you might be able to sneak Akeem Jordan in there as a starter and compensate with a great MLB and strong D-Line.  So some of the players everyone is sick of may in fact be able to make contributions as role players once the rest of the roster gets upgraded.

Finally, here is my opinion on a selection of potential roster changes:

– Bell (already gone, but he was obvious)

– Nnamdi, an easy cut.  Rather than dissect what went wrong, I’d rather all Eagles writers/fans just agree never to speak of this signing again.

– Vick, yet another easy one.  For those still thinking he might be on the team, please remember that HE IS NOT A GOOD QUARTERBACK and now he’s old with an extensive history of injuries.  Not happening.

– Jenkins.  Ideally Jenkins would be plugged in as a 3-4 end in the new system, and I’d be happy if that happened, but all current accounts say he has an attitude problem and will complicate the coaching transition.  Normally I discount such things, but with a new coaching regime, it’s perhaps the only chance to complete a wholesale atmospheric change of the team.  If Jenkins isn’t a good soldier, he’s gone without a second thought.

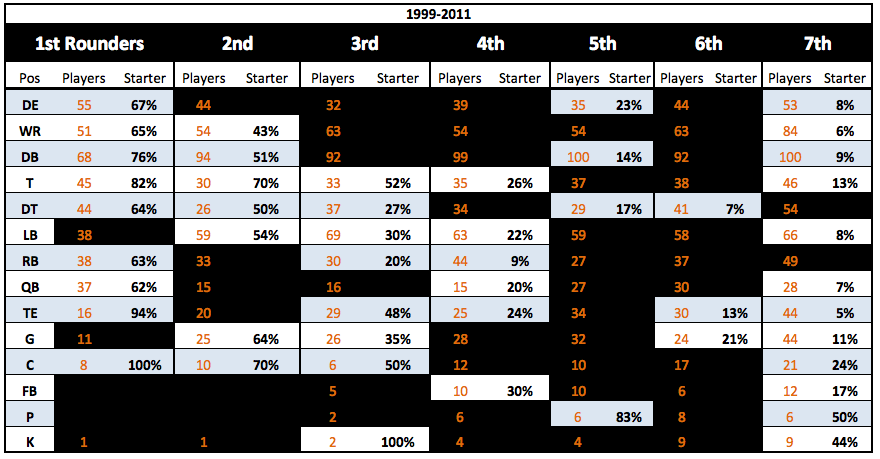
– Peters stays, provided his rehab is on schedule.  This is becoming a popular suggestion for a potential cut, since his cap hit is around $11 million.  However, with the above cuts, the Eagles will have plenty of cap space.  Also, a healthy Peters (even if he comes back at 80% of what he was) is a BIG help to the offense.  While he clearly isn’t a long-term solution, it gives the Eagles an OT bridge until they can get a younger starter in there.  For example, keeping Peters would allow the team to draft Lotulelei and worry about OT either later in the draft (where I’ve shown they can find a starter) or next year.

– Demeco stays.  He is overpaid ($6.7 mil hit I think), but he is definitely a “character” guy and another veteran the Eagles can count on for one more year while they fill other roster holes.

– Trent Cole.  This is definitely the highest potential for “surprise cut”.  His contract makes that difficult, but judged purely on his play, Cole’s not going to win many fans among the new coaches.  Can he transition to a rush-linebacker?  Maybe, but I think Graham is better suited to that role.  Cole might end up staying, but probably gets shifted to a situational player rather than an every-down lineman (a near-lock if the team goes 100% to the 3-4).

– Invisible Man, Akeem Jordan, Casey Matthews.  Pick two of them to get rid of, doesn’t really matter which ones, though Jordan occasionally contributed on special teams in the past.  Only reason you keep one is so you don’t have so many holes to fill.  Matthews may get the nod because of his Oregon ties.

– DRC.  Anyone suggesting DRC should go is out of their mind.  He is inconsistent and will command a big salary, but the Eagles need to keep him (franchise tag if necessary).  It’s hard enough to replace one starting corner (and both safeties), but replacing the entire defensive backfield is a recipe for disaster.  Also, DRC is one of only a few guys in the league that can actually check some of the big superstar receivers in the league.  If I’m going against a Megatron or Brandon Marshall-type, I want DRC on my team.

– Colt Anderson.  This is a surprisingly tough decision, but I say he stays on one condition: He never steps foot on the field as a defensive player.  As a special-teamer and a locker-room guy, I love Colt.  However, he’s shown he clearly doesn’t have the ability to play on defense.  Some teams keep a roster spot for a “special teams ace”.  If Kelly decides to, then Colt stays.  Otherwise, goodbye Colt.

– Nate Allen, Kurt Coleman.  Love to see both of them go, but this will be a case of what’s available.  Most likely scenario is the Eagles sign a safety and draft one, then let everyone battle it out and pick the least-terrible option.  It’s just not easy to go out and find a starting-quality safety now that the NFL is so pass-happy.  I will say that I’d be OK with Allen as a back-up for a year, while I think Kurt Coleman’s weaknesses have been so clearly exposed that he shouldn’t be on the field.

One final point – I cannot overemphasize how important the #4 pick in the draft is, and not just because it needs to be an All-Pro.  Shifting to the 3-4 seems like a foregone conclusion, but the Eagles do NOT have anyone on the roster that can play NT.  That means if the team does not draft Lotulelei, it needs to either sign a FA (only real fit is Kemoeatu of the Ravens, and he’s 34 years old) or hope one of the other NT prospects falls to the 2nd round, which is unlikely.  If the team cannot find a NT, I have no idea what it will do, but odds are it won’t be pretty.

Ozzie Newsome vs. Andy Reid (Drafting)

Lots of Ozzie Newsome plaudits going around, and justifiably so.  Since he is widely considered the best personnel man in the league, I thought it’d be fun to compare his drafts side-by-side with Andy Reid’s over his tenure with the Eagles.

Here is a breakdown of Ravens and Eagles draft choices since 1999.

Let’s start with the big one, the first round.  AP1 means All-Pro, PB means Pro Bowl, and St means seasons as a starter.  We covered CarAV before (its the pro-football-reference measure of production).  Please note that CarAv is not calculated for K/P, that’s why they each have a zero.

Looking over all of it, the big difference is in this round, which readers of this blog will realize is by far the most important.  Outside of McNabb, Reid just wasn’t able to produce impact players like Ngata, Suggs, Lewis, McAlister.  It isn’t enough to get decent players like Patterson in the 1st round.  Additionally, the aforementioned Ravens overshadow Newsome’s big mistakes with Boller, Clayton, Taylor.

Screen Shot 2013-02-06 at 1.04.17 PM

Contrast that to the 2nd round.  Suddenly Ozzie doesn’t look like a genius.  In fact, it’s a pretty clear advantage to the Eagles (not to say the Eagles haven’t missed a bunch of these picks.)  However, as we’ve seen, the 1st round is significantly more important than the rest of the draft combined.  So mistakes in the 2nd round aren’t nearly as punitive.

Screen Shot 2013-02-06 at 1.16.15 PM

The third round tilts in the Eagles favor, especially since B-West was drafted here.  Meanwhile,the Ravens’ 3rd round history is relatively undistinguished.

Screen Shot 2013-02-06 at 1.16.25 PM

Lots of misses in the 4th round for the Eagles, though they had more draft choices than the Ravens.  Notice this is where the Ravens grabbed players who could contribute significantly at relatively unimportant positions (FB, P, interior OL).  Production-wise it’s fairly close.

Screen Shot 2013-02-06 at 1.55.05 PM

The 5th round has to go to the Eagles since Trent Cole is by far the best selection from either team.

Screen Shot 2013-02-06 at 1.55.13 PM

This 6th round is a relative wasteland for the Eagles, though there’s hope Kelce will change that. Meanwhile the Ravens hit on Thomas and Taylor.  Note: that is not a typo, Derek Anderson really did make a Pro Bowl.

Screen Shot 2013-02-06 at 1.55.21 PM

Script gets flipped for the 7th round, as the Ravens haven’t found anyone useful.  The Eagles have done a pretty good job in the 7th, though that can also be attributed to the weakness of the team allowing players like Chaney and Coleman to become starters.

Screen Shot 2013-02-06 at 1.55.42 PM

As you can see, when it comes to drafting it’s a fine line between genius (Ozzie) and fired (Andy), but it depends largely on success in the 1st round.  The only real standout for Ozzie in the later rounds is Adalius Thomas.

Newsome has had a lot of success with UFAs, but in terms of the actual draft, he’s built his reputation on the performance of his first round picks, not late-round steals.

Field Position Persistence

As I mentioned a few weeks ago, there are several reasons to be hopeful that the Eagles can rebound quickly from this year’s poor performance.  After going through the stats it seems clear to me that this year the Eagles were a mediocre team will really bad luck (and a lot of injuries).

As evidence, I showed how both the offense and defense we actually ranked in the middle of the pack according to yards for/against.  A big difference, however, was the team’s net average starting field position, which was last in the league at -6.67 (So opposing teams, on average, started nearly 7 yards better than the Eagles.)  In fact, that was the fourth worst measure of any team over the past 5 years (’11 Colts/Chiefs and ’09 Lions were worse).

This measure is effected mostly by two aspects of the game, special teams and turnovers. The Eagles were terrible at both this year.  As I illustrated previously, though, turnovers are largely random, showing little persistence from year to year.  Therefore, since turnovers impact field position, we should expect little persistence in the Net Average Starting Field Position measure.

If this too is largely random, then we can expect both the Eagles offense and defense to perform better next year purely as a result of have less yards to go to score (or more yards to go for the opposition.)

Using the past 5 years, I charted each team’s Net Field Position against that team’s same measure the following year.  Here is the chart:

Screen Shot 2013-02-05 at 10.35.19 AM


The correlation value is 0.14.  So some persistence, but fairly small, which is what we thought we’d see.

Over the next few weeks there will be a lot of talk about things like coaching schemes and who stays/goes, but I doubt we’ll hear anyone say the Eagles could keep the same exact team for next year and have a good chance of finishing .500 or better as things like the fumble recovery rate revert to the mean (probably, it’s possible the team will be very unlucky next year but the odds of that are pretty small).

Other notes:

– The 49ers have led the league in net field position in both of the last two seasons.  Last year, the 49ers had the highest mark of the last 5 seasons, with a net value of 9.39, which is a massive advantage.

– Over the past 5 years, the Patriots have the best average (+4.13 yards).  The only other team above +3 is Atlanta (+3.44 yards).

– Detroit has the worst 5-year average, -2.73 yards.  Last year’s Colts had the worst measure for and individual season at -7.26 yards.

– The Eagles 5-year average is -.806 yards.

All data is from Football Outsiders.

Odds and Ends and the Super Bowl

I’m guessing everyone watched last night’s game, which was great.  I’m going to do a full Rewind on it when I get access to the film, so look for that at the end of this week.

Some notes:

– First, a rant:  The officiating at the end of the game was unfortunate (that’s putting it lightly).  Clear interference on the 4th down pass, regardless of what Mike Pereira says.  I’m tired of announcers and commentators giving officials a pass by saying “in real-time it’s a tough call to make”.  I don’t care if it’s a difficult call to get right, it’s their job. Everyone else in the league is expected to make difficult plays, officials shouldn’t be any different.

Also, the idea of giving the players more leeway at the end of games is absurd.  Many people talk about how the players should be the ones deciding games, but an official NOT making a call is just as significant as throwing a flag.

The intentional safety play also featured a number of outrageously obvious holding penalties that weren’t called.  Not that it would have made a difference, but the infractions were so egregious that the only explanation is the refs actually did “put the whistles away”, which is unacceptable.

– Did anyone have a hard time not thinking of Eddie Murphy’s Buckwheat when listening to Jerome Boger last night?  Is that offensive?

– Remember the post about how taking the ball out of the back of the end zone is actually a decent decision most of the time?  So that worked out pretty well, though I obviously would have expected it to come from the 49ers.

– 49ers didn’t run the read-option very much.  Obviously the Raven’s game-plan was to make that difficult, but I’ll be paying close attention to exactly how they managed to shut down a scheme that so many others struggled against.

– Anquan Boldin deserves a lot more credit then he gets.

– As a reminder that nobody needs, the Eagles beat the Ravens this year…

– Nick Foles’ college career and rookie year statistics are now eerily similar to a Super-Bowl winning quarterback.

– Ray Rice does NOT have a fumbling problem. Just terrible luck and bad timing.

– Anyone else really disappointed that Jay-Z didn’t come out for a verse with his wife?  That would have made it easily one of the best halftime shows ever.

Here is a fun chart.  No great insight, but still interesting to look at.  I graphed every team’s point differential vs. its regular season wins for the last ten seasons and highlighted the Super Bowl winning teams.

Screen Shot 2013-02-04 at 12.10.28 PM


For reference, a data point below the line means the team won MORE games than expected, while a point above the line means the team won FEWER times than expected.

Needless to say…fuck the Giants.

Eagles Inefficient Draft Choices

Using our chart from yesterday, I went back over the Eagles draft history from the sample time period and separated the “inefficient” picks from the “efficient” ones.  Note: After reviewing the chart, I made one change, taking the 4th round WR selection out of the “inefficient” category.

First a couple interesting notes:

– Overall, there are 3310 players included in this analysis.  League-wide, just over 42% of these are considered sub-optimal/inefficient picks by our chart.

– Exactly 50% of Eagles draft choices from 1999-2011 graded as sub-optimal.

– This is surprising because in our earlier analysis, the Eagles actually came out as among the better drafting teams in the league (top third, though there’s a big margin of error in those rankings.)

Up until now, this has been a largely abstract discussion, but it’s about to get real.  Below is a chart of all of the Eagles inefficient draft picks by our standards.  Look on in dismay… Unfortunately, since the Eagles are part of the sample, we can’t really say the team would have been better off if they had never made any of these picks, but it sure seems like that’s the case (it’s an all or nothing decision to use the strategy, so you can’t pick out Shady and Celek and give back the rest).

Screen Shot 2013-01-31 at 1.48.35 PM

Remember that I’m not saying all of these are BAD choices, just that for the team to make them, it should have had extremely strong support for why each player was better than the rest of the prospects at his position group.  I’m guessing that the Eagles, for the most part, did not apply that standard…though Shady does seem like he may fit that description as I recall him being rated significantly higher than any other RB at the time.

Given a do-over, how many of those picks would you still make?

Also, it sheds some light on supposed draft “steals”.  For example, we can all agree that Brent Celek was well worth a 5th round pick (in hindsight).  But how much credit should the Eagles get for that selection?

Using our sample, if you selected 3 TEs in the fifth round at random, you would have a roughly 39% chance of finding a “starter” (1-(.85^3)).  Not fantastic odds, but pretty good.  So was Celek skill or just the result of the overall odds given that the Eagles tried three times to find a TE in the 5th round?

P.S. I forgot to note yesterday that ZERO out of 54 DTs taken in the 7th round from 1999-2011 became starters.  The Eagles selected 3 such players.

I know I mentioned yesterday that I would discuss the whole Talent vs. Need philosophy, but I’m going to wait until I can add some more data to the discussion.

Hacking the Draft….Default Positional Targets by Round

Yesterday we took a look at the success rates of different positions by draft position and round.  Today, we’ll use the chart to go a step further, identifying Position/Round combinations that are clearly sub-optimal and eliminating them.  After doing this we arrive at a modified chart that provides some valuable information and can greatly inform draft strategy.  Please note that this analysis is based on the general philosophy that says: The draft should be used to maximize talent and increase the overall skill level of the team.  Free agency and trades should be used to plug roster holes.  I’ll detail why I believe this is the case tomorrow.

First, a few caveats.  All of this relies on the assumption that our sample (draft picks from 1999-2011) is representative of draft classes going forwards.  This may not be the case, but it’s a fairly large sample and I have no reason to believe it is significantly skewed.

Also, when broken down by position and round, we are dealing with small sample sizes.  For instance, our sample has just 10 centers that have been chosen in the 5th round, with just 2 qualifying as “starters”.  Obviously, this is not a large enough sample to conclude that 20% is the true probability of finding a starting center in the 5th round.  This is a good example of why we are refraining from setting strict rules, instead using it to develop a general strategy.

Lastly, the first round of the draft is fundamentally different from the other rounds, especially in the very early picks.  The goal in the first round (especially in the top 10) is to find an elite player, regardless of position.  Therefore, as a general instruction for using the strategy we develop here: It should be adhered to more strictly as it gets later in the draft.    So picks in the first round should be based largely on scouting and player evaluations, whereas picks in the 7th round should be based almost entirely on historical probability.  This is particularly important for Eagles fans, since the team has the #4 overall pick.  For that selection, throw this chart away and hope for an All-Pro caliber player at whatever position in which that skill level is available.

The Process:

Here is a sample chart comparing three positions and their associated success rates in each round:

Screen Shot 2013-01-30 at 9.42.19 AM

Focus on the first two rounds and think about which positions you would select in both the 1st and 2nd round.  While there is plenty of room for disagreement, my personal opinion would be that the DE position is the optimal choice in the 1st, despite the DB position having better odds of success.  The reason for this is the relative decline in odds as you move later in the draft.  In the second round, the DE success rate is just 36%, whereas DB success is still above 50%.  Conversely, LBs are clearly not a good decision in the first round, since the success rate for the position falls off very little as you move into the 2nd round, making a 2nd round LB a MUCH better value than a first rounder.

Using that relatively simple analysis and applying it throughout the draft, we get this chart:

Screen Shot 2013-01-30 at 10.29.40 AM

I’ve blacked out areas that, in my opinion, are not good values based on our stats.  Consult yesterday’s post if you want to check the odds yourself, but in most cases I just eliminated rounds that offered no better odds of success than later opportunities.  Careful observers will note that I could have gone much farther if I applied the relative draft pick value standard to each area.  For example, according to the default NFL Draft Value chart, a 5th round pick is worth more than four 7th round picks (a clear example of how flawed the Draft Value chart is IMO).  Applying that to the chart, you would obviously rather choose four DBs in the 7th round (9% success each) than one DB in the 5th round (14% success each).  However, due to the number of uncontrolled variables and the potential for non-representative samples, we need to be careful not to go overboard and fall victim to false precision.

Now that you know the general idea/process behind the chart, take a minute to look at it and you’ll notice some interesting things (and almost definitely pick up on things that I will fail to mention or haven’t realized).

My takeaways:

– The 5th and 6th round are particularly notable for the small number of positions for which these picks make sense.  The 6th round is a relative wasteland, suggesting that at this point scouting means nothing.  Therefore, if we stick to the chart, a team should either choose a DT, TE, or G in the 6th round or trade down into the 7th round.  Any other decision is an inefficient use of assets.

It’s possible the Patriots realize this, explaining why they were willing to move down a pick in the 6th round of 2011 (trading with the Eagles) for no compensation, in a trade reportedly made “just for fun”.

– This is also a clear illustration of why DEs are so valued by some teams.  If you do not choose one in the 1st round, the next opportunity to choose one efficiently isn’t until the 5th round, when your odds of success are just 23%.

– The 7th round might be best used exclusively on the OL.  Looking at the odds above, it’s clear that T/G/C have a much better chance of success as 7th round picks than any other significant position.

– RBs are incredibly hard to pick, and it is probably a better use of resources to just sign one in free agency.  (Hard to believe for Eagles fans, since both Shady and Bryce were draft picks.  These guys are RARE exceptions.)

– WRs are rarely an efficient pick, with just the 1st, 2nd, and 7th rounds as value opportunities according to our chart.

There is plenty more we can do with this information, but I’ll hold off on that until another day.  In particular, we can use this to grade teams’ performance over the past decade, which I hope to do soon.


Hacking the Draft…Comprehensive Chart

Hopefully everyone has enjoyed the round-by-round breakdown.  While there are obviously a number of variables that can’t be controlled for, the pure statistical look at each position group has already provided some interesting insight.

Before I get to the big chart, let me just clarify exactly what I think this type of analysis is good for, then dig into an Eagles example.  Feel free to skip to the chart and come back.

The purpose of this is NOT to arrive at a set of rules by which teams should draft players.  Instead, it is meant to provide a general guideline, or a “default draft position”.  For example, yesterday I said that selecting DEs in the 3rd round is a terrible value proposition according to the data I’ve collected.  That doesn’t mean drafting a DE in the 3rd round is ALWAYS a terrible decision, it just means that for a team to make that decision, it must see or know something about the subject player that makes him CLEARLY much better than any other prospect available at that position.

The biggest flaw in NFL draft strategy, as far as I can tell, is each team’s confidence in its own ability to evaluate talent.  Regardless of the general manager, every team has historically had a very large margin of error when it comes to talent evaluation.  For instance, in the 1st round less than 6 in 10 LBs selected from 1999-2011 had or are having significantly productive careers (according to our definition.)

So what does that mean?  It means teams, in general, should be mostly focused on value during the draft, as opposed to parsing prospects.  This is perhaps never more apparent than when a team decides to trade up to select someone.  Let’s use the Eagles as an example.  NOTE: This is a very rough example, with numbers pulled from my ass, and is only meant to illustrate a larger point.

When the team traded up for Brandon Graham, it swapped 1st round picks with Denver and gave up two 3rd rounders as well (moving up from 24 to 13).

At the 13th pick, no DEs had been taken.  Between picks 13 and 24, 3 were taken, including Graham.  So that means the Eagles, in their analysis, decided that they had to take a DE (will not argue that decision here, though I was mad they passed on Early Thomas, and can produce witnesses that will verify I said that when it happened).

The only way the trade made sense was if the Eagles, in their DE analysis, decided that the odds of Graham becoming a stud DE were MUCH higher than the odds of JPP, Morgan, or Hughes becoming a stud DE.  Here is where the “margin of evaluation error” comes into play.

Using our historical draft data, we can calculate the odds of getting a starting DE with a 1st round pick and two 3rd round picks (I realize they were hoping more than an average starter, but stay with me).  Using the table below, we can calculate those odds to be 81.5%.  Using the Pro Bowl percentages from the earlier tables, we arrive at 37% for the odds of getting a Pro Bowl DE if you select DEs with a 1st round pick and 2 third round picks.  So here is the breakdown for “generic DEs”:

– 1st Round Pick – 24% chance of Pro Bowl, 67% chance of starting

– 1st Round Pick and 2 third round picks – 37% Pro Bowl, 81.5% starting.

Please note that this DOES NOT mean the Eagles made a bad decision.  Obviously the odds should be better for the 13th pick than for the 24th pick (we’ll get to that another time).  It DOES MEAN, however, that the Eagles, in their evaluation of Brandon Graham, should have been almost certain that he was more than 37% likely to be Pro-Bowl caliber, and more than 81.5% likely to start.

I have no doubt that they believed this, BUT, if they had applied a margin of error to their own analysis (as any good team should) prior to making the trade, they would have been unlikely to go through with it.  Let’s be extremely generous and assume the Eagles front office could peg these odds with a MOE of +/- 15% (WARNING: overly simplified statistics).   That means if they estimated Graham had a 90% chance of starting, his true odds of starting were almost definitely between 75-100%.

Immediately we can see an issue.  Even giving Graham incredibly high odds of starting (90%, which is more bullish than any team should be with any players outside the top few picks) and the Eagles a very generous MOE (+/-15%), the resulting range still does not exclude the 81.5% starting odds for the generic position of a first and two thirds (although it is near the bottom of that range).

That means the Eagles really should NOT have been (though I’m sure they were) confident that Graham would be better than just taking whichever DEs were available at #24 and in the third round, and hence, should not have made the trade.

I don’t mean to suggest that trading up is never a good idea, simply that the evaluative bar for whichever prospect is the target must be EXTREMELY high, and much higher than the standard currently being applied by most teams.

My final point:  Teams do not appear to take a probabilistic approach to drafting (which they almost certainly should), and I would guess that they do not actively overlay a margin of error onto their evaluations.  This is very much a “new-school vs. old-school” issue, similar to the statistical revolution in baseball, but IT IS NOT THE SAME.  It is largely a matter of GMs being willing to recognize and account for their own shortcomings and cognitive biases.  The franchises that can apply this will, in the long run, be more successful than those that don’t.  (Looking into which teams might be using this type of strategy will be another day’s post)

Ok, enough talk.  Here is the chart with every round included. I removed the All-Pro and Pro Bowl columns to make it easier to compare.  Dig into it and see what you think.  Later this week we’ll mine it for an “optimal default strategy”.

Screen Shot 2013-01-29 at 10.54.06 AM

Hacking the Draft…4th round breakdown

Today we get the 4th round historical breakdown and, finally, we get some incredibly interesting results.  As a reward for sticking with me through this, I’ll give you a couple takeaways first, which I’ll follow with the chart.

– In the 3rd Round, teams should NOT DRAFT:  Defensive Ends, Defensive Backs, Quarterbacks, Fullbacks.

– Conversely, teams should focus on: Tackles, Running Backs, Tight Ends.

Here is the side-by-side comparison, at this point IGNORE the All-Pro and Pro-Bowl columns:

Screen Shot 2013-01-28 at 10.57.23 AM

Plenty to notice here.

– Most surprising are the position groups I listed above.  From 1999-2011, 3rd round DEs, QBs, and FBs were LESS LIKELY to become significant contributors than were 4th round picks at the same positions.  (DBs in the 3rd and 4th round were about equal)

– We must also keep the relative value proposition in mind.  Looking at the default NFL Draft Value Chart, an average 3rd round pick is worth TWO 4th round picks.  So let’s game out an example:

Team A wants a DE and is sitting at its pick in the 3rd round.  That team can either select a DE or trade down, picking up two 4th round picks in exchange for the 3rd.  That team can then use BOTH 4th round picks to select two DEs.  Which offers better odds and by how much?

3rd Round DE:  25% chance of a starter (chart above)

Two 4th Round DEs: 48% chance of a starter (.72*.72=.5184 chance of missing both, 1-.5184=.48)

So by making the trade, the team has nearly DOUBLED its chances of finding a starting caliber DE.

– Also notice that our 2nd round breakdown showed that DEs chosen in that round have a 36% chance of starting.  Here, the value proposition looks incredible.  According to the Value Chart, an average 2nd round pick is worth nearly 6 4th round picks!  Obviously it’s almost impossible to make that trade (no team has six 4th round picks in the same year), but there appear to be severe inefficiencies in the draft value chart.

– The Eagles, over that time-frame, used three 3rd round picks on DEs…

– The Eagles, over that time-frame, used two 3rd round picks on DBs…

– The Eagles, over that time-frame, had 12 TOTAL 3rd round picks.  They used nearly half of them very poorly.  (Statistically speaking, not a grade of how those picks actually worked out)

Caveat – This analysis is based on nothing but the overall odds of each position groups success.  I did not control for the fact that different teams had different numbers of picks.  So it’s possible that (if drafting has a lot of skill) bad drafting teams had more 3rd round picks, skewing the results.  We’ll get to the skill aspect a little later, but I am very skeptical that it has resulted in any significant skew to these results.

Tomorrow, I’ll show rounds 5-7 and then we’ll start putting together an “ideal” draft strategy.

More on Kick Returns

GUEST POST (Jared):

This one is shorter and just as interesting, I promise.

In response to a comment on yesterday’s post, I took a deeper look at the stats to see which teams were best at kick returns.

Remember, we looked specifically at ‘touchback-eligible’ returns, meaning kicks that traveled into the end zone and were brought out.  We examined these situations because they are instances where returners have to make a choice on what to do.  Our initial analysis of this past year provided a couple of insights.

–        Kick returners have a good sense of when to run the ball out of the end zone, providing their teams, on average, better field position than just taking a touchback.  This persists even on kicks landing deep in the end zone, and even when adjusting for the risk of turnovers (but not injuries).  Therefore, players returning kicks deep in their own end zone are, in fact, probably making the right decision.

–        However, the Eagles performed both significantly worse than average and significantly worse than if they had just accepted a touchback every time.  This raises questions as to why (Boykin’s decision making, coaching, talent, etc.).

But, another question came up.  How much better are the best teams at making these decisions?  The graph below is a repeat of one of our initial graphs, but with all NFL teams included alongside the Eagles and the NFL average.

Screen Shot 2013-01-25 at 11.12.45 AM

The best teams, the Jets, Broncos, and Vikings, averaged over 0.80 Expected Points, significantly higher than both the NFL average of 0.45 and the touchback value of 0.34.

When we look at the return distribution for these successful teams, we can see why this is the case and why their Expected Points are so much higher than the Eagles.

Screen Shot 2013-01-25 at 11.12.53 AM

It may be hard to see on the page, but notice all the kick returns beyond the 30 yard line?

The Jets, Broncos, and Vikings all have a good chunk of returns that go farther (even some touchdowns between then) than the 30.

You’ll notice that the Eagles have none.

Therein lies the difference.  Kickoff returns can have a decent degree of variance, and the overall performance of your return game hinges on the idea that you’ll bust some long returns over the course of the season.

The best teams do that more often, and this year, the Eagles never did.

But the results here got me thinking again (they tend to do that).  If the Vikings, Broncos, Jets, or other teams are so good at returning kicks, shouldn’t they be returning them more often?  And shouldn’t teams with poorly performing special teams take a knee more often?

If teams are behaving logically, we’d expect to see a relationship between return effectiveness and return percentage.

So what do we see?

Screen Shot 2013-01-25 at 11.13.00 AM

Looks like a relationship to me.

Generally speaking, the better you are at returning kicks, the more often you do it!  (I guess the reverse causality is also possible, but that seems much less likely).

We don’t see all that many weird looking outliers here, although a couple of cases are circled that are worth mentioning.

At first glance, it looks like several teams should be returning the ball more often.  The Jets, Vikings, Colts, and Broncos.  Are there reasonable explanations for why these teams didn’t return more kicks?

With the Broncos, you may have already guessed what’s at work.  Elevation.

Unfortunately, there are a lot of kickoff instances that are only listed in the Play by Play as ‘touchback’ without detail on how far the ball traveled.  I’d infer that most of these are kicks in Denver that simply are put out the back of the end zone given the high altitude.  It’s a shame, because it looks like Denver is pretty good at returning kicks.

The Colts also appear to have some explaining to do.  With such a high Expected Points average, why wouldn’t they return the ball more?  Looking at the data, it seems like they’ve rotated kick returners.  Earlier on in the year, through week 12, they had five different returners who combined to average just better than a touchback in terms of Expected Points.

But for the last few weeks of the season, Deji Karim took over and broke a number of long returns including a 101 yard TD against the Houston Texans.  Their boost came late in the year, and they didn’t have enough time to start moving their return %.

I thought the Vikings case would be easily explained by Percy Harvin getting injured, as he’s a fairly dynamic kick returner.  However, the team’s touchback % on eligible kicks didn’t change after he left the lineup and his replacement also did an above average job.  Maybe they should’ve just returned more (unless they wanted Adrian Peterson to have as long a field as possible!)

The last one I spent some time investigating was the 49ers.  They returned far and away the most touchback-eligible kickoffs, but with roughly average results.  What gives?

I assumed it was a combination of Ted Ginn and Kyle Williams just returning everything in sight.  But even when Kendall Hunter or LaMichael James returns, they don’t willingly take touchbacks frequently.

Jim Harbaugh has a rep as a great coach, with a keen eye towards in-game decision-making.  It wouldn’t surprise me to learn that he’s thought about this issue and for whatever reason has emphasized running kicks out of the end zone all the time.  The team is above average at doing so, and does significantly outpace taking a knee every time.  But I have to think there’s more at work there for a team to run kicks out of the end zone over 75% of the time.

Next up we’ll return to our historical draft breakdown, this time putting every round together (once I figure out the best way to display it all on one graphic).

Examining Kick Returns (The league is good…the Eagles bad…very bad.)

Guest Post (Jared):

WARNING: This is a long one, so wait until you’ve got more than a couple minutes.  Or, if you’re struggling to kill time at work, you’re welcome.

As everyone knows, this year the NFL altered its kickoff rules, with the goal of enhancing player safety (and looking past the obvious contradiction with a game that emphasizes hitting people).  As it was explained, kickoffs are a type play uniquely suited to injuries, as you essentially take two full teams of players and have them run at each other with a huge head start to build up speed.  Concussions galore (remember Jason Short?)

That general conversation got me thinking about kickoffs more generally.  Simply put:

Does returning a kick make sense?

When you receive a kickoff, there are really on 4 potential outcomes, only one of which involves any decision making:

1 – It’s an onsides kick and the kicking team is trying to recover it…let’s ignore these

2 – The kick goes out of bounds, incurring a penalty, or through the back of the end zone for a touchback…let’s ignore these too

3 – The kick is fielded short of the team’s end zone, and must be returned (you could conceivably take a knee, but that obviously not be the optimal decision).

4 – The kick is fielded in the team’s end zone, and is either downed for a touchback or returned

For this discussion, we’ll focus on number 4, a returner taking the ball out of the end zone.

I felt like there were lots of instances over this past season where a returner would field the ball deep in their end zone and bring it out, only to be stopped short of the 20 yard line (the spot they’d reach with a touchback).

In light of that, I wanted to take a look at the risk-reward trade-off involved in returning kicks out of the end zone.

Sure, a kick return has a small chance of scoring a touchdown, or providing the team with dramatically improved field position (I know that’s hard for Eagles fans to imagine, but I swear it’s possible.)

However, returns also expose teams to a couple additional risks (besides not reaching the 20).  The first is a turnover, and a hugely damaging one at that (immediately gives the ball to the other team, who likely just scored, in your territory.)  The other, less quantifiable, risk is that the team will sustain an injury.  These may occur when the kick returner takes the ball out of the end zone, but not on a touchback, and as such should be considered by whoever is making the decision to return the kick.

So…Do NFL return men suffer from an incentive problem that causes them to behave in a way that reduces the chances of their team winning?

As a theory, it made sense to me.  I assume NFL kick returners can maximize their income by scoring more touchdowns (contract incentives can be based on this very metric), whereas no one gets incentivized to take more touchbacks, even if a touchback is a safer decision.  So it wouldn’t surprise me to see kick returners taking the ball out more than they should, to try and create the big plays that get them noticed and get them paid.

However, nice theory or not, we needed to actually gather some evidence to see if it’s true (or if when I’m yelling at returners to take a knee, I should probably just keep my mouth shut)

METHODOLOGY

I gathered play-by-play data from this past season (although somehow Week 1 got cut out, so it’s just Weeks 2 through 17).  That started me off with over 2,000 kickoffs from across the league (excluding onsides and squib kicks).

I then filtered out any kicks that didn’t make it into the end zone (But since the NFL moved the kicking location from the 30 to the 35, there weren’t as many of those as in years past).

Now, of the remaining kicks, more than half of them were downed for touchbacks (or the kick went out the back of the end zone, which I couldn’t completely control for given the data).

That left me with over 900 instances where a kick returner had the chance to decide whether or not to bring the ball out of the end zone and decided to go for it.

So, all that was left was to figure out whether they made the right choice or not (with one key caveat I’ll describe later)

To do that, I used what football analysts have termed Expected Points (http://www.advancednflstats.com/2010/01/expected-points-ep-and-expected-points.html)

The included link explains the concept much more effectively than I can, but Expected Points is related to the idea that field position matters.  Having the ball on your own 1-yard line is much worse than having it at the 50, right?  Well, Expected Points attempts to quantify exactly how much more or less valuable a particular spot on the field is (with additional complexity for down and distance).

For example, having the ball in a first and ten situation at midfield is worth 2 expected points.  If your team starts in that scenario, in general, you can expect an advantage of 2 points over your opponent.   Having the ball in a first and ten on your opponents’ 10-yard line is worth an expected 4.7 point advantage, which makes intuitive sense.  The closer you are to the goal line, the more expected points that situation is worth.  All values taken from Brian Burke’s model, which he graciously has shared.

On kickoffs, it’s pretty straightforward, because every kickoff will result with one team getting the ball in a first and ten situation.

Now, the model I used for my Expected Points estimates the value of a first and ten at your own 20-yard line (the situation in a touchback), to be worth approximately 0.34 points.  That may not seem like very much, but remember, 80 yards on a football field is a long way to go.

With that as our baseline, we can take all the kicks returned and measure the expected points of the results.  We also need to be careful of turnovers, because a turnover not only costs you the expected points from your possession, it also provides the opponent with more expected points!

But before we go there, I did mention something about a caveat to this analysis.

Here’s the issue, there’s obviously a bit of bias inherent in this sample.  Kick returners, assuming they are well-trained and skilled (basically, not Reno Mahe) should be able to recognize good opportunities to return kicks.  We should hope that returners can understand good blocking vs. back blocking and know when to take a knee.

If that were the case (and if my theory about greedy return men is wrong), then we’d expect to see returned kicks having a higher expected points value.  Otherwise either the returners are making sub-optimal decisions related to winning the game, or they can’t read their blocking well.

So what is it???

Screen Shot 2013-01-24 at 9.44.52 AM

Returns brought out of the end zone are better, providing 0.46 expected points rather than a touchback of 0.34 (sample is over 900 kicks returned).

This implies that returners actually know what they’re doing, and that they recognize when to bring the kicks out vs. when to take a knee.  The incentives are not as misaligned as I theorized.

I also looked a little deeper; to see whether kicks farther into the end zone (like 6-9 yards deep) were any different.

Screen Shot 2013-01-24 at 9.45.43 AM

Nope, nothing particularly different about them, although the shorter the kick, the better the starting field position when it is returned.  But at least based on the data, it seems like returners are actually making the right return decisions.

But wait, there’s just one other thing.

A lot of this perception comes from the games I’ve watched this year.  And it just so happens that most of the games I watched featured the Eagles.  So what happens when we look at just THEIR performance (ranked near the bottom of the league in average kick return yards)?

Screen Shot 2013-01-24 at 9.46.13 AM

Oh dear.

When the Eagles returned kicks this year, and specifically brought the ball out of the end zone, they created an average of 0.16 expected points, significantly worse than simply taking a touchback.  Now, a good portion of this score is skewed by one specific play, namely, Brandon Boykin fumbling a kick return against Carolina in week 12.  But even when you remove that turnover, the results are still worse than if they had simply taken a knee every time.

The problem becomes even easier to spot if we plot the results of Eagles ‘touchback-eligible’ returns against those of the entire league.

The chart below illustrates the average starting position following kicks into the end zone which were returned, grouped in five yard increments (for example the 45 bin is for all kicks returned between the 41 and the 45 yard line…the 100 bin represents touchdowns)

Screen Shot 2013-01-24 at 9.46.47 AM

See how the Eagles have absolutely no ‘touchback-eligible’ returns beyond the 30-yard line (I excluded Boykin’s fumble, which to his credit, was almost in Carolina territory at the time)?

What the team managed to do this year was take a higher-risk, higher-reward scenario, returning potential touchbacks out of the end zone, and collect exactly zero rewards!  They would’ve been better off taking a knee on average (note: this assumes your offense is better than your special teams, perhaps a dubious assertion).

It’s hard exactly to know where the blame lies in this situation.  Does it rest with the now departed special teams coach Bobby Abril (who, if everyone remembers, was billed as a ‘guru’ level hire when he was brought in from Buffalo)?

Does it lie with Boykin, a rookie kick returner who may have had trouble reading his blocks?

Does it like with Howie Roseman and the administration for an overall lack of depth that kept the Eagles from having a solid set of special teams players?

Maybe a combination of all of the above? (Probably)

The major takeaways from the analysis point to a few things:

– NFL kick returners know what they’re doing, and appear to have a good sense of when to bring the ball out of the end zone, even after accounting for potential turnovers.

– However, the Eagles would’ve been better off taking a knee every time the kick fell in the end zone.  The team was SIGNIFICANTLY worse than the rest of the league.  This is an underrated weakness of the team and, if it’s addressed, could help the Eagles rebound quickly.

– If the NFL really wanted to limit kick returns, and I’m not sure it did, it probably should have move the touchback spot to beyond the 20-yard line.  (To eliminate returns completely, which wasn’t the goal, the league would want to see the Expected Points value of a touchback equal or greater than that of a return in the first chart above.)