Eagles Inefficient Draft Choices

Using our chart from yesterday, I went back over the Eagles draft history from the sample time period and separated the “inefficient” picks from the “efficient” ones.  Note: After reviewing the chart, I made one change, taking the 4th round WR selection out of the “inefficient” category.

First a couple interesting notes:

– Overall, there are 3310 players included in this analysis.  League-wide, just over 42% of these are considered sub-optimal/inefficient picks by our chart.

– Exactly 50% of Eagles draft choices from 1999-2011 graded as sub-optimal.

– This is surprising because in our earlier analysis, the Eagles actually came out as among the better drafting teams in the league (top third, though there’s a big margin of error in those rankings.)

Up until now, this has been a largely abstract discussion, but it’s about to get real.  Below is a chart of all of the Eagles inefficient draft picks by our standards.  Look on in dismay… Unfortunately, since the Eagles are part of the sample, we can’t really say the team would have been better off if they had never made any of these picks, but it sure seems like that’s the case (it’s an all or nothing decision to use the strategy, so you can’t pick out Shady and Celek and give back the rest).

Screen Shot 2013-01-31 at 1.48.35 PM

Remember that I’m not saying all of these are BAD choices, just that for the team to make them, it should have had extremely strong support for why each player was better than the rest of the prospects at his position group.  I’m guessing that the Eagles, for the most part, did not apply that standard…though Shady does seem like he may fit that description as I recall him being rated significantly higher than any other RB at the time.

Given a do-over, how many of those picks would you still make?

Also, it sheds some light on supposed draft “steals”.  For example, we can all agree that Brent Celek was well worth a 5th round pick (in hindsight).  But how much credit should the Eagles get for that selection?

Using our sample, if you selected 3 TEs in the fifth round at random, you would have a roughly 39% chance of finding a “starter” (1-(.85^3)).  Not fantastic odds, but pretty good.  So was Celek skill or just the result of the overall odds given that the Eagles tried three times to find a TE in the 5th round?

P.S. I forgot to note yesterday that ZERO out of 54 DTs taken in the 7th round from 1999-2011 became starters.  The Eagles selected 3 such players.

I know I mentioned yesterday that I would discuss the whole Talent vs. Need philosophy, but I’m going to wait until I can add some more data to the discussion.

Hacking the Draft….Default Positional Targets by Round

Yesterday we took a look at the success rates of different positions by draft position and round.  Today, we’ll use the chart to go a step further, identifying Position/Round combinations that are clearly sub-optimal and eliminating them.  After doing this we arrive at a modified chart that provides some valuable information and can greatly inform draft strategy.  Please note that this analysis is based on the general philosophy that says: The draft should be used to maximize talent and increase the overall skill level of the team.  Free agency and trades should be used to plug roster holes.  I’ll detail why I believe this is the case tomorrow.

First, a few caveats.  All of this relies on the assumption that our sample (draft picks from 1999-2011) is representative of draft classes going forwards.  This may not be the case, but it’s a fairly large sample and I have no reason to believe it is significantly skewed.

Also, when broken down by position and round, we are dealing with small sample sizes.  For instance, our sample has just 10 centers that have been chosen in the 5th round, with just 2 qualifying as “starters”.  Obviously, this is not a large enough sample to conclude that 20% is the true probability of finding a starting center in the 5th round.  This is a good example of why we are refraining from setting strict rules, instead using it to develop a general strategy.

Lastly, the first round of the draft is fundamentally different from the other rounds, especially in the very early picks.  The goal in the first round (especially in the top 10) is to find an elite player, regardless of position.  Therefore, as a general instruction for using the strategy we develop here: It should be adhered to more strictly as it gets later in the draft.    So picks in the first round should be based largely on scouting and player evaluations, whereas picks in the 7th round should be based almost entirely on historical probability.  This is particularly important for Eagles fans, since the team has the #4 overall pick.  For that selection, throw this chart away and hope for an All-Pro caliber player at whatever position in which that skill level is available.

The Process:

Here is a sample chart comparing three positions and their associated success rates in each round:

Screen Shot 2013-01-30 at 9.42.19 AM

Focus on the first two rounds and think about which positions you would select in both the 1st and 2nd round.  While there is plenty of room for disagreement, my personal opinion would be that the DE position is the optimal choice in the 1st, despite the DB position having better odds of success.  The reason for this is the relative decline in odds as you move later in the draft.  In the second round, the DE success rate is just 36%, whereas DB success is still above 50%.  Conversely, LBs are clearly not a good decision in the first round, since the success rate for the position falls off very little as you move into the 2nd round, making a 2nd round LB a MUCH better value than a first rounder.

Using that relatively simple analysis and applying it throughout the draft, we get this chart:

Screen Shot 2013-01-30 at 10.29.40 AM

I’ve blacked out areas that, in my opinion, are not good values based on our stats.  Consult yesterday’s post if you want to check the odds yourself, but in most cases I just eliminated rounds that offered no better odds of success than later opportunities.  Careful observers will note that I could have gone much farther if I applied the relative draft pick value standard to each area.  For example, according to the default NFL Draft Value chart, a 5th round pick is worth more than four 7th round picks (a clear example of how flawed the Draft Value chart is IMO).  Applying that to the chart, you would obviously rather choose four DBs in the 7th round (9% success each) than one DB in the 5th round (14% success each).  However, due to the number of uncontrolled variables and the potential for non-representative samples, we need to be careful not to go overboard and fall victim to false precision.

Now that you know the general idea/process behind the chart, take a minute to look at it and you’ll notice some interesting things (and almost definitely pick up on things that I will fail to mention or haven’t realized).

My takeaways:

– The 5th and 6th round are particularly notable for the small number of positions for which these picks make sense.  The 6th round is a relative wasteland, suggesting that at this point scouting means nothing.  Therefore, if we stick to the chart, a team should either choose a DT, TE, or G in the 6th round or trade down into the 7th round.  Any other decision is an inefficient use of assets.

It’s possible the Patriots realize this, explaining why they were willing to move down a pick in the 6th round of 2011 (trading with the Eagles) for no compensation, in a trade reportedly made “just for fun”.

– This is also a clear illustration of why DEs are so valued by some teams.  If you do not choose one in the 1st round, the next opportunity to choose one efficiently isn’t until the 5th round, when your odds of success are just 23%.

– The 7th round might be best used exclusively on the OL.  Looking at the odds above, it’s clear that T/G/C have a much better chance of success as 7th round picks than any other significant position.

– RBs are incredibly hard to pick, and it is probably a better use of resources to just sign one in free agency.  (Hard to believe for Eagles fans, since both Shady and Bryce were draft picks.  These guys are RARE exceptions.)

– WRs are rarely an efficient pick, with just the 1st, 2nd, and 7th rounds as value opportunities according to our chart.

There is plenty more we can do with this information, but I’ll hold off on that until another day.  In particular, we can use this to grade teams’ performance over the past decade, which I hope to do soon.


Hacking the Draft…Comprehensive Chart

Hopefully everyone has enjoyed the round-by-round breakdown.  While there are obviously a number of variables that can’t be controlled for, the pure statistical look at each position group has already provided some interesting insight.

Before I get to the big chart, let me just clarify exactly what I think this type of analysis is good for, then dig into an Eagles example.  Feel free to skip to the chart and come back.

The purpose of this is NOT to arrive at a set of rules by which teams should draft players.  Instead, it is meant to provide a general guideline, or a “default draft position”.  For example, yesterday I said that selecting DEs in the 3rd round is a terrible value proposition according to the data I’ve collected.  That doesn’t mean drafting a DE in the 3rd round is ALWAYS a terrible decision, it just means that for a team to make that decision, it must see or know something about the subject player that makes him CLEARLY much better than any other prospect available at that position.

The biggest flaw in NFL draft strategy, as far as I can tell, is each team’s confidence in its own ability to evaluate talent.  Regardless of the general manager, every team has historically had a very large margin of error when it comes to talent evaluation.  For instance, in the 1st round less than 6 in 10 LBs selected from 1999-2011 had or are having significantly productive careers (according to our definition.)

So what does that mean?  It means teams, in general, should be mostly focused on value during the draft, as opposed to parsing prospects.  This is perhaps never more apparent than when a team decides to trade up to select someone.  Let’s use the Eagles as an example.  NOTE: This is a very rough example, with numbers pulled from my ass, and is only meant to illustrate a larger point.

When the team traded up for Brandon Graham, it swapped 1st round picks with Denver and gave up two 3rd rounders as well (moving up from 24 to 13).

At the 13th pick, no DEs had been taken.  Between picks 13 and 24, 3 were taken, including Graham.  So that means the Eagles, in their analysis, decided that they had to take a DE (will not argue that decision here, though I was mad they passed on Early Thomas, and can produce witnesses that will verify I said that when it happened).

The only way the trade made sense was if the Eagles, in their DE analysis, decided that the odds of Graham becoming a stud DE were MUCH higher than the odds of JPP, Morgan, or Hughes becoming a stud DE.  Here is where the “margin of evaluation error” comes into play.

Using our historical draft data, we can calculate the odds of getting a starting DE with a 1st round pick and two 3rd round picks (I realize they were hoping more than an average starter, but stay with me).  Using the table below, we can calculate those odds to be 81.5%.  Using the Pro Bowl percentages from the earlier tables, we arrive at 37% for the odds of getting a Pro Bowl DE if you select DEs with a 1st round pick and 2 third round picks.  So here is the breakdown for “generic DEs”:

– 1st Round Pick – 24% chance of Pro Bowl, 67% chance of starting

– 1st Round Pick and 2 third round picks – 37% Pro Bowl, 81.5% starting.

Please note that this DOES NOT mean the Eagles made a bad decision.  Obviously the odds should be better for the 13th pick than for the 24th pick (we’ll get to that another time).  It DOES MEAN, however, that the Eagles, in their evaluation of Brandon Graham, should have been almost certain that he was more than 37% likely to be Pro-Bowl caliber, and more than 81.5% likely to start.

I have no doubt that they believed this, BUT, if they had applied a margin of error to their own analysis (as any good team should) prior to making the trade, they would have been unlikely to go through with it.  Let’s be extremely generous and assume the Eagles front office could peg these odds with a MOE of +/- 15% (WARNING: overly simplified statistics).   That means if they estimated Graham had a 90% chance of starting, his true odds of starting were almost definitely between 75-100%.

Immediately we can see an issue.  Even giving Graham incredibly high odds of starting (90%, which is more bullish than any team should be with any players outside the top few picks) and the Eagles a very generous MOE (+/-15%), the resulting range still does not exclude the 81.5% starting odds for the generic position of a first and two thirds (although it is near the bottom of that range).

That means the Eagles really should NOT have been (though I’m sure they were) confident that Graham would be better than just taking whichever DEs were available at #24 and in the third round, and hence, should not have made the trade.

I don’t mean to suggest that trading up is never a good idea, simply that the evaluative bar for whichever prospect is the target must be EXTREMELY high, and much higher than the standard currently being applied by most teams.

My final point:  Teams do not appear to take a probabilistic approach to drafting (which they almost certainly should), and I would guess that they do not actively overlay a margin of error onto their evaluations.  This is very much a “new-school vs. old-school” issue, similar to the statistical revolution in baseball, but IT IS NOT THE SAME.  It is largely a matter of GMs being willing to recognize and account for their own shortcomings and cognitive biases.  The franchises that can apply this will, in the long run, be more successful than those that don’t.  (Looking into which teams might be using this type of strategy will be another day’s post)

Ok, enough talk.  Here is the chart with every round included. I removed the All-Pro and Pro Bowl columns to make it easier to compare.  Dig into it and see what you think.  Later this week we’ll mine it for an “optimal default strategy”.

Screen Shot 2013-01-29 at 10.54.06 AM

Hacking the Draft…4th round breakdown

Today we get the 4th round historical breakdown and, finally, we get some incredibly interesting results.  As a reward for sticking with me through this, I’ll give you a couple takeaways first, which I’ll follow with the chart.

– In the 3rd Round, teams should NOT DRAFT:  Defensive Ends, Defensive Backs, Quarterbacks, Fullbacks.

– Conversely, teams should focus on: Tackles, Running Backs, Tight Ends.

Here is the side-by-side comparison, at this point IGNORE the All-Pro and Pro-Bowl columns:

Screen Shot 2013-01-28 at 10.57.23 AM

Plenty to notice here.

– Most surprising are the position groups I listed above.  From 1999-2011, 3rd round DEs, QBs, and FBs were LESS LIKELY to become significant contributors than were 4th round picks at the same positions.  (DBs in the 3rd and 4th round were about equal)

– We must also keep the relative value proposition in mind.  Looking at the default NFL Draft Value Chart, an average 3rd round pick is worth TWO 4th round picks.  So let’s game out an example:

Team A wants a DE and is sitting at its pick in the 3rd round.  That team can either select a DE or trade down, picking up two 4th round picks in exchange for the 3rd.  That team can then use BOTH 4th round picks to select two DEs.  Which offers better odds and by how much?

3rd Round DE:  25% chance of a starter (chart above)

Two 4th Round DEs: 48% chance of a starter (.72*.72=.5184 chance of missing both, 1-.5184=.48)

So by making the trade, the team has nearly DOUBLED its chances of finding a starting caliber DE.

– Also notice that our 2nd round breakdown showed that DEs chosen in that round have a 36% chance of starting.  Here, the value proposition looks incredible.  According to the Value Chart, an average 2nd round pick is worth nearly 6 4th round picks!  Obviously it’s almost impossible to make that trade (no team has six 4th round picks in the same year), but there appear to be severe inefficiencies in the draft value chart.

– The Eagles, over that time-frame, used three 3rd round picks on DEs…

– The Eagles, over that time-frame, used two 3rd round picks on DBs…

– The Eagles, over that time-frame, had 12 TOTAL 3rd round picks.  They used nearly half of them very poorly.  (Statistically speaking, not a grade of how those picks actually worked out)

Caveat – This analysis is based on nothing but the overall odds of each position groups success.  I did not control for the fact that different teams had different numbers of picks.  So it’s possible that (if drafting has a lot of skill) bad drafting teams had more 3rd round picks, skewing the results.  We’ll get to the skill aspect a little later, but I am very skeptical that it has resulted in any significant skew to these results.

Tomorrow, I’ll show rounds 5-7 and then we’ll start putting together an “ideal” draft strategy.

More on Kick Returns

GUEST POST (Jared):

This one is shorter and just as interesting, I promise.

In response to a comment on yesterday’s post, I took a deeper look at the stats to see which teams were best at kick returns.

Remember, we looked specifically at ‘touchback-eligible’ returns, meaning kicks that traveled into the end zone and were brought out.  We examined these situations because they are instances where returners have to make a choice on what to do.  Our initial analysis of this past year provided a couple of insights.

–        Kick returners have a good sense of when to run the ball out of the end zone, providing their teams, on average, better field position than just taking a touchback.  This persists even on kicks landing deep in the end zone, and even when adjusting for the risk of turnovers (but not injuries).  Therefore, players returning kicks deep in their own end zone are, in fact, probably making the right decision.

–        However, the Eagles performed both significantly worse than average and significantly worse than if they had just accepted a touchback every time.  This raises questions as to why (Boykin’s decision making, coaching, talent, etc.).

But, another question came up.  How much better are the best teams at making these decisions?  The graph below is a repeat of one of our initial graphs, but with all NFL teams included alongside the Eagles and the NFL average.

Screen Shot 2013-01-25 at 11.12.45 AM

The best teams, the Jets, Broncos, and Vikings, averaged over 0.80 Expected Points, significantly higher than both the NFL average of 0.45 and the touchback value of 0.34.

When we look at the return distribution for these successful teams, we can see why this is the case and why their Expected Points are so much higher than the Eagles.

Screen Shot 2013-01-25 at 11.12.53 AM

It may be hard to see on the page, but notice all the kick returns beyond the 30 yard line?

The Jets, Broncos, and Vikings all have a good chunk of returns that go farther (even some touchdowns between then) than the 30.

You’ll notice that the Eagles have none.

Therein lies the difference.  Kickoff returns can have a decent degree of variance, and the overall performance of your return game hinges on the idea that you’ll bust some long returns over the course of the season.

The best teams do that more often, and this year, the Eagles never did.

But the results here got me thinking again (they tend to do that).  If the Vikings, Broncos, Jets, or other teams are so good at returning kicks, shouldn’t they be returning them more often?  And shouldn’t teams with poorly performing special teams take a knee more often?

If teams are behaving logically, we’d expect to see a relationship between return effectiveness and return percentage.

So what do we see?

Screen Shot 2013-01-25 at 11.13.00 AM

Looks like a relationship to me.

Generally speaking, the better you are at returning kicks, the more often you do it!  (I guess the reverse causality is also possible, but that seems much less likely).

We don’t see all that many weird looking outliers here, although a couple of cases are circled that are worth mentioning.

At first glance, it looks like several teams should be returning the ball more often.  The Jets, Vikings, Colts, and Broncos.  Are there reasonable explanations for why these teams didn’t return more kicks?

With the Broncos, you may have already guessed what’s at work.  Elevation.

Unfortunately, there are a lot of kickoff instances that are only listed in the Play by Play as ‘touchback’ without detail on how far the ball traveled.  I’d infer that most of these are kicks in Denver that simply are put out the back of the end zone given the high altitude.  It’s a shame, because it looks like Denver is pretty good at returning kicks.

The Colts also appear to have some explaining to do.  With such a high Expected Points average, why wouldn’t they return the ball more?  Looking at the data, it seems like they’ve rotated kick returners.  Earlier on in the year, through week 12, they had five different returners who combined to average just better than a touchback in terms of Expected Points.

But for the last few weeks of the season, Deji Karim took over and broke a number of long returns including a 101 yard TD against the Houston Texans.  Their boost came late in the year, and they didn’t have enough time to start moving their return %.

I thought the Vikings case would be easily explained by Percy Harvin getting injured, as he’s a fairly dynamic kick returner.  However, the team’s touchback % on eligible kicks didn’t change after he left the lineup and his replacement also did an above average job.  Maybe they should’ve just returned more (unless they wanted Adrian Peterson to have as long a field as possible!)

The last one I spent some time investigating was the 49ers.  They returned far and away the most touchback-eligible kickoffs, but with roughly average results.  What gives?

I assumed it was a combination of Ted Ginn and Kyle Williams just returning everything in sight.  But even when Kendall Hunter or LaMichael James returns, they don’t willingly take touchbacks frequently.

Jim Harbaugh has a rep as a great coach, with a keen eye towards in-game decision-making.  It wouldn’t surprise me to learn that he’s thought about this issue and for whatever reason has emphasized running kicks out of the end zone all the time.  The team is above average at doing so, and does significantly outpace taking a knee every time.  But I have to think there’s more at work there for a team to run kicks out of the end zone over 75% of the time.

Next up we’ll return to our historical draft breakdown, this time putting every round together (once I figure out the best way to display it all on one graphic).

Examining Kick Returns (The league is good…the Eagles bad…very bad.)

Guest Post (Jared):

WARNING: This is a long one, so wait until you’ve got more than a couple minutes.  Or, if you’re struggling to kill time at work, you’re welcome.

As everyone knows, this year the NFL altered its kickoff rules, with the goal of enhancing player safety (and looking past the obvious contradiction with a game that emphasizes hitting people).  As it was explained, kickoffs are a type play uniquely suited to injuries, as you essentially take two full teams of players and have them run at each other with a huge head start to build up speed.  Concussions galore (remember Jason Short?)

That general conversation got me thinking about kickoffs more generally.  Simply put:

Does returning a kick make sense?

When you receive a kickoff, there are really on 4 potential outcomes, only one of which involves any decision making:

1 – It’s an onsides kick and the kicking team is trying to recover it…let’s ignore these

2 – The kick goes out of bounds, incurring a penalty, or through the back of the end zone for a touchback…let’s ignore these too

3 – The kick is fielded short of the team’s end zone, and must be returned (you could conceivably take a knee, but that obviously not be the optimal decision).

4 – The kick is fielded in the team’s end zone, and is either downed for a touchback or returned

For this discussion, we’ll focus on number 4, a returner taking the ball out of the end zone.

I felt like there were lots of instances over this past season where a returner would field the ball deep in their end zone and bring it out, only to be stopped short of the 20 yard line (the spot they’d reach with a touchback).

In light of that, I wanted to take a look at the risk-reward trade-off involved in returning kicks out of the end zone.

Sure, a kick return has a small chance of scoring a touchdown, or providing the team with dramatically improved field position (I know that’s hard for Eagles fans to imagine, but I swear it’s possible.)

However, returns also expose teams to a couple additional risks (besides not reaching the 20).  The first is a turnover, and a hugely damaging one at that (immediately gives the ball to the other team, who likely just scored, in your territory.)  The other, less quantifiable, risk is that the team will sustain an injury.  These may occur when the kick returner takes the ball out of the end zone, but not on a touchback, and as such should be considered by whoever is making the decision to return the kick.

So…Do NFL return men suffer from an incentive problem that causes them to behave in a way that reduces the chances of their team winning?

As a theory, it made sense to me.  I assume NFL kick returners can maximize their income by scoring more touchdowns (contract incentives can be based on this very metric), whereas no one gets incentivized to take more touchbacks, even if a touchback is a safer decision.  So it wouldn’t surprise me to see kick returners taking the ball out more than they should, to try and create the big plays that get them noticed and get them paid.

However, nice theory or not, we needed to actually gather some evidence to see if it’s true (or if when I’m yelling at returners to take a knee, I should probably just keep my mouth shut)

METHODOLOGY

I gathered play-by-play data from this past season (although somehow Week 1 got cut out, so it’s just Weeks 2 through 17).  That started me off with over 2,000 kickoffs from across the league (excluding onsides and squib kicks).

I then filtered out any kicks that didn’t make it into the end zone (But since the NFL moved the kicking location from the 30 to the 35, there weren’t as many of those as in years past).

Now, of the remaining kicks, more than half of them were downed for touchbacks (or the kick went out the back of the end zone, which I couldn’t completely control for given the data).

That left me with over 900 instances where a kick returner had the chance to decide whether or not to bring the ball out of the end zone and decided to go for it.

So, all that was left was to figure out whether they made the right choice or not (with one key caveat I’ll describe later)

To do that, I used what football analysts have termed Expected Points (http://www.advancednflstats.com/2010/01/expected-points-ep-and-expected-points.html)

The included link explains the concept much more effectively than I can, but Expected Points is related to the idea that field position matters.  Having the ball on your own 1-yard line is much worse than having it at the 50, right?  Well, Expected Points attempts to quantify exactly how much more or less valuable a particular spot on the field is (with additional complexity for down and distance).

For example, having the ball in a first and ten situation at midfield is worth 2 expected points.  If your team starts in that scenario, in general, you can expect an advantage of 2 points over your opponent.   Having the ball in a first and ten on your opponents’ 10-yard line is worth an expected 4.7 point advantage, which makes intuitive sense.  The closer you are to the goal line, the more expected points that situation is worth.  All values taken from Brian Burke’s model, which he graciously has shared.

On kickoffs, it’s pretty straightforward, because every kickoff will result with one team getting the ball in a first and ten situation.

Now, the model I used for my Expected Points estimates the value of a first and ten at your own 20-yard line (the situation in a touchback), to be worth approximately 0.34 points.  That may not seem like very much, but remember, 80 yards on a football field is a long way to go.

With that as our baseline, we can take all the kicks returned and measure the expected points of the results.  We also need to be careful of turnovers, because a turnover not only costs you the expected points from your possession, it also provides the opponent with more expected points!

But before we go there, I did mention something about a caveat to this analysis.

Here’s the issue, there’s obviously a bit of bias inherent in this sample.  Kick returners, assuming they are well-trained and skilled (basically, not Reno Mahe) should be able to recognize good opportunities to return kicks.  We should hope that returners can understand good blocking vs. back blocking and know when to take a knee.

If that were the case (and if my theory about greedy return men is wrong), then we’d expect to see returned kicks having a higher expected points value.  Otherwise either the returners are making sub-optimal decisions related to winning the game, or they can’t read their blocking well.

So what is it???

Screen Shot 2013-01-24 at 9.44.52 AM

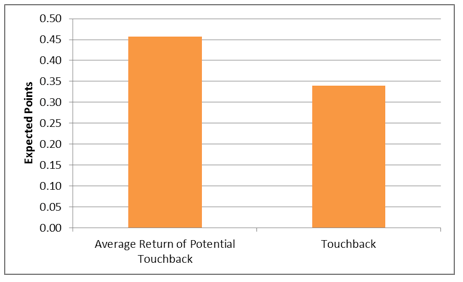
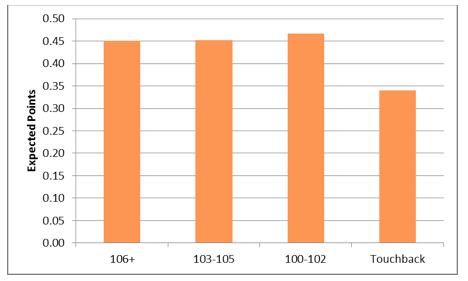
Returns brought out of the end zone are better, providing 0.46 expected points rather than a touchback of 0.34 (sample is over 900 kicks returned).

This implies that returners actually know what they’re doing, and that they recognize when to bring the kicks out vs. when to take a knee.  The incentives are not as misaligned as I theorized.

I also looked a little deeper; to see whether kicks farther into the end zone (like 6-9 yards deep) were any different.

Screen Shot 2013-01-24 at 9.45.43 AM

Nope, nothing particularly different about them, although the shorter the kick, the better the starting field position when it is returned.  But at least based on the data, it seems like returners are actually making the right return decisions.

But wait, there’s just one other thing.

A lot of this perception comes from the games I’ve watched this year.  And it just so happens that most of the games I watched featured the Eagles.  So what happens when we look at just THEIR performance (ranked near the bottom of the league in average kick return yards)?

Screen Shot 2013-01-24 at 9.46.13 AM

Oh dear.

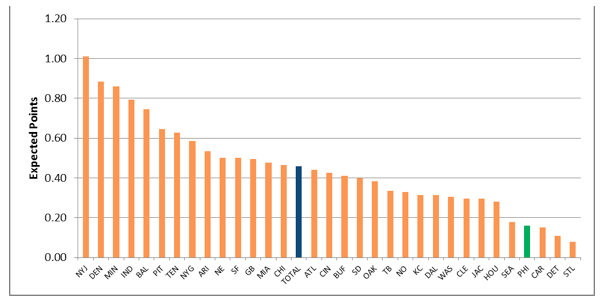
When the Eagles returned kicks this year, and specifically brought the ball out of the end zone, they created an average of 0.16 expected points, significantly worse than simply taking a touchback.  Now, a good portion of this score is skewed by one specific play, namely, Brandon Boykin fumbling a kick return against Carolina in week 12.  But even when you remove that turnover, the results are still worse than if they had simply taken a knee every time.

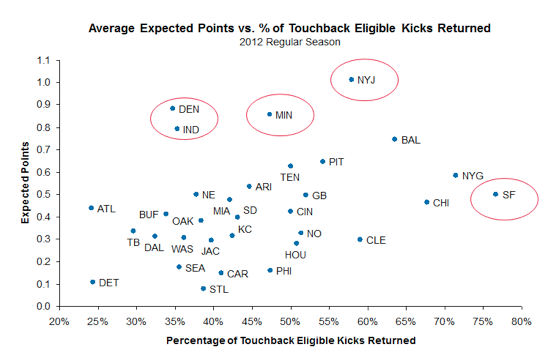
The problem becomes even easier to spot if we plot the results of Eagles ‘touchback-eligible’ returns against those of the entire league.

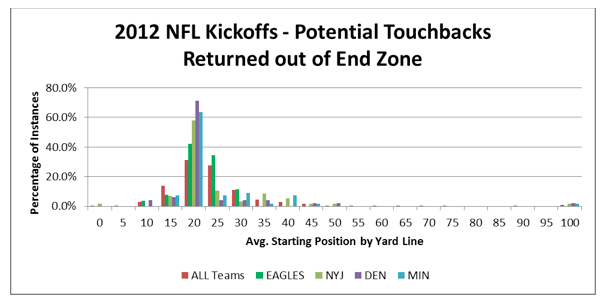
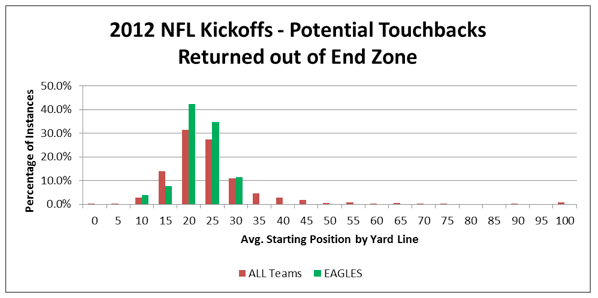
The chart below illustrates the average starting position following kicks into the end zone which were returned, grouped in five yard increments (for example the 45 bin is for all kicks returned between the 41 and the 45 yard line…the 100 bin represents touchdowns)

Screen Shot 2013-01-24 at 9.46.47 AM

See how the Eagles have absolutely no ‘touchback-eligible’ returns beyond the 30-yard line (I excluded Boykin’s fumble, which to his credit, was almost in Carolina territory at the time)?

What the team managed to do this year was take a higher-risk, higher-reward scenario, returning potential touchbacks out of the end zone, and collect exactly zero rewards!  They would’ve been better off taking a knee on average (note: this assumes your offense is better than your special teams, perhaps a dubious assertion).

It’s hard exactly to know where the blame lies in this situation.  Does it rest with the now departed special teams coach Bobby Abril (who, if everyone remembers, was billed as a ‘guru’ level hire when he was brought in from Buffalo)?

Does it lie with Boykin, a rookie kick returner who may have had trouble reading his blocks?

Does it like with Howie Roseman and the administration for an overall lack of depth that kept the Eagles from having a solid set of special teams players?

Maybe a combination of all of the above? (Probably)

The major takeaways from the analysis point to a few things:

– NFL kick returners know what they’re doing, and appear to have a good sense of when to bring the ball out of the end zone, even after accounting for potential turnovers.

– However, the Eagles would’ve been better off taking a knee every time the kick fell in the end zone.  The team was SIGNIFICANTLY worse than the rest of the league.  This is an underrated weakness of the team and, if it’s addressed, could help the Eagles rebound quickly.

– If the NFL really wanted to limit kick returns, and I’m not sure it did, it probably should have move the touchback spot to beyond the 20-yard line.  (To eliminate returns completely, which wasn’t the goal, the league would want to see the Expected Points value of a touchback equal or greater than that of a return in the first chart above.)

Draft Breakdown: 3rd Round (1999-2011)

Continuing our draft breakdown, here is the 3rd round.

Quick reminder:  To count as a starter, a player must have either started for 5 seasons or, if they haven’t been in the league that long, started for at least half of their career.  Not a bulletproof method (doesn’t account for the quality of the starters), but good enough to be informative.

Also, I’ve added rows for FBs and Punters, since there were a few of them drafted in this round.  Players and stats are from Pro-football-reference.com.

Here is the 3rd round chart (side-by-side with the 2nd round chart):

Screen Shot 2013-01-23 at 5.01.18 PM

– Notice that Tackles and Centers are still at or above 50% starters, compared to 70% for T/Cs taken in the 2nd round.

– The biggest decline was among DBs, with 20% of 3rd rounders starting compared to 51% for those drafted in the 2nd round.

– There was very little difference between 2nd round TEs (5/15/55) and 3rd round TEs (3/10/48).

– Less than 1 in 5 WRs taken ended up a starter.

Just a few more round to go, then I’ll try to put a graph together that lets us look at everything at once and identify the optimal rounds for each position.

Roster Breakdown update (Wait…the Falcons lost?)

So obviously I was a little distracted this morning (largely by CNN, though I’ll refrain from political discussion here.)  The Falcons, it turns out, really did lose that game (I wasn’t just hallucinating).  Sorry for the mix-up.  Here is the 49ers breakdown.  Note: doesn’t change the idea of the post at all, in fact reinforces it.  The 49ers have 7 players starting that they acquired with 1st round picks and only 4 that they drafted with 4th round picks or lower.

Screen Shot 2013-01-22 at 4.46.36 PM

Team Construction: Eagles vs Ravens/Falcons

Now that we know the Super Bowl participants, I thought it might be instructive to examine how each team was constructed and compare it to the Eagles current roster.

I used the depth charts from ESPN for each team, though with the Eagles I put the injured OL and DeSean back in.  Before we pick it apart, here is each starting line-up, with the source of each player listed.  As we’ve discussed, elite players come almost exclusively from the 1st and 2nd round, so I’ve bolded each player that was acquired with either a 1st or 2nd round pick (either through the draft or via trade).

Screen Shot 2013-01-22 at 12.54.46 PM

Screen Shot 2013-01-22 at 12.56.27 PM

Screen Shot 2013-01-22 at 12.57.33 PM

– We can immediately see the importance of hitting on your 1st round draft picks.  The Falcons have 7 starters who were acquired with 1st round picks.  The Ravens have 5.  The Eagles have just 3 4 (Peters should be listed as “Trade (1)”.  Needless to say, this year’s top pick is hugely important .

– The next BIG difference is the number of starters drafted in the 4th round or lower.  The Falcons have just 3 such players, the Ravens just 4 (including undrafted FAs).  The Eagles have 8!  As we’ve seen, late round picks provide depth players, not stars.  On average, these guys should not be starting.  Looking at the Ravens and Falcons starters, they are either high draft picks or free agents.  (Yes, some of the FAs were originally drafted with late round picks, but the idea is the teams only picked these players up after it was clear they were good.)

– This brings me to a big lesson for every fan.  Over the past few years, coming out of training camp, Eagles fans have gotten excited because a late-round pick has made the starting line-up (Matthews, Chaney, Coleman, Harris….)  Let’s stop that nonsense.  From now on I want everyone to try to remember:  If a rookie chosen with a late-round pick is starting out of camp, it’s much more likely that it is a glaring weakness than a “draft steal”.  

– The most unfortunate part of this examination is that it appears as though the Eagles will need at least 2-3 years to put a Super Bowl roster together, and that’s assuming they hit on almost every 1st and 2nd round pick.  Roseman really needs to be as good at talent evaluation as Lurie believes he is, because the Eagles can’t afford to waste any more top picks.

2nd Round breakdown 1999-2011

Last week we looked at the performance of 1st round draft picks made from 1999-2011.  Now let’s take a look at the 2nd round.

I’ve made a slight adjustment, grouping CBs and Ss together as DBs.  I did this because players frequently switch back and forth between these positions, and it’s tough to know what teams were projecting each player to play when they were drafted.

Below is the chart, I’ve placed it beside the 1st round chart to allow for easy comparison.

Screen Shot 2013-01-21 at 3.24.18 PM

Takeaways?

– It should come as no surprise that the % of All-Pros and Pro Bowl players has dropped precipitously.  As I showed in an earlier post, as a general rule, elite NFL players come from the 1st round.  Finding elite talent after that is fairly random.

– Second round LBs have almost the same odds of starting (54%) as do LBs taken in the first round (58%).  This certainly supports the Eagles past philosophy of avoiding LBs early in the draft.  However, it remains to be seen whether that holds past the 2nd round.

– Second round DEs start just 36% of the time, compared to 67% for 1st rounders.  This might be the most surprising result.  It appears as though if you need DE help, you have to get it in the 1st round.

– Conversely,  70% of Tackles taken in the 2nd round ended up as starters.  Additionally, almost the same percentage made a Pro Bowl as those take in the first round.  This would seem to suggest that if you can’t get an Elite OT prospect, likely in the top 10, than it is better to wait and take a T in round 2.

– 2nd round running backs have performed rather poorly.  Just 27% have become starters.  Shady is the exception to what should be a rule against drafting RBs in the 2nd.  RBs also were among the worst performers in the 1st round.

Soon we’ll add the 3rd round, which should allow us to start seeing trends.  Eventually, we’ll have a good idea of what positions the Eagles should target and when in the draft they should take them.  This won’t hold for their top pick, but the mid-late rounds are likely much more luck driven, in which case the team should look to historical data for guidance.