
So now we have relative rankings for all of the top prospects in this year’s draft, but there are a couple of issues with the scores, namely:
– Each player is scored on a different scale (due to positional risk and impact modifiers)
– We can’t compare players from one year to the next, since those modifiers will change as the league changes.
Neither of those presents any problems for what the ranking’s main purpose is, but there is a way to address it, which I will now explain. This will allow us to answer the question of “how good is a prospect?”, rather than just “who is the best prospect?”.
First let’s look at the scales. As I mentioned, each position carries a different maximum score, depending on the amount of inherent risk at that position and its potential impact. Here are the maximum sores by position:

Note that these numbers are rounded for the sake of simplicity. The only surprise for me is at the Safety position, which ranks near the bottom. Basically, this is telling us that:
According to our Risk/Impact measures, the PERFECT QB prospect is better than the PERFECT DE prospect, and so on. Again, the ranking of safeties surprises me, but that’s why I use the data, rather than my own rankings.
Now that we have the maximum scores for each position, we can take another step. That is, we can find divide each player’s individual TPR grade (TPR seems more accurate than PVM at this point) by the total available points at his position. For example:
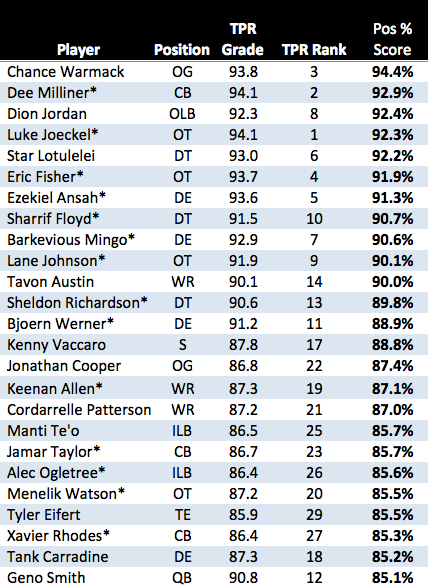
Ziggy Ansah has a TPR grade of 93.6, out of a possible 103 points, giving him a % score of 91.3%.
This method of scoring has a couple of advantages. It solves the problem of comparing prospects from different years while accounting for the fact that the league evolves. It enables us to easily back out the positional impact and risk modifiers, while keeping individual risk. It also is a bit easier to understand, since it’s out of 100 and every player is on the same scale.
By looking at the % score, we get a better question of the ABSOLUTE value of each prospect, rather than just the RELATIVE value (though for the draft’s purposes RELATIVE is far more important).
So now let’s look at the top of the board again, this time with the % scores included. First I’ll show the top players sorted by TPR rank. Then I’ll show them sorted by % score (“Pos % Score”).

This second chart will help to answer the question of “How strong is this draft?”. Unfortunately, I do not have the complete data set for the past several years (can’t find NFP’s ratings). With only 2 sets of ratings, the system loses a fair amount of value. Additionally, I do not have the salary information from 2011-2012, which would result in different positional impact scores. However, we’ll do the best we can with what we have, since I want to show an example of what we’ll be able to do from now on. My guess is that, if included, NFP’s ratings would INCREASE the standard deviation of most players, LOWERING their overall score.
Here are the top 25 picks from last year:

Again, since we don’t have NFP’s ratings, this isn’t an exact apples-to-apples comparison. Regardless, we can see at the top of the board that Andrew Luck was a far better prospect than anyone available this year (not that we didn’t know that).
HOWEVER, after Luck, Griffin, and Kalil, this year’s draft class looks pretty good by comparison. In fact, the average Positional % score of the top 25 players THIS year is slightly above the average for last year, even though last year includes Andrew Luck as a high outlier.
Other notes of interest:
– Dee Milliner appears to be a BETTER prospect than Morris Claiborne was last year. This has been talked about a lot (Milliner not being a “top” CB prospect), but he scores better than Claiborne, who was drafted 6th overall last year. Consequently, it really should be a surprise if Milliner goes top 5 this year, despite not having elite return skills.
– All three top DTs this year (Star, Floyd, and Richardson) score better than Fletcher Cox did last year.
– Ryan Tannehill would indeed be the top QB prospect if he was in this year’s draft.
– Andrew Luck is as close to a perfect prospect as we are ever likely to see.
– RG3 was a better QB prospect than Chance Warmack is a G prospect.
Tomorrow we’ll take a look at the overall rankings and next week I’ll see if I can do some side-by-side big board comparisons so we can see where guys like Kiper diverge from our board.
