Final Fourth Down Thoughts

I hope you all enjoyed the 4th down series.  Thanks again to Jared for doing the research.  Today I wanted to give a few thoughts of my own about the data and its implementation.  (Go read if you haven’t yet, or see the 4th Down tab above for the strategy chart).

It will surprise nobody that I come down on the side of being more aggressive.  The simple fact is that Coaches have been PROVEN to make sub-optimal decisions in certain situations.  While we don’t know for sure why this happens, I agree with Jared that the most likely reason is essentially “groupthink” or a “herd mentality” along with slightly misaligned incentives.

The coach is incentivized to KEEP HIS JOB, not to win.  Normally those things go hand in hand, and it’s very difficult to keep your job if you don’t win.  However, in certain game situations (for example when a team is losing by a lot) coaches clearly make decisions that aren’t aimed at maximizing the odds of winning, like kicking field goals to minimize the margin of loss.  Additionally, the “optimal” decision for coaches is NOT “whatever provides the greatest chance to win”.  It’s more complicated than that.

The “optimal” decision, given the coach’s incentives, is one that achieves TWO goals; win the game, AND minimize criticism of said coach.

Looking at the results, I do not believe all of these coaches are ignorant of the statistically “optimal” decisions.  Some likely are, but given the amount of money at stake and the number of very smart people in league front offices, you can be sure at least a few coaches realize what they’re missing.

The upshot is that this represents a potentially large INEFFICIENCY in the way the game is currently played.  Some day a coach will take advantage of it.  However, note that just because you play the odds correctly doesn’t mean you’ll be rewarded.  This may be another reason for coaches’ reticence.   This “aggressive” strategy WILL WORK, but not every time (as several commenters have noted).  The benefits will only be clear after a LONG time.  Most coaches don’t have the job security to wait that long while being criticized by beat writers for whom anything with a decimal is considered “analytics”.

While I hope (and expect) Chip Kelly to be among the more aggressive coaches in the league, I think it’s EXTREMELY unlikely that he makes a significant departure from what we see now.  At the end of the day, Chip wants to keep his job.  Unfortunately, such incentive misalignment, however slight, inhibits the pace of innovation in the sport (as it does in many industries).

I will certainly keep an eye on Chip’s 4th down strategy and we’ll discuss it here during the season.

I’d also like to address the points made by a few commenters about the overall utility of something like the 4th Down Strategy Chart.

– First, as explained in the first post, each team would, in practice, adjust the chart to account for the relative strength of the opposing defense.  This is not a one-size-fits-all chart.  However, given the HORRIBLE success rates, its pretty clear that team-to-team differences are not accounting for the overall results.

– I would not, though, blindly follow that chart.  The research explicitly excludes end of half and end of game situations.  TIME REMAINING becomes a huge factor in those cases, completely altering optimal strategy.

– I would, however, ALMOST NEVER PUNT with less than 2 yards to gain on 4th down.  It is extremely difficult for a defense to stop the offense from gaining just 1 yard.  I get the sense that many people don’t realize just how small a distance that is.  Today’s homework is to grab a ruler and measure out three feet (a yard).

Also, let’s attack this psychologically.  Think back to last season or picture yourself during a game. Your defense has just forced the offense into 4th and 1.  Are you hoping for a punt? Or are you hoping the offense goes for it, so that your team can stop it and gain “momentum”?

I don’t care where on the field that situation takes place, most people are hoping for a punt (as is the defense!).

In general, if you (as an offense) are doing things the defense WANTS YOU TO DO, you’re doing it wrong!

Several people have mentioned the “momentum” surrendered by going for it on fourth down and not converting, and while I think the concept of “momentum” is largely exaggerated (though not nonexistent), you must also factor in the demoralizing effect that converting has on the opposing defense.

– Even on your own 1 yard line, I’d strongly consider going for it on 4th and 1.  The median NET punting average for the league last year was approximately 40 yards.  Using this number tells us that if you punt from your own goal line, you can expect the other team to start its possession around the 40 yard line.  For some teams, that’s already in field goal range.  For everyone else, it’s just a few yards outside.

So, if you punt from your own goal line you are essentially giving the other team 3 points, with the potential for 7.  If you go for it and fail, in all likelihood you are giving the other team 7 points.  However, if you go for it, you have decent odds of converting, meaning you’ve now add the possibility of scoring 7, scoring 3, and allowing 0 points to the situation.

At a high level, going for it sounds like the better option to me.  Now that I have last seasons play-by-play data (procured last weekend), I will take a look and see if that’s actually the case.  Our 4th Down Chart suggests it is.

– I would ALMOST NEVER punt after crossing midfield. Unless it’s a late-game situation or there are a large number of yards to gain (8-9+), IT DOESNT MAKE ANY SENSE!.  You’re already passed midfield, meaning you’re not guaranteeing the other team any point if you don’t convert.  This is where I expect Chip to be aggressive.  It’s a more “defensible” decision and less likely to immediately back-fire.  That means the reputational risk is minimized, allowing the coach to weigh the “win the game” side of his incentives more strongly.

– Lastly, I completely agree with the chart regarding 4th and 4 or less yards to go situations in field goal range.  Kicking a field goal when you’ve got 4th and 1 is ridiculous (unless its late in the game or time’s running out in the first half).  It’s 1 yard, go get it.  It’s the statistically optimal decision, and 7 points is a LOT more impactful than 3.  For those of you who buy into the “momentum” game, how much does 3 points get you?  Close to none… Kicking a field goal with less than 4 yards to gain is a gutless (and stupid) decision.

That’s all for now.  I’ll be on vacation, starting tomorrow and running through next week.  So probably no posting.  I encourage you to explore the archives though, I’ve tried to make it as easy as possible by giving you tools and shortcuts on the sidebar.

4th Down Decisions: Part 3 – Which Coaches are the Worst/Best?

Time for the final part of our 4th Down Decision series.  Today we look at individual coaches.  Again, you can follow Jared at @jaredscohen.

Part 3

Decisions by Coach

Now we’re getting into some fun stuff.  Which coaches have the highest pass rate?  We’ve already established that as a whole, coaches are far too conservative.  But are there any who appear to ‘get it’ more than their peers?

Like Moneyball, have any of them figured out that an overlooked (and more aggressive) approach might lead to better performance and more wins?

Let’s take a look.  Below is a table of all the NFL coaches and their 2012 regular reason optimal decision percentage:

Screen Shot 2013-05-22 at 10.42.08 AM

Or, for a more interesting look, click this graphic:

Screen Shot 2013-05-22 at 11.06.07 AM

Now, I know what you’re going to say.

Norv Turner???

Ron Rivera???

Marvin Lewis???

Not exactly a murderer’s row of coaching legends (Andy Reid’s up there too, by the way).        And some of the coaches at the very bottom.  The Seahawks? Packers? Falcons?  They all had good years.

So what’s the deal?  Am I just some crazy idiot from his mom’s basement?

Shockingly, I don’t think so.  I don’t think our data or our conclusions are wrong.  Although when you illustrate it a different way, there are still questions.

Screen Shot 2013-05-22 at 10.43.51 AM

This chart illustrates coaching optimal decision rate (pass rate) against number of regular season wins.  Now, what would be best would probably be point differential or Pythagorean wins or something slightly different, but what’s still interesting is that there appears to be a negative relationship between wins and optimal decision-making.  Finding the correlation gives us a -0.34, so a slight negative relationship.

So, what gives?

Well, first, there’s a question of causality.  Does this data mean that making the ‘optimal’ decisions actually prevents you from winning more games???  Should everyone just punt the living daylights out of the ball on every fourth down?  Well, at least kickers and punters would be happy.

One could interpret it that way, but I think that would be wrong.  I think anyone who thinks that’s the case has actually got their causality backwards.

What I think is a far more likely scenario, is that the worse a team is, the more often it’s playing from behind.  And I think teams who are behind and trying to come back are often more aggressive.  That aggression helps those teams to make ‘more optimal’ decisions during games.  But unfortunately, those teams are behind on the scoreboard for a reason, and most of the time, they lose.

I think the causality works the other way.  Poorer teams are more frequently losing, and therefore more focused on maximizing their total points (e.g., making a comeback).  So they make more optimal decisions.  The teams that are ahead most of the time are more likely to play conservative to hold their lead, so their decisions may be sub-optimal.

I tried to adjust for this by removing plays late in the 2nd/4th quarters and when the score was out of hand, but maybe that wasn’t enough.

Because while I’d like to give Norv and the other guys credit where it’s due, I have to think it’s largely driven by circumstances (but would love to hear other theories as well)

There’s also a way we can check for this.

Decisions by scoring differential 

If we take a look at optimal decision rate based on what the score is, we can see if all coaches behave differently when their team is behind and trying to come back.

If the hypothesis is true, that coaches make ‘more optimal’ decisions when they’re trailing, then we’ll see that in the data, and that could explain why losing coaches (or in Norv’s case, fired coaches) have much higher optimal decision rates.

Screen Shot 2013-05-22 at 10.46.45 AM

Hmmm…

When coaches are behind, they make more optimal decisions roughly 10% more than when they’re ahead.  And in the fourth quarter, that gap is even bigger.

Looks like we may have an answer.  Or at least some indication that when you’re behind in a game, you make better calls.

The optimal decisions themselves are more aggressive than most coaches in the NFL.  Teams that are behind are often more aggressive to catch up.  Therefore, teams who are behind more often (and lose more often) will naturally make more ‘optimal’ decisions.

Makes sense to me, but I was all excited to start the Norv Turner is better than Bill Belichick bandwagon.

I’ll have to put that on hold for now.

Implications

So what have we learned from all this?

We know that coaches are far too conservative, particularly when faced with short yardage situations in opposing territory.  They kick the ball far too often rather than trying to convert.

Our data is pretty clear on this point.  Coaches only make the right call 15% of the time when they’re supposed to be going for a first down, and when they’re in opposing territory, they make the right call less than half the time.

Well, the natural question, is why?

It can’t be a lack of information.  NFL coaches and management have all kinds of data at their disposal (certainly more than I do), and plenty of talented folks.  And it’s not like these ideas haven’t made it into the mainstream.  High school coaches have made news for never punting, and analysts continue to harp on the conservative tendencies at the NFL level.

At the end of the day, I still maintain that it all comes down to risk aversion.  NFL coaches (and most professionals) have one primary goal.  To stay employed.  And taking a strategy that goes against conventional wisdom exposes you to criticism if the outcomes don’t work out.

I read a quote from Mark Cuban not too long ago where he felt the idea that coaches wouldn’t try anything to win games was laughable.  If I remember correctly, he thinking was that professional sports are so competitive and the need to win so great that of course coaches take every opportunity they can to get better. (and in googling around, I can’t seem to find it, so maybe I’m misremembering)

Cuban certainly has more experience in professional sports than I do, but I think at least in the NFL the data clearly suggests that’s not the case.

Coaching at the NFL level is the highest professional position a football coach can ever get.  It typically takes years and years of work in all kinds of low-paying jobs (what does a quality coach even do?) and moving from city to city with the hope of one day snagging one of those 32 openings.

Oh, and once you get one of those slots, you can’t screw up, because you’ve spent your entire life specializing in a sport with a fixed number of teams and exactly one relevant professional league.  You’ve invested your entire career to get to the top of the pyramid, but there’s nowhere to go but down.  You’ve got to stay up there.  It’s not like you can go coach pro baseball.

So with a lack of transferable skills outside of football, and the inability to create a startup NFL franchise to coach, NFL coaches are in something of a bind.  Unless they have bulletproof job security (and in the long-run, no one has that, right Coach Reid?) they have a clear incentive problem to try such an easily observable strategy.

Why?  Because it’s quite possible the outcomes won’t work out, and people will crucify you if they don’t.  See the criticism Belichick got for his 4th down decision against the Colts some years ago.  He made the right decision, but since the outcome didn’t work out, all of a sudden he made a terrible mistake.

It’s the problem of evaluating decision-making skill based on the outcome.  The equivalent would be telling a poker player he screwed up when he got all his money in with the best hand and someone drew a miracle card to beat him.

If you made all the optimal decisions you could make, and let’s say you were running at a 50% pass rate before, you might do something differently on ~30 plays a year.

Some of those plays might work, but some might not, and the ones people will focus on will be the ones in the situations of highest leverage where the outcome of the game hangs in the balance.

Now, I think making more ‘optimal’ decisions could swing a game or two a year in your favor, but it could also swing a game or two against you (like Belichick and the Colts).  When faced with that possibility, it’s no surprise coaches aren’t chomping at the bit to test out the theory.

For a coach to successfully try this (and it’ll only take one to succeed before others join), I would argue one of three scenarios needs to happen:

–        An edict needs to come down from the owner themselves, mandating the change to football strategy (of course, what kind of coach would want to be in that kind of situation?)  The most likely suspects would be new analytically inclined owners like the Kahn family in Jacksonville, or owners that like to involve themselves in football operations (Jerry Jones, Dan Snyder, the late Al Davis)

–        A coach fresh off a super bowl win uses the capital/credibility from his victory to test it out (you could imagine Belichick doing this, maybe Sean Payton still has enough cred, but I think you pretty much need to be a Harbaugh)

–        A brand new coach in the first year of a contract just let’s it rip and goes for it, putting their NFL credibility at risk because they at least could always go back to college

If you think I’m suggesting Chip Kelly go for it in his first year with the Eagles.  You’d be absolutely correct.

4th Down Decisions: Part 2 – How often do NFL Coaches make the right call?

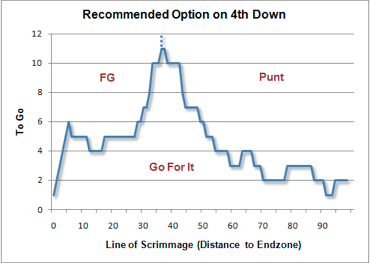
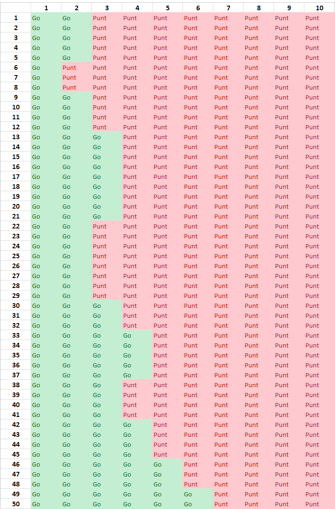
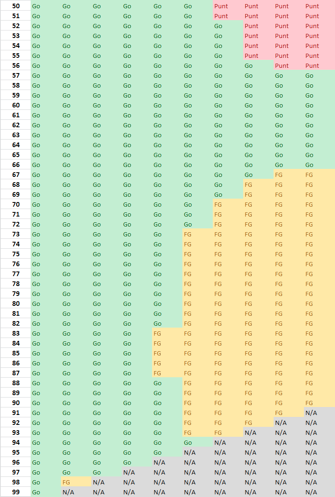
If you missed part one (posted yesterday), I encourage you to read it before moving to today’s continuation.  At the end of yesterday’s post, we arrived at a default 4th Down Strategy chart, essentially a cheat sheet that tells coaches when to go for it and when to punt/kick a FG.  For future reference, I have added the chart as a permanent fixture that can be accessed through one of the menu tabs at the top of the site.  That should make watching the games more fun (or frustrating since you’ll know in real-time when bad decisions are being made).

Today, we move to grading.  Using that chart, how do NFL Coaches perform?  As I mentioned yesterday, this research was done by Jared Cohen, you can follow him on twitter at @jaredscohen.

Fair warning, this is a very detailed analysis (more of a research project) and therefore is longer than the typical blog post.  Please read it when you have some time.  If that’s not possible, feel free to skip to the charts.

Part 2

Methodology

To examine 4th down coaching decisions, I took the following steps.

  1. Download a comprehensive set of all fourth down plays from the 2012 regular season, including a set of key variables I could track and control for, including:
    1. Distance to go for a first down/touchdown
    2. Quarter and clock time of the play (e.g., Q1, 14:30)
    3. Field position (e.g., own 35 yard line)
    4. Scoring margin (e.g., team up by 3 points)
  2. Each play was segmented by the choice of its coach as either a punt, FG attempt, or conversion attempt (by rush or pass)
  3. Based on the distance for conversion and field position, I compared the fourth down play call to the optimal strategy matrix (the strategy card), to see what the ‘right’ choice would be
  4. A play call in which the coach made the optimal decision was termed a ‘Pass’, while a play call that was not (e.g., punting instead of aiming to convert 4th down) was termed a ‘Fail’

Pretty simple right?

Now, before getting to any data, I should also note that I excluded a number of specific plays, for reasons which I’ll explain.  Remember, the goal of the analysis is to determine whether coaching decisions are optimal under normal circumstances.  The key word here is normal.

–        If  a team was either leading or trailing by more than 14 points (two touchdowns), we excluded the decisions, reasoning that coaches would be making decisions differently than normal behavior (e.g., trying to catch up)

–        If the distance required was longer than 10 yards (e.g., 4th and 12 yards to go), I excluded it.  I did this largely because those situations usually aren’t decisions for the coach.  It’s a pretty clear field goal attempt or punt depending on where you are, and my major area of focus was on situations where a coach could decide to go for it

–        Plays were also excluded if they occurred in the last 2 minutes of the 2nd quarter or the last 5 minutes of the 4th quarter, as coaching behavior will also change significantly.  In the 2nd quarter, it’s because a team can’t maintain possession.  In the 4th quarter, it’s because the game is ending and teams will no longer be trying to maximize their total points, they’ll be more focused on gaining/maintaining a lead.

So while the aforementioned decisions could be interesting, they were in situations which are inherently not-normal.  The main goal is to see what coaches do in a typical situation.  Even after subtracting all these conditions, we have over 2,100 fourth down calls to evaluate.  That should be plenty.

So what did we see?

Results

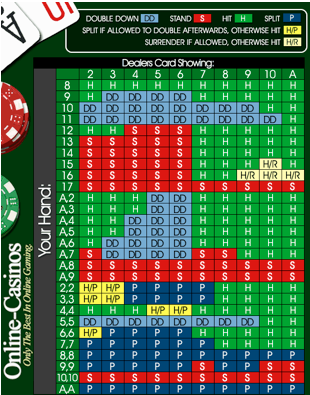
We saw a pretty large number of failures.  I’d never want to play blackjack with these guys.

Below is a chart of the overall grade for NFL coaches’ fourth down decisions, by quarter.

Screen Shot 2013-05-21 at 11.03.56 AM

Yes, you’re reading that right.  When making a decision as to what to do on 4th down, the NFL coaching body as a whole makes the ‘optimal’ decision just slightly over half the time.

Think about that for a minute.  In just about half of all normal 4th down situations, coaches are making decisions that fail to maximize their number of expected points (and we should expect, actual points).

That seems kind of strange.  And yet it also seems completely believable in a league where principally ALL coaches are far too conservative.

But if we spend some more time peeling back this coaching decision onion, we’ll look at a couple more specific cuts of the data that can give us more insight on exactly where these decisions are happening.

This will include:

–        Decisions by optimal decision (what kinds of decisions are the most frequently screwed up)

–        Decisions by field position (how do decisions vary by where you are on the field)

–        Decisions by yards to go (does optimal decision-making vary by distance)

–        Decisions by coach (which coaches appear to have the highest grades)

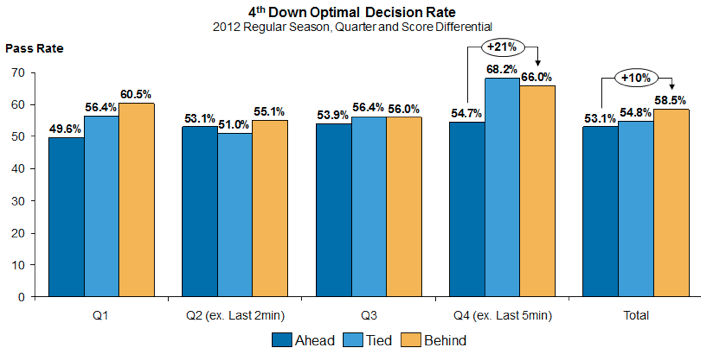
–        Decisions by scoring differential (does decision-making change when you’re ahead/behind)

–        Some fun with coaches (looking at specific game decisions to understand exactly what the implications are)

But before we get to that, there are a few caveats to all this analysis, which I want to make clear.  This is to head off complaints and anti-analytics folks who may have already commented about how I live in my mom’s basement.

  1. This analysis accepts the illustrated decision matrix as optimal, when in reality, that may not hold completely.  It’s based on my interpretation of Brian Burke’s work, which I think is logical and is the leading model that I’ve seen. (I also ran these numbers with an alternative model generated for college football, and the results were consistent with expectations, which means they were much worse as college teams should kick field goals much less frequently than NFL teams do, hash marks and lower kicking talent level etc.)
  2. These optimal decisions do not take into account the talent/performance of the teams in question.  It assumes equal teams are playing each other.  So could a team with a great offense merit different ‘optimal’ choices where they go for it more often?  Of course.  You could also adjust for the defense of your opponent, the skill of your kickers, the opposing punt return man, home field advantage, weather, or any recent lunar eclipse.  This doesn’t have any of those adjustments.
  3. When we get into very granular cuts of data (specifically with coaches), we start to run into potential sample size issues.

All of this is to say that yes, there are concerns with this (or any) piece of analysis.  The goal of this isn’t to find incontrovertible proof, or establish new football dogma, it’s to investigate an issue and understand potential implications.

Analytics can serve as a helpful guide and show you where some issues might be, but I’m not going to pretend the conclusions are absolute.

Decisions by decisions (From the Department of Redundancy Department)

One of the reasons I wanted to look into 4th downs at all was because I’m continually frustrated by coaches kicking field goals or punting.

Coaches are too conservative, just about any research in football has suggested as such, and so when I put this sample together, I wanted to see what my data looked like.

The first thing I did was filter all the fourth downs based on what the ‘optimal decision’ actually was.  Remember, each fourth down, based on our strategy chart, was either ‘Go for it,’ ‘Field Goal,’ or ‘Punt’, based on the action that would maximize your expected points.

So, if we sort our data by what the optimal decision should be, we can see whether NFL coaches are screwing up opportunities to punt, kick field goals, or go for it (hint – my money is on go for it)

Screen Shot 2013-05-21 at 11.07.17 AM

As TMQ’s Gregg Easterbrook would exclaim, ‘Ye gods!’

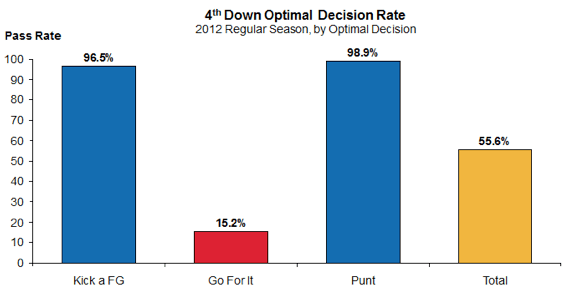
The good news for NFL coaches, is that when they’re supposed to be conservative, they are fantastic about it.  In situations where coaches should be kicking a field goal or punting, they decide to do just that 97% and 99% of the time, respectively.  Amazingly optimal performance!

Of course, such high rates would suggest that our coaches are being extremely conservative, which probably seeps over into fourth downs where they should be trying to convert.  And sure enough, the abysmal 15% pass rate on fourth downs where teams should be going for it is exactly what we’d expect to see from overly conservative managers.

That means that, when faced with a fourth down where the best outcome is to go for it, coaches choose to kick away (punt or FG) about 85% of the time.

Wow.  That seems insanely high.  Making the wrong choice 85% of the time?  I feel like in most jobs those kinds of choices get you fired.  If you make 85% of the burgers wrong at McDonald’s, you’ll most definitely be out of a job.

But to give you a sense of what these failing decisions actually look like, I’ve included a sample from my data set below:Screen Shot 2013-05-21 at 11.08.25 AM

All of these are example ‘fails’ by NFL coaches when the best choice would be to go for a first down.  Some of them seem pretty obvious.  Pete Carroll and the Seahawks had 4th and 2 from the Arizona 9 yard line and elected to kick a field goal (which by the way, they missed).  Some of them, like Dennis Allen opting for a FG from the Chargers 33 on 4th and 6, seem a bit more arguable.

But across all those possible decisions, only 15% of them were the ‘optimal’ choice.  Even with my earlier caveats (not adjusted for team ability or game situation), that still seems like something is systematically wrong with NFL coaches.

Decisions by Field Position

So we know what type of decisions coaches mess up.  They’re too conservative and should be going for it more often.

But let’s keep going, and ask ourselves, are these decisions happening all over the field?  Are they happening more in some areas than others?

I broke down the field into four main zones, and looked at the data that way.

  1. Own territory – Anywhere between your goal line and the 50 yard line
  2. The ‘Maroon Zone’ – A term I borrowed as an homage to TMQ, who has consistently railed on over-conservative coaching for years.  My definition of the Maroon Zone is in opposing territory, but not as far as the opposing 35 yard line.  Too far for a field goal, but surely too close to punt!
  3. FG Range – Any position between the opposing 35 yard line and the opposing 20 yard line.  From the 35 yard line a field goal would be 52 yards, which is more or less the regular range of today’s NFL kickers.  We could split hairs and more it back a few more yards, but this was where I decided to draw the line.
  4. Red Zone – Anywhere from the opposing 20 yard line to the opposing goal line

So I set these bins and filtered the fourth downs.  Where on the field are teams making more suboptimal decisions?

Screen Shot 2013-05-21 at 11.10.24 AM

I should’ve saved the ‘Ye Gods’ for this, huh?

One of the first things that jumps out is that coaches make the most optimal decisions in their own territory.  This makes sense, as we know our coaches are big on punting, and in their own territory, that’s more likely the right decision. (Of course, in an absolute sense, getting only two-thirds of decisions right isn’t exactly fantastic)

The other thing that jumps out is the performance in the Maroon Zone, so opposing territory but a bit too far for most field goals.  Coaches are only making the right decision about 32% of the time here.

Again, some of you might be wondering types of decisions this entails, so I’ve pulled a sampling of Maroon Zone decisions.  This table illustrates eight examples of Maroon Zone decisions from my data set, all from the first quarter of the first week of this season.  It includes the coach, matchup, down and distance, score position, decision (both actual and optimal), and grade.Screen Shot 2013-05-21 at 11.11.35 AM

Let’s take the first row, when Mike Munchak and the Titans, facing a fourth and 1 from the opposing 37 yard line, faced a decision.  You’ll see the Titans elected to pass, and that the optimal decision was to go for it.  For that ‘passing’ decision, they received a ‘1’ grade.

Contrast that with Mike McCarthy and the Packers in their game against the 49ers.  McCarthy had a decision on fourth and 3 from the 49ers 45 yard line.  At the time, the Packers were down three points.  With arguably the best quarterback in football and a stable of talented receivers, did McCarthy choose to go for it?

No, the Packers punted.  Now, you could argue that the 49ers have a great defense and field position is key and blah blah blah.  I’m not saying those arguments have no merit, I’m just saying I would’ve gone for it, and in that situation, going for it is the right move.

You may ask what happened on those plays?  What were the outcomes?  Did the Titans convert the first down?  Did the Packers punt give them great field position?

Well, frankly, I don’t care what happened.  Judging a decision based on the outcomes creates a whole set of biases which I don’t want to influence our analysis.  The goal of this is to understand whether coaches are making the right decisions, not whether those decisions ended up working out.  To me, that means we should keep the outcomes completely outside of this conversation.

Decisions by Yards to Go

So coaches aren’t going for it enough, and although they make the wrong decision most of the time whenever they’re in opposing territory, it’s at its worst when they’re beyond field goal range.

That’s interesting, if not completely unexpected.

But how is their decision-making impacted by the distance required for a first down?  Is there any difference to a coach’s decision making whether its 8 yards to go vs. 3 yards to go?Screen Shot 2013-05-21 at 11.12.39 AM

Again, not a shocking result.

When the optimal decision is a more conservative approach (like punting on a fourth and ten), coaches almost always get it right.

But as the distance to convert shrinks, performance gets remarkably worse, especially around 2-3 yards to go, when coaches are only getting it right one-fifth of the time.

Again, it’s the conservative approach that does them in.  When coaches should be trying for conversions, they’re punting the ball away or attempting a field goal.  What’s interesting is that with only one yard to go, they’re actually a bit better.  I feel like it’s a gap based on aesthetics more than anything else.   One measly yard? We can go get that! The coach may say to himself.  But push it back another three feet and it somehow becomes impossible.

Now we’ve seen just how bad NFL coaches (as a group) are when it comes to optimal 4th down decision-making.  Tomorrow, we’ll look at individual coaches to see who is the best (or least bad as the case may be).  The results are shocking…

4th Down Decisions: Part 1 – Creating an Optimal Strategy Card

Today is the first installment of a series of posts about 4th Down Decision-making in the NFL.  These are going to be a bit long, but extremely interesting for fans interested in the high-level analysis of the game (which should be just about everyone who comes here).

I’ve broken the entire analysis down into 3 parts:

Part 1 (today) will discuss the overall idea behind the analysis and build to a 4th Down Strategy Chart

Part 2 (tomorrow) will use that strategy chart to grade NFL coaches and show us how often the “right” decisions are made

Part 3 (Wednesday) will show the results for individual coaches and discuss potential implications of the entire analysis.

This was authored by Jared Cohen, with limited editing/input from me.  You might remember Jared from his previous posts here, specifically his timely explanation, shortly before the Super Bowl, of why running a kick out from the back of the end zone is usually a GOOD decision.  Of course, soon after that analysis, Jacoby Jones ran a kick out from the back of the end zone in the SB, resulting in a 109 yard touchdown…

Also, by way of qualifications, Jared is a:

– Two-time Jeopardy champion, and the man who brought Family Guy to life in Final Jeopardy.  You can buy his e-book about the whole experience for just $0.99 here.

– MBA from the Booth School of Business at the University of Chicago, now a management consultant at Booz & Co.

– Play-charter for Football Outsiders for the 2012 season

You can follow him on twitter at @jaredscohen.

Part 1

Always double down on eleven.

It’s a rule of thumb any blackjack player will tell you.  Applicable in almost every situation, at any casino, when your cards come up eleven and the dealer isn’t showing an Ace, you double down.  No matter how much you’re betting, no matter how bad your luck has been, no matter which random foreign country your expressionless automaton of a dealer is from, you double down on eleven.

Why?

Because it gives you the best chance at winning.

And how do we know that doubling down gives you the best chance at winning?

Because people have researched it.  People have done their homework, complete with statistics programs, random number generators and complicated looking equations (or as its known in some parts of the country, “witchcraft”)

 They even have a card which tells you what to do.  Since Blackjack is a game with well-defined rules and structure, there can be a clear strategy that, if executed, will help you win as much as possible (or, to be technically accurate, help you lose as little as possible).

Screen Shot 2013-05-20 at 11.34.08 AM

While you don’t have to do what the card tells you, it’s definitely more right than your ‘gut’ instincts or homebrewed system.  It’s based on data.

Yet, some players will insist on hitting their 12 against a dealer 6.  They’ll refuse to double down on 11.  They’ll split 10s!

Simply put, they’re doing it wrong.

So how does this relate to football?  Well, I was wondering if NFL coaches are doing the exact same thing, eschewing data in favor of their own gut.

What I found was a little surprising.

Now, football is a complex game, with a lot of situations and decisions.  For this analysis, I decided to focus on what has long been a frustrating aspect of many Sundays spent with the Red Zone channel…Fourth Downs.

That shouldn’t come as a shock.  Fourth downs are the most direct view into a coach’s risk tolerance and personal philosophy.

And in thinking back to my blackjack discussion, I wondered what NFL coaches would look like if there were an optimal strategy for fourth downs.  There’s already a chart for when you’re supposed to go for a two point conversion.  If there were a basic strategy 4th down card, how would coaches perform when compared them to it?  How close would they be to the best strategy?

That is to say, do these coaches know to double down on eleven? Or are they the guy sitting at the table refusing to split their pair of eights?

In these articles, I’ll describe the methodology behind the analysis, illustrate some results, and discuss some of the implications.

Context and Expected Points

To start things off, I wondered if anyone had already done research into optimal fourth down strategy.  I know lots of smart football fans out there have already spent time on it, so I figured it would already be established in the literature (and would save me the time of having to establish it).

Turns out it has been, and we’ll get into it in some detail, but before we get to that, we need to just establish the foundation for such an optimal strategy chart.  And that means some background in the idea of expected points.

Originally conceived back in the 1980’s, expected points has gained a fair amount of traction with the football analytics community.  Even ESPN uses it.  Here’s a little bit of their explanation, which I’m cribbing because it’s clear.

Based on statistical analysis of 10 years of NFL play-by-play data, ESPN has created a formula that assigns an “expected points” value to the team with the ball at the start of each play based on the game situation. Expected points (EP) accounts for factors such as down, distance to go, field position, home-field advantage and time remaining.

The value it puts out is on a scale from about minus-3 to 7, and it basically represents “which team is likely to score next, and how many points?” It represents the likely points not just on the current drive but also on the next drive or any subsequent drive until the score changes or the half ends. A lower value indicates a more favorable situation for the defense (i.e. fourth-and-20 from your own 1-yard line could be close to minus-3 EP), and a higher value represents a more favorable situation for the offense (i.e. first-and-goal is generally worth 6 EP).

Essentially, expected points is a way to evaluate football situations against each other.  Because each play is based on its situation (what down it is, field position, and how many yards to convert a first down), expected points serves as a normalized metric for the value of possession in any situation.  What’s more, is that after a play, you can compare the expected points values from the old and new situations, and determine how valuable the play was.  Here’s an example from ESPN’s explanation:

From your own 20-yard line, an 8-yard gain on third-and-10 is worth about minus-0.2 EPA because you don’t get a first down; the same 8 yards on third-and-7 is worth 1.4 EPA for converting a long third down and keeping the drive alive. EPA knows that not all yards are created equal.

So, using expected points as our basis, we can compare the best option (what would create the most expected points increase) for any given fourth down situation.  And when I say we, I mean Brian Burke.

Burke has already done a fair amount of research on the optimal fourth down strategy, which I’ve leveraged as the base for this analysis.

Using expected points values and historical data, Burke has done some prior research on what the ‘optimal’ fourth down decision should be (FG, punt, or going for it).  Depending on your field position, and yards to go, he put together a view of what decision would be best for a given fourth down.  His chart of that strategy is below:

Screen Shot 2013-05-20 at 11.40.41 AMDepending on where your given fourth down situation falls, the best option is illustrated here.  For example, if you had a fourth down and two yards to go on your opponent’s 10 yard line, the recommended option would be to go for it.  Alternatively, if you faced  a fourth down and had eight yards to go to convert it from your opponent’s 10 yard line, you should kick a field goal.

Make sense?

This chart can serve as the basis for our basic fourth down strategy chart.

Put another way, based on my rough transcription, it would look something like this.  Apologies for the lack of labels, but:

– The columns show yards to go (so 1 = 4th and 1)

– The rows show yard-line on the field, from your own end zone (so 5 = own 5 yard line, 95 = opponents 5 yard line).

– Together, cell 2 x 2 means shows the correct decision when faced with 4th and 2 from your own 2 yard line.

Screen Shot 2013-05-20 at 11.45.16 AMScreen Shot 2013-05-20 at 11.49.48 AM

Looks just like a blackjack strategy card, doesn’t it? 

Note that there are a few strange suggestions in the card which are most likely just statistical anomalies that will disappear with more data.  The most obvious example of this is cell 2 x 98 (or what to do when faced with a 4th and 2 from the opponents 2 yard line).  That chart says kick the field goal, but it makes very little sense to kick from the 2 yard line while going for it from the 1 and 3-6 yard lines.

Also, in practice, teams could adjust the card each week to account for the relative strength of the opposing defense.  If you’re playing a very weak defense, you’re odds of converting 4th downs goes up, so you’d see a few more Green blocks above.

Now that we have an “optimal strategy”, or at least a “default”, we can compare it to real life decisions and see how often coaches make the right call.  Come back tomorrow for the results in Part 2.

Eagles Offensive Evolution

As you might have expected after Wednesday’s post, I have also put a chart together that illustrates the Eagles Offense’s evolution in personnel over the Andy Reid era.  Rather than doing a pure positional chart like before (I may still put that together for the offense), I decided to illustrate the Top 5 players from each year (by yards from scrimmage).

This gives us a better idea of the general focus of the offense each season, as well as showing the ebb and flow of each player’s career with the Eagles.  Below is the chart.  Please note that the only data included is for years in which the subject player ranked in the top 5 of yards from scrimmage for the Eagles.  So if a player either doesn’t feature on the chart or has a year for which they are listed at 0 yards, it just means they didn’t rank in the top 5 of the team that year, not that they recorded 0 yards that year.  Also, this highlights rushing and receiving yards, so QBs are not represented beyond their rushing contributions.  Click to enlarge.

Screen Shot 2013-05-17 at 10.57.15 AM

I know that’s not the easiest chart to read, so I labeled the major contributors.  In general, as the chart moves from left to right, the legend (right) moves from the bottom to the top.  Additionally, here is the data:Screen Shot 2013-05-17 at 11.03.08 AM

Takeaways:

– Overall, we can see the gradual increase in total yards for the top 5 offensive players.  As I illustrated last week, the Eagles offense improved over Andy Reid’s tenure, and not just as a result of overall league offensive inflation.

– The increase in overall yards coincides with an increase in the % of Total (seen at the bottom of the data table).  This shows how the Eagles offense became more “playmaker” focused.  In Andy Reid’s first few years, the distribution of offensive yards and touches was more widespread than in his later years.  Obviously, the early years’ offenses did not include anywhere near the same level of skill as the later years’.

– Brian Westbrook jumps out immediately, and clearly held the largest non-QB offensive share during the Andy Reid era.  Notably, LeSean McCoy looks like he had the potential to match Westbrook’s contributions, if Andy had continued to coach the team.  It always bothered me that Andy didn’t feature Shady in the same way he did Westbrook.  Part of that is because the Eagles now have DeSean and Maclin, and part is due to the fact the Shady is not as good a receiver as Westbrook was.

However, I would like to see Shady used as a receiver more often, and not just on designed screens or check-downs.

– As I already mentioned, the chart highlights the clear improvement in offensive talent over the course of the Andy Reid era.  The main early contributors were James Thrash, Duce Staley, and Todd Pinkston; the late ones Shady, Jackson, and Maclin, with Westbrook in the middle.

Note though, that the Eagles best years under Reid featured Duce Staley as the biggest offensive weapon (outside of McNabb).

– The chart also illustrates the relative cameos made by random players like Dorsey Levens, Donte Stallworth, Antonio Freeman, Hank Baskett, and Greg Lewis.  Remember them?  They each had at one season in which they were a “top 5” offensive weapon for the Eagles.

– 2008 stands out as a major transition year for the offense;  before then Westbrook was THE weapon, while after marked the fast transition to the current Eagles offensive era.

– At the moment, I expect the Chip Kelly era to bring more equality to the offensive yards distribution.  That’s obviously speculative, but I believe we will see the “Top 5% of total” decline over the next year or two.

Eagles Almanac Pre-orders!

No post today; I’m working on a few much larger things that should be pretty cool/interesting, but they obviously take a lot of time.

One is a series (with a special guest author) I’m going to run on 4th down decision-making, during which we’ll try to come up with a “default 4th down decision chart” that functions like the “Two-Point Conversion Chart” coaches use now.  Early preview: coaches are NOT making the right decisions at a high rate, and the identity of the “best” decision makers will shock you.  Look for that starting Monday.

I’m also working on some more draft research, including a new model focused on where prospects WILL go, rather than where they SHOULD go (which is the TPR system).  That’ll take a little while though.

For now, I’d like to encourage everyone who hasn’t done so already to pre-order their copy of the 2013 Eagles Almanac at this link.  Great cast of writers; great list of topics.  Easily the best Eagles preview you will read.  Just $10 for a digital copy, or $25 for a hard copy.  I’ll have contributions on the QB situation and hopefully an in-depth analytical look at projecting college production to the NFL.  Click through to see the other authors and a taste of what this year’s edition will feature.

Thanks for your support.

-Brent

Roster Evolution of the Eagles Defense

As I illustrated earlier this week, the Eagles’ defense under Andy Reid was MUCH stronger from 2000-2004 than it was thereafter.  As a reminder, here is the team’s Points Allowed performance from 2000-2012.  The “LAVG-PPGA” shows how many FEWER points per game than the league average the Eagles allowed that year.  So for the 2000 season, the Eagles allowed 5.4 points per game less than the league average.  The “Def+%” shows that margin divided by the league average, which gives us the percentage difference (which accounts for the offensive inflation over the years).

Screen Shot 2013-05-15 at 11.50.38 AM

So the question is, what happened after 2004?  While the Jim Johnson effect can be clearly seen after his departure after the 2008 season, that doesn’t explain the team’s performance in 2005 and 2006.

Was this just bad luck?  Something else?

Well to begin to answer that question, I felt like it’d be useful to take a look at how the defensive personnel evolved over time.  To do that, I prepared a graphic that shows the Eagles defensive starters for all even years from 2002-2010 (5 seasons).  Additionally, I listed (in parenthesis) each player’s Approximate Value for that season as defined by Pro-Football-reference.com.  Note that this is a far from perfect measure, especially on the defensive side of the ball, but it gives us a good idea of who the biggest contributors were each year.  Players with an AV of 6 of below are shown as Red.  An AV of 7-9 is Yellow, with 10+ getting green.  For quick reference, the top two circles on each line (2002 and 2004) mark the “peak” era.  Click to enlarge if you can’t read it as is.

Screen Shot 2013-05-15 at 11.48.26 AM

So what can we see?

Unfortunately, it doesn’t present as clear an answer as I had hoped.  However, if you look closely, I think you can begin to see a potential factor; namely, the Elite players.

While I won’t go into overall football philosophy here (that’s its own post), in general, I am of the belief that you SCORE points with scheme, and PREVENT them with talent.

Now that’s an overly simplistic description, and obviously you need talent to score and a good scheme to prevent points, but at a high level, that’s how things shake out (mostly due to the offense’s inherent knowledge advantage, in that they know the play and the defense doesn’t).

How can we apply that here?

Well as you can see, the “peak” Eagles defense’ all included truly Elite player performances.

From 2000-2004, you’ve got Troy Vincent, Hugh Douglas, Brian Dawkins, Lito Sheppard, and Jeremiah Trotter (not shown since his best years came in ODD years) all turning in truly Elite performances (not necessarily every year).  When those players were in their prime, they were easily among the best at their positions in the entire league.

The failure to replace these players with others of similar skill is one of the BIGGEST FAILINGS of the Andy Reid FO regime.

As you can see above, after 2004 (so the bottom three circles on each position line), the best Eagles defenders were Trent Cole, Asante Samuel, Quintin Mikell, and Brian Dawkins (though below his peak).  While each of those players was very good, they really did not come close to matching the peak years of the 2000-2004 players I highlighted above.

So what now?

Well it’s clear the Eagles’ current defense needs more top-end talent.  As of this moment, the only player that looks like he has the ability to become “elite” is Fletcher Cox.  As I just showed, that’s not nearly enough.  Unfortunately, it looks very unlikely that this year’s draft produced any more potential impact players for the defense.  While I admire and support sticking 100% to BPA (my definition, not the NFL’s…see TPR), at some point, the Eagles will have to find impact contributors on defense.  Ideally, next year’s BPA at each spot will be a defensive player.  If not, though, the Eagles will have to move around to ensure that’s the case.

The Best Offenses and Defenses since 2000

Today I’ll continue in the same vein as yesterday’s post, this time broadening our scope to include the entire league, rather than focusing on just the Eagles.

First, however, I have to acknowledge the news yesterday that Donovan McNabb will be retiring as an Eagle in the fall (looks like it will likely happen before the KC game so Andy is there).  Objectively speaking, McNabb was a fantastic QB who every Eagles fan should love.  I’m not going to go through his numbers today, but it’s safe to say he’s one of the more under-appreciated stars of the league, due entirely to the lack of a Super Bowl ring.

The NFL, more than any other league (thought the NBA is close), judges its best players (QBs) almost entirely on Championship performance.  In my opinion, that’s ridiculous; but it is what it is.  If McNabb takes home that SB ring (he was damn close), both he and Andy become true sports royalty in Philadelphia.

Although I typically stay far away from any conspiracy theory, you will never convince me that the Patriots didn’t cheat in the Super Bowl.  While that is a subject for another day, given when/how they were found out and the subsequent destruction of the evidence (shady and inexcusable), there is strong logical support for the Super Bowl cheating theory. If that doesn’t happen, McNabb is a HOFer.

We should all treat him as such anyway.

Back to the stats.

Now let’s take a look back at the league, starting with the 2000 season.  Yesterday, in an effort to discern just how good each Eagles offense and defense was, I measured every team against the rest of the league from that year, presenting the results in a +- % format.

Two caveats before we get to the best defenses.  One, the league averages INCLUDE each subject team; so the historically great teams, in fact, outperformed the league by slightly more than what is shown below.  Two, I did not go through every team’s season to see if they “shut it down” after clinching a playoff berth.  Some likely did, which would have an effect (relatively small) on the subsequent rankings.

Also, what we are looking at here is Points Allowed.  This is a little different from looking at the “best defenses”, so perhaps it’s fairer to say we are ranking the best “team point prevention seasons”.

So which teams had the best point-prevention seasons?  Here is a table of the top 25 since the 2000 season.  Teams highlighted yellow won the Super Bowl.

Screen Shot 2013-05-14 at 11.17.27 AM

The 4th column above “LAVG-PPGA” just shows the point margin for each team above (actually below in this case) the league average.

As we can see, there’s a lot of yellow (SB champs) and a lot of Green (Eagles), but no overlap..

  • The 2000 Baltimore defense, which we all knew was great, was a full 50% better than the rest of the league.  As I mentioned above, if we remove the Ravens from the league average that year, their performance would be even better, breaking the +50% mark.
  • The Buccaneers team that beat the Eagles in the NFC title game was a HISTORICALLY great defensive team.  There was a lot of hand-wringing in Philly after the game about how inept the offense was (particularly the receivers), but the simple fact is, the Eagles ran into a figurative defensive wall.  One almost as strong as that famed Baltimore defense mentioned above.
  • Also of interest is the placement of Green Bay ’10.  While Aaron Rodgers gets a lot of credit (as he should), the strength of that team was really the defense.
  • It might also be strange to see New England featured twice on the list (including the ’03 SB team), but the early Belichick era was really built on that side of the ball.  Notably, despite all their regular season success, the Patriots last SB win came in ’05, during their “defensive” era, as opposed to the “offensive” era we’ve seen from them more recently.  To be fair, the “offensive” Patriots did GET TO the SB twice, losing close games to the Giants in each.

How about the Offenses?

As I did with the defense, here I am looking purely at Points Scored.  The same caveats apply.  The only thing I’ve added is Red highlighting for Super Bowl LOSERS.

Screen Shot 2013-05-14 at 11.37.20 AM

While we didn’t need this table to tell us the 2007 Patriots were a great offense, it really is incredible just how much better than everyone else they were.  Even accounting for points inflation, no team since 2000 (and I’d be surprised if any team in modern history) comes close.  The 2000 Rams were also an amazing offense, 63% better than league average, and yet that team is still 7% below the 2007 Patriots mark.

  • Perhaps most surprising here is the lack of yellow (i.e. Super Bowl Winners).  As I’ve explained before, it is NECESSARY to have an above-average offense if you want to win the Super Bowl.  HOWEVER, a truly GREAT offense guarantees you nothing.  Contrast this chart (1 winner in the top 25) with the Defense chart above (5 winners in the top 25), and it looks like, all other things being equal, having a Great defense trumps having a Great offense.
  • The Eagles, obviously, do not appear on this list.  For all of Andy Reid’s offensive skill (and he has a lot), that never translated to a truly great offense.  Looking at yesterday’s tables, the Eagles never really came that close either.
  • Again, the Patriots “offensive” era shows up a lot here, though it hasn’t translated to more Super Bowl wins.
  • Lastly, there are a couple of surprising teams that people might have forgotten about:

               Kansas City ’02-’04: Trent Green and Priest Holmes

               Oakland ’00: Rich Gannon and Tim Brown

               Minnesota ’09: Favre and AP (Ok, you probably didn’t forget about them)

               Denver ’00: Brian Griese and Mike Anderson (Wow…)

Andy Reid’s Best: Adjusting for League Average

Last week I showed a couple of tables that illustrated the relative performance of each Eagles team under Andy Reid (other than his first year).  To do that, I compared the PPG and Points Allowed Per Game to EVERY other team from the past 10 years.  The results were interesting, and showed that the Eagles typically performed very well in at least one of those categories; but also showed that while offensive performance trended up over time, the defense fell off by a larger amount.

The problem, though, is that the analysis did not take into account the annual league-wide scoring fluctuations, and specifically, the general increase in scoring over the past 13 years.  I’ve done a similar analysis today, but this one shows how each team performed relative to the rest of the league FOR THAT YEAR.

Before I get to the charts, here’s an example of what I did (it’s very simple):

The 2002 Eagles scored 25.9 PPG.  The NFL average that year was 21.7.  

The Eagles scored 4.2 PPG more than the league average or 20% (4.2/21.7).

The tables below will show the % over or under league average for each Eagles team.

First, the Eagles Offense:

Screen Shot 2013-05-13 at 10.37.45 AM

As we can see above, after his first year, Andy Reid’s offense only finished below-average 3 times, with 2012 marking the only really poor performance.  Interestingly, the best offensive years for the Eagles were in 2009 and 2010, when the team was 25% better than the league average.

The 2004 Eagles team, the Super Bowl team, was just 12% better than league average.  However, that team (after clinching) shut it down for the last two games of the season, scoring a combined 17 points in losses against the Rams and Bengals.  If we remove those two games, the 2004 Eagles averaged 26.4 PPG, or 22.5% better than league average.    While that is a very strong performance, it still doesn’t rank better than the ’09 or ’10 teams, and is just above ’02 and ’06 teams.

Taking a step back, we can compare the “Andy Reid Peak” to the rest of his tenure and get an idea of how things changed.  For this, I’m going to ignore last season, since it was a clear outlier.

Andy Reid Peak (’00-’04) – The Offense averaged 2.4 PPG more than the league average.

After Peak (’05-’11) – The Offense averaged 2.8 PPG more than the league average.

Or put differently, during The Peak the offense, on average, was 11% better than league average.  After the Peak, the offense was 13% better than league average.

So over time, the Eagles’ offense got better (which we knew from last week), but by a relatively small margin.

Now let’s look at the defense:

Screen Shot 2013-05-13 at 10.52.08 AM

This table shows a much clearer break between the “peak” and “after-peak”.  Four of Andy Reid’s best defensive performances (and 5 of the top 6) came during the 5 seasons “Peak” stretch.  During this time, the Eagles defense allowed an average of 5.5 FEWER PPG THAN LEAGUE AVERAGE.  That’s a truly amazing run of performance.  On a percentage basis, the team was, on average, 26% better than the league-wide average.

After the peak, the Eagles allowed an average of 0.5 fewer points per game (2%) than the league average, which means the Eagles went from being a historically great defense (from ’00-’04) to being an average one.

Here is a table showing the performance of both the offense and defense side-by-side, and a graph showing the performance of each over time:

Screen Shot 2013-05-13 at 10.58.36 AM

Screen Shot 2013-05-13 at 11.02.24 AM

Here is another chart, which hopefully provides a clear illustration of the overall performance trend for both the offense and defense.

Screen Shot 2013-05-13 at 11.06.44 AM

This chart provides the clearest picture yet of the overall shift in team performance as time passed.  While it’s not as easy to see as I had hoped, the slope of the defensive line (red) is much larger (absolute value) than the offensive line (blue).  That means the team’s offensive gains were MORE than offset by corresponding drops in defensive performance.

Tomorrow I’ll show you how the best offenses and defenses since 2000 and how they stack up when adjusted for league average.  Hint: the 2007 Patriots were OUTRAGEOUSLY good on offense (which we knew), but so were the 2000 Rams (who everyone remembers but forgets just how dominant that offense was).

More on the Eagles “Andy Reid Peak”

UPDATE: For those wondering, next week I’ll post the same stats adjusted by annual league average.  Similar story, but it clears up some of the inflation and year-to-year comparison issues.

First, you’ll notice the site looks a bit different today.  I’ve been meaning to change it for a while; hopefully this is easier to read.  I’m not happy with the entire layout, so you may notice more changes soon.  In any case, if it’s not an improvement, please let me know.

Now then, where were we?

Right, the Andy Reid Peak, which ended after the 2004 season…

Below is a table showing the top 30 best defenses (lowest PPG allowed) in my data set.  Remember, the data set is the last 10 seasons (320 teams) PLUS the 2000-2002 Eagles teams, for a total of 323 teams.  In the table, I’ve highlighted the Eagles in green.  Also, I’ve highlighted Super Bowl Champions in yellow.

Screen Shot 2013-05-10 at 11.34.09 AM

These are, roughly, the top 10% of all defenses.  Note that I have not included the rest of the league for the 2000-2002 seasons (not as easy as you’d think, for reasons I won’t explain here).  If I had, I believe there’d be 5-6 defenses that rank above the 2004 Eagles in this chart (including the outrageous 2000 Ravens, who allowed just 10.3 PPG).

In any case, including those years would actually IMPROVE the Eagles percentile rank here, so the point remains: the biggest strength of the Andy Reid Peak teams was defense.  Jim Johnson was with the team through the 2008 season, so the drop-off after 2004 is not related to coaching.

I’ll go into more detail about the drop-off next week (once I’m finished looking for potential explanations).  Today, though, is just about illustrating how good the Andy Reid Eagles were at their best.

How about offense?

Andy Reid is known as an “offensive” coach, so how was his team’s performance on that side of the ball?

The Eagles’ best offensive performance (PPG) under Reid was actually in 2010 (the Vick outlier season).  That year, the team scored 27.4 PPG, good enough for 27th overall in my data set (92nd Percentile).  Note that this was NOT during the “Andy Reid Peak”.

In fact, the best Andy Reid teams featured relatively average offenses.  Below is a table showing each Eagles team from 2000-2012 (I’m ignoring Year 1 for obvious reasons).  The first column shows that team’s offensive percentile ranking within my data set.  I’ve bolded the “Peak Era” teams.

Screen Shot 2013-05-10 at 12.10.30 PMOverall, Andy’s reputation appears justified.  6 of his 13 teams here finished in the top 25% offensively.  Three more finished better than average.

However, notice that the 2001 Eagles managed to win more games than the 2010 Eagles despite scoring SIX fewer points per game.  That’s a huge difference in performance.  There was some offensive inflation across the league over this time period, but nowhere near enough to account for the degree of change we see above.

I’ll leave it there for today, since I want to focus on the positive.  Next week, we’ll take a closer look at the relative trade-offs Reid appears to have made (sacrificing defense for offense) and if we can learn anything from that about overall team construction (I touched on this in the Necessary Conditions post if you want to get a head start).