Setting Expectations for the Draft

I posted last week about how we can compare this year’s prospect class to previous years and illustrated the system I will use going forward to do that.  However, it occurred to me that it would be of some value to modify the current system so that we do have a true apples-to-apples comparison with previous years.

I’ve done that and will use those results to illustrate the main idea of today’s post: accurately setting expectations for the draft.

Unfortunately, the draft structure lends itself very well to year-to-year comparisons (i.e. looking at the success of previous #4 picks).  However, in reality it doesn’t work like that.  Each draft class is distinct and wholly unrelated to the previous classes, meaning the quality of player available at #4 will differ greatly depending on the year.  But how greatly, and what does that mean for this year?

To answer that question, I first eliminated the NFP ratings from this year’s data (I don’t have it for previous years).  I then added the 2012 and 2010 prospects to the database and ran all the prospects through the same TPR formula.  Note I did not include 2011 because, for some ridiculous reason I can’t imagine, NFL.com’s draft tracker does not work for that year, meaning I don’t have the prospect ratings for the Cam Newton, A.J. Green, Patrick Peterson draft class.

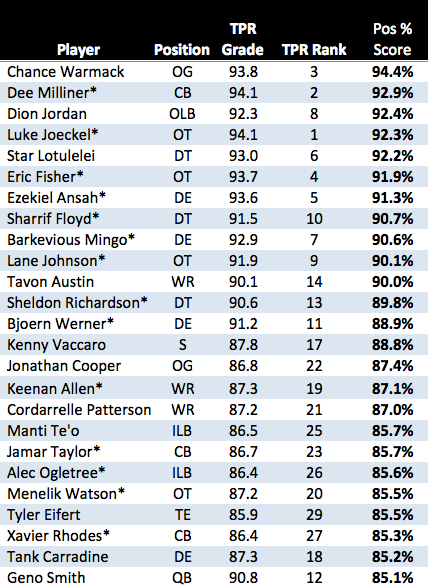
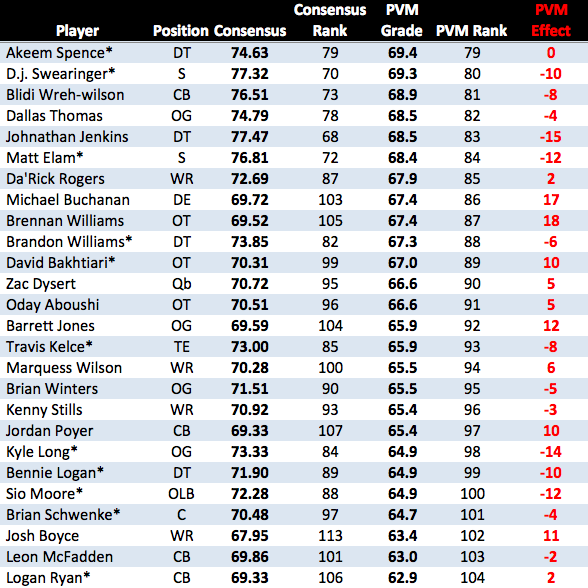
Anyway, now we’ve got this year’s prospects compared side-by-side with the top prospects from 2012 and 2010, graded using the same scouting ratings and formula.  Here are the results, with current prospects highlighted yellow:Screen Shot 2013-04-15 at 11.34.59 AM

Notice the ratings and order of this year’s class is different from the current TPR system (due to the absence of NFP’s scouting data).  Also, while I will only be discussing the TPR rankings here, I’ve included a chart at the end of the post that sorts by average rating (so even if you think TPR is bullshit you can still find something interesting here).

As you can see, Luck, Bradford, and Griffin are far and away the best prospects from these three years.  Also fairly obvious is the fact that Luke Joeckel, this year’s #1 ranked player, is just the 9th best prospect here.

That’s what everyone means when they say there are no “elite” players in this year’s draft.

However, after the top subset of prospects, this year’s class takes over the list, meaning that there are a LOT of very good players here.  I know this point has been made repeatedly, but I wanted to show a very clear picture of exactly how this draft compares to previous years.

So what does that mean for the Eagles?

– First and foremost, it means trade back.  Almost regardless of compensation, if the Eagles can move back a few picks (staying in the top 10), the team should and likely will take that opportunity.

– The Eagles should still get a very good player.  Here’s where it will get tricky for fans.  If the Eagles stay at #4, whomever they select will be expected (by fans) to be a star from day one (or soon after).  It’s pretty clear, though, that such expectations would be unfair for just about all of these players.

Please, everyone must understand:

Luke Joeckel is not Joe Thomas

Star Lotulelei is not Gerald McCoy or Ndamukong Suh

Dee Milliner is not Patrick Peterson

It sucks (for the Eagles), but it’s true.  Anyone expecting that level of talent from the Eagles first pick is likely to be sorely disappointed.  However, take a close look at the chart above and it should be clear that the Eagles can still come out of this draft in good shape.  A number of prospects in this class are rated more highly than guys like Eric Berry, Joe Haden, Earl Thomas, Anthony Davis, etc…

Adding a player of that caliber is still a big upgrade and something we should all be excited about.

Other notes:

– By this measure, Brandon Graham was a better prospect than anyone the Eagles will be able to select this year…

– Eagles fans should be a bit higher on Dee Milliner.  Not perfect, but he’s a very good CB prospect.

– Picking Geno Smith at #4 would be crazy…and I think all the rumors are just misinformation.

– It’s possible that the Derrick Morgan, JPP, Brandon Graham DE run is among the best we’ve ever seen at that position.  Obviously depends on Graham’s transition, but all three of those players were steals on draft day.

– Not related to this post, but Tyler Wilson should be getting a lot more respect.

– Don’t sleep on Ziggy…with so much misinformation out there and rumors that the Eagles really like EVERYONE, I’m more intrigued by the LACK of reported interested in Ansah.

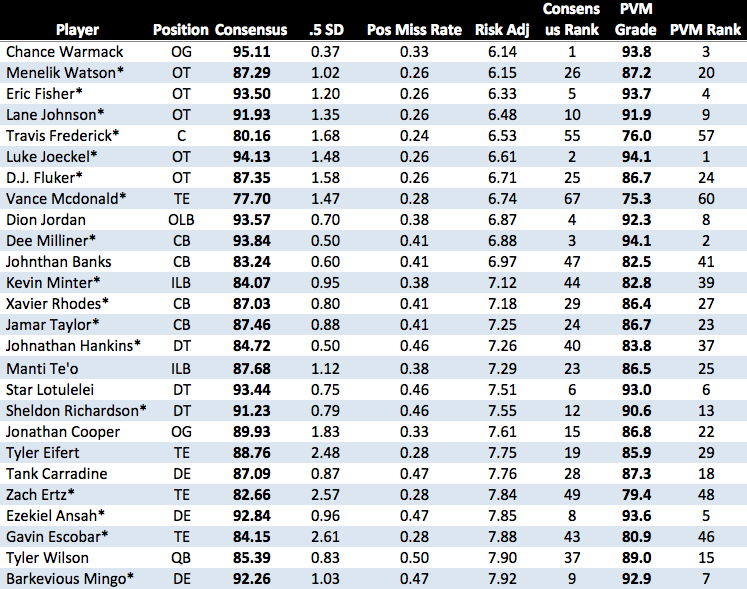
Finally, here is a chart of the same prospect set sorted by average scouting rating.  Similar story, though the names have shifted a bit:

Screen Shot 2013-04-15 at 12.04.40 PM

Overrated/Underrated Top Prospects

While I posted the full TPR rankings earlier this week, I didn’t go through them in any detail.   Today I’ll look at the players most effected by the formula.

First the fallers.  These are players whose consensus scouting ranking is HIGHER than their ranking in the TPR system.  As a result, these are players we expect to be OVERDRAFTED.  Now we need to be careful about the relative magnitude here.  For example, a ranking difference (as shown in the TPR Effect column) of just a few spots isn’t a big deal.  We’re mostly concerned with the larger movements, as they indicate a wide divergence between perceived value and actual value (as we’re attempting to quantify it here).

Here are the top fallers among the top 60 overall prospects:

Screen Shot 2013-04-12 at 9.22.47 AM


For Eagles fans, the first guy on the list (Cyprien) should be of interest.  Cyprien is a definite potential target for the team in the 2nd round.  By these rankings, taking him at #35 overall would be a slight reach, but nothing to get too upset over.  HOWEVER, it also shows that we shouldn’t be surprised if he goes towards the end of the first round.

We should all hope that somebody takes Matt Elam in the first round (where he’s been listed in several mock drafts).  Elam ranks as just the #5 overall safety by the TPR rankings, FAR below Cyprien, Eric Reid, and just behind D.J. Swearinger.

Other notes:

– Jarvis Jones and Sylvester Williams both drop from the mid-first round to the end of the first round or beginning of the second.  Both of these players have relatively large scouting rating standard deviations, meaning ESPN, NFL.com, and NFP have largely divergent opinions of each player.  Neither seem to be in play for the Eagles, but these guys are both  wild cards for draft day, in that they can go anywhere from the top 15 to the top half of the second round.

– Dion Jordan falls 4 spots.  While that’s not a huge amount on an absolute basis, it’s very meaningful for him, since he began ranked 4th overall.  Though he’s been a popular mock pick for the Eagles at #4, the rankings here show that would NOT be a good pick.

Now let’s look at the risers.  These are guys who are likely to be UNDERDRAFTED, and therefore may represent good value in the first two rounds of the draft.Screen Shot 2013-04-12 at 9.38.23 AM

Quarterbacks, obviously, feature prominently on this list. Despite a relatively low hit rate, the QB position still receives the largest benefit from this system.  The reward of hitting on one is so much larger than the reward of any other position that QBs tend to fly up the list (which we see in real life as well).

What’s interesting here is that Tyler Wilson gains the most and becomes the SECOND ranked QB, just ahead of Matt Barkley.  Most QB discussion has centered on Geno Smith, Ryan Nassib, Matt Barkley, and EJ Manuel.  According to these rankings though, Tyler Wilson should be getting a lot more attention.

– Towards the lower end, Ezekiel Ansah benefits, moving from #8 to the top 5.  Still not sure if he can be a 5-tech DE (I think he can), but he remains a dark hose candidate for the Eagles pick.  His ranking here suggests that wouldn’t be a stretch.

– Tank Carradine jumps 10 spots, from the end of the first round to the middle.  He is a player I’ve been secretly hoping would drop to the Eagles at #35, but his listing here suggests that’s unlikely.  If he does, it’d be an early candidate for steal of the draft.


Looking at Prospects on an Absolute Basis (not relative)

So now we have relative rankings for all of the top prospects in this year’s draft, but there are a couple of issues with the scores, namely:

– Each player is scored on a different scale (due to positional risk and impact modifiers)

– We can’t compare players from one year to the next, since those modifiers will change as the league changes.

Neither of those presents any problems for what the ranking’s main purpose is, but there is a way to address it, which I will now explain.  This will allow us to answer the question of “how good is a prospect?”, rather than just “who is the best prospect?”.

First let’s look at the scales.  As I mentioned, each position carries a different maximum score, depending on the amount of inherent risk at that position and its potential impact.  Here are the maximum sores by position:

Screen Shot 2013-04-11 at 11.05.05 AM

Note that these numbers are rounded for the sake of simplicity.  The only surprise for me is at the Safety position, which ranks near the bottom.  Basically, this is telling us that:

According to our Risk/Impact measures, the PERFECT QB prospect is better than the PERFECT DE prospect, and so on.  Again, the ranking of safeties surprises me, but that’s why I use the data, rather than my own rankings.

Now that we have the maximum scores for each position, we can take another step.  That is, we can find divide each player’s individual TPR grade (TPR seems more accurate than PVM at this point) by the total available points at his position.  For example:

Ziggy Ansah has a TPR grade of 93.6, out of a possible 103 points, giving him a % score of 91.3%.

This method of scoring has a couple of advantages.  It solves the problem of comparing prospects from different years while accounting for the fact that the league evolves.  It enables us to easily back out the positional impact and risk modifiers, while keeping individual risk. It also is a bit easier to understand, since it’s out of 100 and every player is on the same scale.

By looking at the % score, we get a better question of the ABSOLUTE value of each prospect, rather than just the RELATIVE value (though for the draft’s purposes RELATIVE is far more important).

So now let’s look at the top of the board again, this time with the % scores included. First I’ll show the top players sorted by TPR rank.  Then I’ll show them sorted by % score (“Pos % Score”).

Screen Shot 2013-04-11 at 11.20.18 AM

Screen Shot 2013-04-11 at 11.23.24 AM

This second chart will help to answer the question of “How strong is this draft?”.  Unfortunately, I do not have the complete data set for the past several years (can’t find NFP’s ratings).  With only 2 sets of ratings, the system loses a fair amount of value.  Additionally, I do not have the salary information from 2011-2012, which would result in different positional impact scores.  However, we’ll do the best we can with what we have, since I want to show an example of what we’ll be able to do from now on.  My guess is that, if included, NFP’s ratings would INCREASE the standard deviation of most players, LOWERING their overall score.

Here are the top 25 picks from last year:

Screen Shot 2013-04-11 at 11.41.32 AM

Again, since we don’t have NFP’s ratings, this isn’t an exact apples-to-apples comparison.  Regardless, we can see at the top of the board that Andrew Luck was a far better prospect than anyone available this year (not that we didn’t know that).

HOWEVER, after Luck, Griffin, and Kalil, this year’s draft class looks pretty good by comparison.  In fact, the average Positional % score of the top 25 players THIS year is slightly above the average for last year, even though last year includes Andrew Luck as a high outlier.

Other notes of interest:

– Dee Milliner appears to be a BETTER prospect than Morris Claiborne was last year.  This has been talked about a lot (Milliner not being a “top” CB prospect), but he scores better than Claiborne, who was drafted 6th overall last year.  Consequently, it really should be a surprise if Milliner goes top 5 this year, despite not having elite return skills.

– All three top DTs this year (Star, Floyd, and Richardson) score better than Fletcher Cox did last year.

– Ryan Tannehill would indeed be the top QB prospect if he was in this year’s draft.

– Andrew Luck is as close to a perfect prospect as we are ever likely to see.

– RG3 was a better QB prospect than Chance Warmack is a G prospect.

Tomorrow we’ll take a look at the overall rankings and next week I’ll see if I can do some side-by-side big board comparisons so we can see where guys like Kiper diverge from our board.

Who are the Riskiest/Safest Top Prospects?

If you haven’t seen the new Total Prospect Rankings, see either yesterday’s post or the PVM Rankings tab at the top.

There are a number of ways we can slice and dice this information, and over the next couple weeks I’ll look at a bunch of them.  Today, we’ll look at the “riskiest” prospects this year.  Note we are only looking at the top subsection of players (137 total, of which I posted 130), so we aren’t including players who are likely to be late round picks.

As I discussed yesterday, “risk” in the draft is composed of two components, the individual player’s risk and the larger positional risk, as quantified by the historic success of players drafted at each position.

First let’s look at the individual component.  Here is a chart showing the prospects with the highest standard deviations in their consensus ratings.  Note that the measure here is HALF the true standard deviation.  Also, for this chart I’ve only used Top 60 prospects.  The worse prospects tend to have higher standard deviations, so using the whole sample results in a bunch of guys that aren’t really worth talking about just yet.

The columns should be self-explanatory, but: “Consensus” is the average scouting score.  “.5 SD” is the measure we are looking at.  “Pos Miss Rate” is the historical failure rate for each position.  “Risk Adj” is the combined risk component, as described yesterday.

Screen Shot 2013-04-10 at 12.10.48 PM

Immediately, the two QBs at the top jump out.  EJ Manuel and Ryan Nassib, both potential targets for the Eagles in round two (or late round 1) carry very high “individual risk rates”.  The three scouting groups I’ve used have widely different opinions of these players.  Therefore, they are riskier choices.

Other notable inclusions on this list are:

– Sylvester Williams, DT.  Ranked 22nd overall by the Consensus Scores, he drops to 33 in the TPR system (due in part to his placement above).  He carries the 6th highest individual uncertainty score of all the top prospects.

– John Cyprien, S.  He is a popular target for the Eagles 2nd round pick, but does not fair well in the TPR system.  There is relatively wide disagreement among scouts about his ability, and while he ranks 30th in the Consensus Scores, he drops to 43rd in the TPR rankings.  Note that the Eagles 2nd round pick is nearly halfway between those two rankings, meaning he remains a viable option for the Eagles at pick #35.

– Towards the bottom, we can see Sharrif Floyd carries the highest individual uncertainty among Top 10 prospects.  This is part of the reason I am firmly in the Star>Sharrif camp.

Now here is the chart showing the players with the LOWEST individual risk grades:Screen Shot 2013-04-10 at 12.24.41 PM

This is perhaps the more interesting chart for Eagles fans, as it includes many of the potential targets for the 4th overall pick.

– Chance Warmack remains a pain in the ass.  I originally conceived of the positional adjustments in an effort to explain why Chance is a terrible use of resources in the Top 10. However, through two iterations he remains near the top of the TPR draft board.

Here I have to stress two things about Warmack that people aren’t mentioning enough:

1) He is the highest rated prospect by Consensus Score.

2) He has the lowest standard deviation, suggesting there is widespread agreement that he is the best prospect.

I’m close to the point of saying that our (and MY) preconceived notions about positional value may be blinding us to what should be an obvious assertion, namely: Chance Warmack should be a top pick.

I’m not there yet, but the entire idea here was to take subjectivity and bias out of the equation, and on that basis, Chance Warmack looks pretty good.

– Dee Milliner, Dion Jordan, and Star Lotulelei all place near the top of the board.  That means, on an individual basis, we should be more confident in their scouting grades then in the grades of players lower on the list.

How about Total Risk?

Now let’s look at the total risk component.  As described yesterday, the total risk component is weighted heavily to Positional Evaluative Error, with individual uncertainty included, but with less impact.

This is one area where I am not 100% comfortable with the model.  Should individual uncertainty carry more weight?  I don’t know, but maybe, and it’s something I’m thinking about as we get closer to the draft.

Anyway, here is a chart showing the Top 60 prospects with the HIGHEST risk components:Screen Shot 2013-04-10 at 12.34.53 PM

Nobody should be surprised to see EJ Manuel and Ryan Nassib at the top of the list.  A lot of individual uncertainty + a large positional risk rate = a big risk component.  These guys may become good/great players, but given where they will likely be drafted, they represent the riskiest picks in the entire draft.

Others of note:

– We already discussed Williams, Cyprien, Floyd.  For obvious reasons, they are included above.

– Keenan Allen is another one to note. Ranked 16th overall by Consensus Score, he is one of the “riskiest” top prospects, despite the fact that the TPR system only drops him to 19th overall.

While the guys above probably don’t seem familiar to most of you, they are all players that we’ll be seeing/talking about towards the bottom of the 1st round and through the 2nd round of the draft.  Might as well start familiarizing yourself with them now.

Now for the LEAST RISKY top prospects:Screen Shot 2013-04-10 at 12.41.59 PM

Not surprisingly, we see mostly offensive linemen at the top of the list.  The biggest name for Eagles fans is Eric Fisher, who is probably the most likely pick for the Eagles at #4.  Based on the current measure of risk that I’m using, Fisher is the 3rd SAFEST top prospect.

Some other things to keep in mind:

– Pay close attention to the CBs listed near the top of the list.  Guys like Rhodes and Taylor could be great pick-ups for the Eagles if they fall to the second round.

– Menelik Watson is another guy to keep an eye on.  It’s possible (though I think unlikely) that he’s available at #35 and, should the Eagles pass on Fisher at #4, would be a prime target for the team.

As I said, I’ll be looking at this info in a number of different ways, but please feel free to suggest anything in particular that you’d really like to see, either through twitter, email, or the comments.


Total Prospect Rankings (PVM Version 2.0), Balancing Risk and Reward in the NFL Draft

As promised, I have completed a relatively dramatic overhaul of the PVM system.  Just as I did in the original post, I’ll explain the methodology and theory first (and changes) and then list the updated rankings.  Feel free to skip to the bottom if you don’t care how the system works.

Please note that this is still far from a finished product.  There are a number of issues (mostly calibration) that I will only be able to address after collecting several years of data.  Additionally, I’m posting it now so that I can incorporate and comments/criticism prior to the draft.

The Theory

The original PVM system was meant to function as a better determination of BPA (Best Player Available) rankings.  In essence, a player’s scouting grade is not enough.  A complete system will account for positional value and positional risk IN ADDITION to the scouting grade.

Basically, this system is an attempt to provide a “Default BPA Ranking”, against which all team drafts can be compared/graded.  The original system included two components, scouting grades and a positional value multiplier (hence the PVM name).  Today, we’ll add a measure of risk to the formula.

Methodology 

As mentioned above, the system is composed of three components:

Consensus Scouting Grade – Player/Positional Risk Adjustment + Positional Impact Bonus

Consensus Scouting Grade

This is the easiest part.  I compiled prospect ratings from 3 4 reputable sources: Scouts Inc. (ESPN), NFL.com, the National Football Post, and Draft Ace.  The NFP’s scale is different, so those number were adjusted for an apples-to-apples comparison.  Additionally, NFP includes letter grades/modifiers that were not incorporated here.  Each source is weighted equally, with the average score taken as the “Consensus Rating”.

Player/Positional Risk Adjustment

This is the new addition to the system.  Obviously, some players/positions carry more risk than others.  I’ve attempted to quantify that using two measures: standard deviation of the scouting ratings and historical positional miss rates.

Positional Miss Rates:  To quantify the positional risk, I looked at every player drafted in the 1st or 2nd Round between 1999 and 2011.  Basically, players selected in the 1st and 2nd round are expected to be starters, regardless of position.  The miss rate is an attempt to see which positions have larger margins of evaluative error.  Here are the rates I arrived at:

Screen Shot 2013-04-09 at 5.51.49 PM

A player counts as a “miss” if they did not start for at least 5 seasons (according to Pro-Football-Reference.com) or, if they have not been in the league that long, have not started at least half the time. Note that my historical data does not break out LBs by outside/inside, hence the same miss rate.

As you can see, there is a very wide disparity in success rates.  As expected, offensive linemen are “safer” picks, while offensive skill positions are the riskiest.

Here’s where calibration comes into play.  The scouting grades are out of 100 points.  To arrive at a positional risk measure, I multiplied the historic miss rates by 100, then took the square root of that.  For example, the risk adjustment for the TE position would be 100 * .28 = 28.  SQRT(28) = 5.27.

That’s the first half of the risk measure.

I then took each player’s rating standard deviation and multiplied it by .5.  Basically, the idea here is that wide agreement among scouts should equate to more certainty and vise-versa.  Therefore,  a high standard deviation means we are less certain about the consensus rating.  A low standard deviation means we are more certain.  I took half of the SD measure to avoid overly penalizing players with high consensus grades but high standard deviations.  On the pure SD measure, players with lower grades across the board can jump players with higher grades across the board, by shear virtue of small deviation.

I then added this to the positional measure explained above to arrive at the Risk Adjustment.  The Risk Adjustment is subtracted from the consensus prospect rating.

For Example: Sharrif Floyd’s consensus rating is 92.98.  His standard deviation multiplied by .5 = 1.66.  His positional risk measure (DT) equals 6.76.

6.76 + 1.66 = 8.42

So Floyd’s Risk Adjustment is 8.42, his score after accounting for risk is 84.56.

Now we need to add our last component, positional value.

Positional Value Multiplier

The overall idea here remains the same as the original system.  However, I’ve changed both the sources of data and the subset included.

Previously, we used the average cap hit for each position across the entire league.  Since the NFL has a salary cap, the relative allocations should tell us how teams, in general, value different positions.

However, those measures included rookie contracts and contracts for players not expected to contribute at their position (like a special teams ace).

So here’s what I did instead:

First I went to Pro Football Focus and counted how many players played more than 50% of their team’s snaps at each position.  I did this to account for positional scarcity (e.g. there are a lot more WRs than Cs).  I then took 25% of those measures so that we will only be looking at players considered well above average at their position (at least by pay).

Then I looked up the top _ contracts at each position and found the average value at each position.

I used those averages to create new positional multiplier values.  Here are the new measures:

Screen Shot 2013-04-09 at 6.17.29 PM

Compared to the original measures, there is a wider disparity.  For instance, the QB measure was previously 9.07%, significantly less than the new measure.

Just as we did before, I used these measures to inflate the Risk Adjusted Prospect score for each player.

To recap: We start with the Consensus Ratings, Subtract a Risk Measure to account for player rating uncertainty and positional scouting error, then inflate according to the PVM numbers to account for positional impact.

Overall, the biggest flaw right now is the calibration of the Risk Measure and PVMs, their subjective.  However, I attempted to balance the relative magnitude of both of them.  Additionally, if we step back and look at the overall measure, we see that relative importance is as follows:

– Consensus ratings (by far the most important)

– Positional Value and Risk

– Individual player rating uncertainty

That looks right to me, as far as what I’m going for.  As I mentioned above, the only way to arrive at a “correct” calibration is to use the system for several years, then analyze the rankings to see which parts of the formula are over-weighted and which are under-weighted.

By all means, if you have thoughts as to how to improve the system, let me know.  We still have a couple of weeks to make revisions/improvements.

Total Prospect Rankings

Here they are, we’ll talk about them in more detail starting tomorrow.Screen Shot 2013-04-09 at 6.35.52 PM

Screen Shot 2013-04-09 at 6.36.45 PM

Screen Shot 2013-04-09 at 6.38.14 PM

Screen Shot 2013-04-09 at 6.39.39 PM

Screen Shot 2013-04-09 at 6.40.18 PM

Random Thoughts

Since it’s Friday, I’ll use today’s post as a kind of clearinghouse for thoughts on several areas.  FYI, I probably won’t have time to post on Monday, so I apologize in advance for not providing the requisite time-kill.

Free Agent Tackles

– I would be very surprised if the Eagles aren’t interested in both Winston and Clabo.  I don’t think the team is completely enamored by either, but given the current OL, it’d be foolish not to consider bringing either of those guys in at the right price.  I think Winston is holding out for a deal the Eagles are unlikely to provide.  Clabo is more interesting.  Given his age, I doubt he’ll find any long-term offers.  At a reasonable price for 1-2 years, he’d address a need for the Eagles.

Again though, if the Eagles are sold on Fisher in the draft, there’s no way they sign a starting RT.

Draft

Everyone is trying to game out what Chip Kelly is thinking.  I think everyone is forgetting about Howie a bit too easily.

We already know Howie has the final say on draft matters.  Obviously Kelly has a huge amount of input, but Howie very recently experienced what happens when a GM bows too easily to a coach’s wishes (Jarrett definitely, maybe Watkins as well).  I doubt he’ll let that happen again so soon, especially with a coach who’s never done this before.

Therefore, “what is Howie thinking?” should be a question more people are asking.

If I had to guess, may answer would be “please god let me trade down”.  I know that it’s popular to say how little interest there is in trading up in this draft, but I find that to be a bit overblown.  There are a number of prospects that I can easily see individual teams falling in love with (Eric Fisher, Sharrif Floyd, Dion Jordan, Ziggy Ansah, Star Lotulelei, Geno Smith).  Additionally, there is such uncertainty that no team has a good handle on when any of those guys will be available.

In that scenario, all it takes is one team with an itchy trigger finger.  It’s very conceivable that the Eagles could choose any of the prospects I mentioned above.  That should be enough to scare a team into action if they really like one of those guys.

That may just be wishful thinking, but I think it’s a scenario that is being dismissed too hastily.

Individual Prospects

I’m starting to get a feeling that perhaps we’re all overlooking the obvious.

– Our defense needs a lot of improvement (far more than the offense).

– The DL has a particularly glaring hole in it.

– Chip has repeatedly professed a love for big, freakishly athletic players.

and yet…I have yet to see Ziggy Ansah mocked to the Eagles.

Ansah is 6’5″, 270 lbs with long arms and big hands.  Explosive athleticism and great quickness.  He’s “old” at 24 yrs, and first played football in 2010 if I’m reading correctly.  So here we have a top DL prospect with freakish athleticism who sounds like he could step into the 5-tech spot, a position of great need for the Eagles.

I don’t think it’s likely, but it makes too much sense to me to not consider it a real possibilty.

Sharrif Floyd –

This is almost the opposite of Ansah.  I’m seeing Floyd mocked to the Eagles and I still don’t understand it.  He looks to be a 3-tech guy; we already have Cox, end of story.  He might be able to play 5-tech, but certainly doesn’t look to be a NT, severely limiting his value for the Eagles.

Star Lotulelei –

I’m just going to keep on repeating this (I’ve been saying it for a LONG time), Lotulelei is an EXCELLENT fit for the Eagles.  Now that his heart issue is resolved, there are no more red flags.  He can play 5-tech, he can play NT.  His first-step quickness makes him a nightmare for centers when he’s lined up at 0.  Yes, please.

Eric Fisher –

Fisher, obviously, is a likely possibility for the Eagles.  Top OT (after Joeckel) and the Eagles need one.  However, keep in mind that OTs are also among the easiest to find later in the draft.  Especially if Kelly is OK with Herremans at OT this year, waiting until the 2nd or 3rd round to take one makes a lot of sense.

Dion Jordan –

Popular pick due to his size/athleticism and the Oregon ties.  This may be a tricky one for the Eagles though.  Kelly might know him TOO well.  I imagine a coach like Kelly will inevitably think VERY highly of players who played a large role in his earlier success.

However, Kelly is a very smart guy, so hopefully he knows that his opinion is inherently biased, potentially to a large degree.  This is where Howie really needs to step up.  If he doesn’t think Jordan is the best guy on the board, the Eagles can’t take him, regardless of what Chip thinks.  This goes back to the point I made above:  This is Howie’s draft, not Chip’s.

That’s all for today.  Enjoy your weekend.  I’m making some heavy revisions/updates to the PVM system and hope to have it available some time next week (that way we have time to pull it apart for a little while before the draft).

Necessary Conditions for Winning a Super Bowl

Since we’re in the midst of the off-season, between the two major team-construction events, I thought it’d be a good time to explain my personal philosophy on what it takes to win a Super Bowl.  The goal is to try to dig down to the most basic attributes a team must have, and in the process examine clichés like “defense wins championships” or “you need an elite QB”.

Here’s where I am currently:

To win the Super Bowl:

– You need a lot of good players.

– You need some of those players to play great (greatly?) in the playoffs.

– You need to get a few lucky bounces along the way.

That’s my current theory at least, I’ll update it as I find new data that conflicts.  Today I’ll give my thoughts on the QB position and then examine the whole Offense vs. Defense wins championships thing.

Overall, I’d like to identify a set of necessary conditions for winning the Super Bowl.  Today is the first step in that endeavor.

First I’ll attack the QB position:

You do not need an elite QB to win the Super Bowl.  It certainly helps, but the fact is you just need a “good enough” QB.  The entire “elite” debate is ridiculous, but especially at the QB position.  When you use the term “elite”, you’re alluding to a very exclusive group.  Is the top 10% fair?

If so, that means the number of “elite” starting QBs in the NFL is between 3 and 4.  So congratulations Patriots, Packers, and Broncos; one of you obviously won the Super Bowl last year.

The fact is, the term “elite” is useless since there’s no standard definition, and even if there were it wouldn’t mean anything significant.  Teams need a QB that is “good enough”.  So what does my list look like?

Good Enough – Brady, Manning (both), Rodgers, Brees, Ryan, Roethlisberger, Flacco, Schaub, Romo (i hate him but yes), Rivers, Kaepernick, Luck

That’s my list, although I’m sure there is some disagreement.  Also, this is not to say a QB not on that list CAN’T win the SB, just that, at this moment, I don’t believe they’ve proven themselves good enough.

Joe Flacco is not an “elite” QB, by any realistic definition.  However, that doesn’t matter, he still won the Super Bowl.  Colin Kaepernick came damn close.

The problem for Eagles fans is that neither Vick nor Foles looks good enough this year.  It’s possible Foles could get there, but extremely unlikely this season.  I’m pessimistic about Vick’s chances.

Does Defense Win Championships?

Well, what do you think?  Now consider:

– Over the last 10 seasons, 5 SB winning teams ranked in the top 7.5% for points allowed per game.  Put differently, the top 24 out of the last 320 team seasons contained half of the Super Bowl winning teams.

This is, perhaps, the most surprised I have ever been by a stat I’ve looked up while writing.  In any case, it would certainly appear as though having a truly great defense goes a long way.

What about offense?

Based upon the above stat, I would expect to find a similar result (i.e. be great at something, either offense or defense).  Looking at the same sample:

– Just 1 SB winning team (New Orleans ’09) in the last ten years placed in the top 7.5% of points scored, or 92.5 percentile.

If we look at the top 10% of offenses over the last 10 years, just one more SB champ makes the cut, the 2004 Patriots.

Put together, it seems like having a “great” defense is preferable to having a “great” offense.  That definitely has to change the overall theory a bit.

What about the reverse perspective?

– The lowest ranked offense to win the Super Bowl in the last ten years was the 2008 Steelers, who averaged just 21.7 ppg, good enough for exactly 160 out of 320, or the 50th percentile.

The 2003 Patriots are just above them, having averaged 21.8 ppg.  Interesting to note that the Patriots (now offensive juggernauts), won their first title with a fairly weak offense.

As you might have expected, both the ’03 Patriots and the ’08 Steelers had historically great defenses.   Both placed in the top 10 of the last 10 years.

– The lowest ranked Defense to win the SB in the last ten years was the ’11 NY Giants, who allowed 25 ppg (while scoring just 24.6, leaving them the only SB winning team with a negative point differential, I really hate the Giants).

That places them 265th out of 320 teams, or 17th percentile.

– Among SB winners of the past 10 years, the 2007 Giants are the lowest ranked offense that did NOT have a corresponding historically great defense.  They scored 23.3 ppg, ranking the team 120th out of 320, or the 62.5 percentile.

I feel like we need some charts, so here are two, one showing points allowed vs. Wins and the other showing Points Scored vs. Wins.  Note this is just regular season data.

Screen Shot 2013-04-03 at 12.36.20 PM


Screen Shot 2013-04-03 at 12.35.15 PM

Both illustrate strong correlations.  The values:

– Points Scored to Wins:  .768

– Points Allowed to Wins: -.669

Have I confused you yet?

If not, good for you, because I’ve certainly confused myself.  Let me attempt to summarize what we’ve seen here today:

– A GREAT defense goes a long way, but is NOT a necessary condition to winning a SB.  Neither is a GOOD defense, as evidenced by the ’11 Giants, ’06 Colts, and ’07 Giants (all placed in the bottom 50% yet still won the SB).

– A GREAT offense does not go as far, but a GOOD offense does seem to be a necessary condition for winning a SB.  No offense ranked in the bottom 62.5% for the last ten years has won the SB.

What does it all mean?

While teams should focus on being good everywhere, it appears as though Offense should take slight preference, as the only way to win without a very good offense is to have a historically GREAT defense, which is obviously harder to put together.

Or you can be like the NY Giants and just ride a wave of lucky bounces…twice.

Visualizing the Offense

Yesterday we did the defense, so naturally today we will do the offense.  However, this is a little bit less informative due to the injuries the team sustained last season.

I’m going to skip the original chart I made because it was based on perceived ability (not performance), and included all of the injured starters.  Using PFF’s grades, this is how the offense looked last season.Screen Shot 2013-04-02 at 11.05.12 AM

A couple of notes, then I’ll highlight a few areas.  Due to the injuries, there were a number of players that received playing time.  I used whichever player took the most snaps as the rule for inclusion.  Watkins and Scott played nearly the same amount, but they ranked similarly so the color wouldn’t change.  There were also a few players who were on the edge as to which color they deserved (for instance Shady was the last spot in the top third).  I could have done the mixed colors again, but I wanted it to be as clear as possible.

Takeaways-

– Both Jeremy Maclin and D-Jax played well below their potential.  Perhaps not surprising given the QB situation and the state of the O-Line, but it remains a cautionary note going into next season.  We know Maclin has the talent, but we can’t pretend he’s a lock to realize that next year.

– Jason Peters will hopefully come back as green.

– I know everyone loves Jason Kelce, but PFF graded him close to the bottom for his rookie year.  I think he’ll be good, but this is another position at which fans seem to be buying the upside without realizing there’s a reasonably significant chance it doesn’t work out.  For the record, his rating in 2011 would have placed Kelce LAST in 2012, below Dallas Reynolds.

– The right side of the line is tough to project.  If the Eagles draft a RT at #4 and shift Herremans back to RG, then both of those spots could go green.  Keep that in mind as we get closer to the draft.

Drafting a starting RT could provide immediate improvement at TWO positions.

– Although I don’t need to mention this, having your QB grade out red is bad.  Of the 27 QBs that played more than 50% of their team’s snaps, just 4 ranked worse than Vick (Ponder, Fitzpatrick, Sanchez, Weeden).

– It will be interesting to see how James Casey and Brent Celek split time.  I know Kelly says he will use a lot of 2 TE sets, and Casey can line up almost anywhere, but it wouldn’t surprise me at all to see Casey supplant Celek as the starting TE.

– Finally, PFF’s ratings shouldn’t be taken as gospel. So feel free to disagree with the colors above, just note that the source is Pro Football Focus, not me.

That’s all for today.  Working on some bigger stuff that takes time, but the results should be fun.

Visualizing the Defense

Now that we’re through free agency, I think it’s time to take another look at the defensive line-up.  Previously, I put together an illustration of the Eagles 2012 starting defensive line-up, with each position color-coded according to performance/ability.

Today, I’ll put the same illustration together, this time with a the scheme/roster additions reflected.  I think doing this visually makes the comparison much easier to see.  Additionally, I’ll go back an update last season’s using PFF’s ratings in an attempt to take some of the subjectivity out of the ratings.

This is an attempt to make roster evaluation as simplistic and easy as possible.  Red = Bad, Green = Good.

Please note that this (the color-coding) is obviously subjective (hence the PFF adjustment in the second chart).  My guess is there are a few players for whom there will be disagreement over the corresponding color rating.

Here is the original graphic of last year’s defense, not updated with PFF:Screen Shot 2013-04-01 at 11.42.56 AM

For reference, Green = above average starter, Yellow = league average starter, Red = Below league average.  If I could go back and change anything, it’d be the CB ratings.  I was far too generous to both Nnamdi and DRC.  Using pure performance (not potential), they both should have been red.  For those paying attention, that means the ENTIRE Eagles secondary would be rated below league average (which sounds about right in hindsight).

Now let’s use PFF’s ratings.  If a player was in the top third of the league (starters), they’ll be green, middle third = yellow, bottom = red.  This chart will be a reflection of ONLY total performance, so no adjustments made for inconsistency (see multi-colored ratings above).

Screen Shot 2013-04-01 at 12.00.51 PM


Note that Nate Allen and Akeem Jordan have replaced Anderson and Chaney.  At the time I did the last one, Anderson and Chaney were the starters.   However, over the whole season Jordan and Allen played more snaps.

Looks like the original ratings were pretty good, except for the previously mentioned CBs.  Additionally, while Kendricks had runs of both very good and bad play, his overall rating was very poor.

As you can see, there was far too much red and not nearly enough green last year.  It comes as no surprise then, that to date, most roster changes have been made on defense.

Now comes the hard part, trying to project next year’s team.  First a couple of rules:  Injury-risk will not be taken into account.  This is obviously a major concern, but I don’t see any good way to incorporate it into the graphic.  Therefore, I’ll projected the “on paper” defense, then highlight the risks afterwards.  Also, since we don’t know the exact defensive alignment Kelly will use, I’ll stick with a basic 3-4.

Screen Shot 2013-04-01 at 12.29.39 PM

Keep in mind that the actual physical alignment will be different from what’s shown above. However, I think right now this is as good a guess as any in terms of personnel.

What jumps out?

– Phillips, Chung, and Fletcher can all be considered “injury risks”.  That’s a big chunk of the secondary (as well as the source of major improvement over last year).  If any or all of those guys go down, the Eagles are back in the red.

– The DL has gone from a strength (relatively speaking) to a weakness.  Cox is a keeper and should anchor the line (I don’t see him having an issue transitioning to the 3-4, regardless of whether he ends up as a 3-tech or 5-tech.)  However, Spooky is just a body and can’t be counted on for even league-average play.  Also, the opposing DE spot is a glaring hole on the roster (hence all the Star/Floyd draft talk).  I think there’s a good chance they address this with one of those prospects.  It’s also possible Vinny Curry puts on some weight and takes a shot at this spot.  In any case, as of this moment, it has to be viewed as a weakness.

– As I mentioned after their signings, the Williams/Fletcher combo is going to take some getting used to (Fletcher may not even win the job).  The hope here is for league-average play, nothing more.

Overall, the D looks a lot different from last year (personnel-wise).  However, it’s clear we still need a couple of impact players (i.e. green).  Maybe Barwin rebounds and becomes one of them.  Maybe Cole or Graham transitions better than projected.  Maybe Kendricks flourishes at his new spot and finds a consistent game.  Hopefully the team can use the draft to upgrade from red to green either at NT or DE.  That’s a lot of unknowns.

Keep in mind that it’s easier to go from bad (red) to average (yellow) than it is to go from average to good (green).  It’s clear that Roseman and Kelly looked at the second chart above (the PFF adjusted one) and tried to address every red mark (weakness).  On paper, they’ve been successful.

Even so, as of this moment, the Defense is still pretty far from one we can safely project as “good”.  Though after last season, I’ll be happy with just average.