Nash Equilibrium and 3rd Down Strategy

Today I’m following up on yesterday’s post.  I encourage anyone who hasn’t done so to read that before moving to this post.

Now, onto the important stuff.

I discussed how we can apply Game Theory to NFL 3rd Down Strategy, highlighting what appeared to be a large inefficiency in 3rd down play-calling.  Basically, we should expect the Run/Pass play call breakdown to reach a point at which both options are equally likely to succeed.

This is the point of equilibrium.

I did some more digging into the numbers, the result of which is better resolution and more actionable intelligence.  Yesterday we looked at all plays run on 3rd down with between 1 and 5 yards to go.

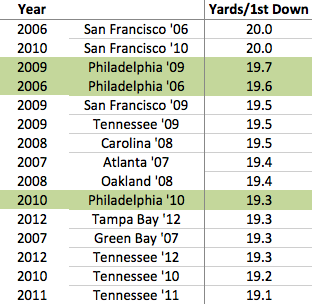
Given what we know about the NFL, this is a very wide range for yardage; teams should run more often on 3rd and 1 than on 3rd and 5.  Below, I’ve broken the data down into smaller parts.  The results are encouraging.  Here is the complete table.  Note that I’ve put this together under the assumption that the original ranges are inclusive of each smaller range (3rd and 1-5 INCLUDES the 3rd and 1 stats), if that’s not the case, then this data is useless.

Screen Shot 2013-07-18 at 10.14.35 AM

See why I find it encouraging?

Starting with the bottom row (3-5 yards), we see that the NFL has, in fact, reached the expected equilibrium (close enough).  In a 3rd down situation with between 3 and 5 yards to gain, run and pass plays are both equally likely to succeed.

Remember the Tecmo Bowl Model, though.  As we can see, the equilibrium point occurs at a Run/Pass split that his HEAVILY tilted towards the Pass (18%/82%).  This is expected.  The important part is that play-callers appear to be operating efficiently, that is, calling runs and passes with the theoretically correct frequency.

This could be a coincidence, but given that we made the prediction beforehand and its the logical extension of yesterday’s theory, that seems unlikely.

Now the important part:

Screen Shot 2013-07-18 at 10.21.30 AM

While the league looks to have hit its Nash Equilibrium in 3rd and 3-5 yard situations, it DOES NOT look to be operating efficiently in 3rd and 1 and 3rd and 2 situations.

Again, our theory is that at the league level (a very important point), the call rate on 3rd downs should naturally evolve to a point at which the average success of both run and pass are close to equal.

Given the information above, teams should be running a lot more often on 3rd and 1.  Even though they are already calling a run roughly 75% of the time, the success rate of such plays is still significantly higher than for pass plays.

So….teams should run more, which will cause defenses to adjust by “expecting” the run more (Tecmo Bowl), which will presumably lead to Pass plays being “less expected” and therefore succeeding a higher percentage of the time.  Over time, the success rates for both run and pass should converge until they reach equilibrium.

Looking at the 3rd and 2 situations, we can still see some inefficiency, though it’s not as severe as in the 3rd and 1 situations.  Again, the process should be the same.  Offenses should run more, defenses should then commit to the run more often, and pass success rates should increase (while rush success decreases) until both Run and Pass have an equal chance of success.

It’s very important to note that this is League-level data.  Therefore, applying it to any individual team is tricky.  We can NOT say, for example, that the Eagles should definitely run more than 75% of the time in 3rd and 1 situations.  All we can say is that the LEAGUE should run more than 75% of the time in these situations.  It’s certainly a logical step to then take it to the team level; but know that it becomes more difficult at that point, since you have to weigh individual strengths and weaknesses as well as the relative strength of the opponent.

Conclusion:

– NFL offenses are not running enough in 3rd and 1 and 3rd and 2 situations.

– This is a short-term opportunity to exploit an inefficiency in the game.  Once offenses adjust, defenses will too, with the end result of equal success rates and no advantage.

– While I didn’t discuss it here, teams should likely ALSO be running more often in 3rd and 3-5 yards situations, though for a different reason.  I haven’t run the numbers yet, but my guess is that once we incorporate 4th down opportunities into the equation (especially 4th and 1), running will still carry the higher overall success rate (and therefore need to be used more until the defense adjusts).

– This, along with 4th down strategy that we previously discussed (see tab on menu bar), is an area ripe for a “forward-thinking” coach to take advantage of.

The Tecmo Bowl Model; Inefficiency in 3rd down play selection

Unfortunately, I haven’t yet found the necessary data to complete the type of 3rd down examination I’m aiming for.  Yesterday, I mentioned that many commentators are overlooking the fact that you have to be a very good offense in order to run a lot of plays (you need to gain a lot of first downs).  That might sound obvious, but it’s important to consider when thinking about Chip Kelly’s stated preference for “pace”.  Just wanting to push the pace won’t mean much if the team can’t gain first downs.

Obviously, that train of thought needs more research.  For today, though, I figured I’d highlight something I stumbled across while searching for data.  See this site:

http://football.10flow.com

I have no idea where it came from, but I’ve downloaded the data its supposedly based on and it seems legit.  It’s useful for illustrating an area of the game that I believe is potentially the largest untapped resource of analytical advantage: Run/Pass play selection.

At a very basic level, we can look at play selection through what I will call the Tecmo Bowl Model (or Tecmo Super Bowl if you prefer the upgrade).

What’s the Tecmo Bowl Model?

I’m making this up as I type, but in my head, it’s an incredibly simple construct for visualizing the importance of Game Theory in play selection.  For those who don’t know the game (I’d be very surprised if any readers don’t, but just in case), Tecmo Bowl was a groundbreaking football game for the original Nintendo system.  I won’t go into any more detail than they that, but if you haven’t played it, you should go find an emulator and change that.  The important part is the play selection screen, shown here:

Screen Shot 2013-07-17 at 12.55.57 PM

Basically, for both offense and defense, a selection of 4 plays are shown.  The player picks one of these plays by pressing the corresponding button combination (shown below each play).  Here is the key part:

If the Defensive player picks the same play as the Offensive player, then as soon as the ball is hiked, pretty much every offensive lineman is pancaked, resulting in a likely sack or a throw from the QB that’s no more than a jump-ball.

Without getting into any higher-order strategy, the defense has a 25% chance of “picking” the offenses play.

Despite its relative simplicity, I believe this game has a LOT to tell us about modern (and real) football.  In essence, the defense is continuously trying to “pick” the offense’s play.  The results aren’t as dramatic as in the game above, but the fundamentals are the same.

Is the offense going to run or pass? Short or deep? Maybe play-action?

These are all questions defensive play-callers have to ask themselves.  Each subsequent decision is largely determined by both the defense’s overall strategy/strengths AND the subject down/distance/score/time scenario.  

Just as in the video game, if the defense successfully “picks” the offense’s play, the result SHOULD be a “win” for the defense.

So what?

This has obvious reprecussions for offensive strategy.  It is not enough to just pick a good play; you also need to account for what the defense will be expecting.  Correlating to the statement above: if the offense picks a play that the defense is NOT expecting, it has a distinct advantage and will be more likely to “win” that down.

Let’s take a look at an example.  From the site I referenced at the top:

The Scenario:  3rd Down, 1-5 yards to go, All Scores, Any Time.

The Results:

Screen Shot 2013-07-17 at 1.09.06 PM

For this scenario, “success” is defined as a 1st down or a touchdown.  What can we infer from the data above?

The output makes it very easy to see the relevant discrepancies.  In this situation, Run plays were 14% MORE successful than Pass plays.

Despite this, Pass plays were called nearly TWICE as often.

There are two leading explanations for this difference:

– It’s a true inefficiency.

– It’s simply the result of the type of Game Theory I described in the Tecmo Bowl example above.  Basically, Run plays are more successful BECAUSE they are called less often.  Pass plays are called 67% of the time, meaning the defense is most likely EXPECTING PASS, leaving them more susceptible to a RUN.

The big question is, has this game (long-term play selection) reach its Nash Equilibrium?

The Nash Equilibrium (very basic explanation) is the point at which both sides know the other’s strategy, but neither side is incentivized to change its own in response to that knowledge.

This situation is slightly different, since we’re talking about individual occurences within a long term game, but I believe the overall point holds.  More importantly, I do NOT think the NFL has reached the point of equilibrium (within this particular scenario at least).

Here’s where I need some help.  It seems to me that the point of equilibrium would naturally occur around the Run/Pass split that equates to a roughly equal chance of success for each.  Note that because of the Tecmo Bowl Model explanation above, this does NOT necessarily equal a 50/50 split in play calling.  Regardless, I might be mistaken in my reasoning here.  If you have any other predictions/analysis, please let me know.

Also, lest we fall victim to a small sample, here is the output when we include every season from 2002-2012:

Screen Shot 2013-07-17 at 1.28.41 PM

The numbers are almost identical, which means I’m either missing something in my prediction/analysis (very possible), or NFL play-callers are operating at a very inefficient clip.

Obviously, if it’s the latter, it has HUGE implications for in-game strategy.

Plays Per Game – Chip Kelly’s Offense and NFL Trends

Yesterday I looked at defensive plays per game, trying to get a sense of whether teams created more fumbles purely because they had more opportunities to do so.  They do not, but that’s because the difference in # of plays defensed is so small, on average.

More interesting, though, is this chart.  You’ll recognize it from yesterday, though I’ve re-labeled it “Offensive”.

Screen Shot 2013-07-16 at 11.04.52 AM


As mentioned, this clearly illustrates an uptrend in the # of plays run per game by NFL offenses over the past 10 seasons.  The overall magnitude is small (see the Y-Axis labels), but the direction is unmistakable.  Last season, teams ran about 1.5 more plays per game than they did in 2003.

The difference is small enough that it could easily be the result of chance.   However, if is was purely a result of natural variability, we’d be very unlikely to see such a smooth trend in the chart above.  Aside from 2008, a distinct outlier, the annual increase in plays run per game has been both smooth and accelerating.

What’s going on?

Let’s take a look at the data in more detail, drilling down to the team level.  As usual, I’ll start with the Eagles.  Here is the same chart, with the Eagles annual plays per game illustrated.

Screen Shot 2013-07-16 at 11.18.19 AM


The Eagles annual variability is expected, since the league average will always be more smooth than the individual team measures.  However, notice that the Eagles individual trend is also unmistakable.  Here is the raw data for the team:

Screen Shot 2013-07-16 at 11.24.48 AM


Last season, the Eagles ran more than 7 more offensive plays per game than they did during the 2003 season.  Again, the increase hasn’t been smooth (the team ran just 60.6 plays per game in 2009), but it’s real.

Looking at the Eagles line in the chart above versus the League line also tells us that the team has a disproportionate influence on the league-wide uptrend.  The Eagles began the subject time-period well below the league average and finished well above it.

There are a number of potential explanations for this, but before we get to that, let’s look put the Eagles into context.  Here is a table showing the average plays per game run by each team from 2003-2012.

Screen Shot 2013-07-16 at 11.39.37 AM

There are a few obvious results (Patriots and Saints at the top, Buffalo and Cleveland at the bottom), but some surprises as well.  St. Louis ranks 7th, for instance, which I certainly would not have guessed.  However, the 10-year average isn’t really what we’re interested in, is it?

We want to look at the relative increase.  Here is another table, this one showing each team’s average over two time periods, ’03-’05 and ’10-’12.  In other words, the first and last 3 seasons of the 10 year period.  Also, I’ve included the change for each team (+/-) and ordered by that measure, so teams that saw the biggest increase in average plays run are at the top.

Screen Shot 2013-07-16 at 11.47.00 AM

This confirms what I asserted earlier, that the Eagles have had a disproportionate effect on the overall league trend. Just 5 teams have seen larger increases between the two time periods.

So what?

I probably shouldn’t have taken this long to get to Chip Kelly, but better late than never.  As we can see, the Eagles have already been towards the front of the league in terms of running higher numbers of plays.  Whether this was an emphasis or not, it means that Chip Kelly’s overall effect on the # of plays run may be more muted than is expected.

Given the finite amount of time in each game, the minimum required time for each play to be called and set up, and the fact that the other team get’s a roughly equal number of possessions, there is only so much that Chip can do to ensure the Eagles run more plays.

Notice that New England, a team that clearly emphasizes speed of play, averaged just 2.43 more plays per game than the Eagles did over the past 3 seasons.  Last season, the Patriots ran 74.3 plays per game, which I believe is the all-time record.  Still, that was just 7 more per game than the Eagles.

Overall, a difference of 7 plays per game is HUGE.  However, from a practical standpoint and from a fan’s viewpoint, it’s not going to LOOK much different.  When one considers that the Eagles are very unlikely to be able to run as many plays as the Patriots did last year, that means the team will likely be running no more than 4-5 more plays per game than it did last year (and that’s if things go according to plan.)

Why should we care about # of plays run?

As explained in this article over at Philly Inferno, positive play differential is correlated with winning.  Looking purely at offensive plays run per game, I get a correlation value of .30 (off. plays run – Wins).

SImply put, more plays —-> more yards —-> more points.

However, I want to emphasize something that isn’t getting a lot of attention.  Emphasizing offensive pace is not enough to ensure you will run more plays.

In order to run more plays, you need to keep the ball.  In order to keep the ball, you need to convert on 3rd down.

If the Eagles can’t convert 3rd down’s at a high rate, it doesn’t matter how fast Chip wants to play.  Want to see the data?  I thought so.  Here is a chart of offensive plays per game against 3rd down conversion %.

Screen Shot 2013-07-16 at 12.11.42 PM


Given that I’ve probably lost a lot of readers by now, I’m going to come back to this point in another post.  For now, though, let’s leave it at this:

Last season, the Eagles converted 37.4% of 3rd downs.  If the team can’t improve on that measure (significantly), it won’t matter how badly Chip wants to run more plays.  

Defensive Plays Against

After last week’s fumble posts, I realized that no team-level analysis would be complete without equalizing for number of plays.  We saw that the distribution in forced fumbles (team totals) over the past ten years does not appear to be random and is certainly not normally distributed.

However, it’s possible that the teams forcing the most fumbles (Chicago) simply had more opportunities.  Basically, is there a “natural” fumble rate?  If so, then the difference in forced fumbles could be largely dependent on the number of defensive plays run.

In compiling the data for this problem, I noticed something interesting, which I’ve touched on previously (very lightly).  Specifically:

There is a surprising lack of variability in # of plays run from team to team.

In my post about potential injuries and Chip Kelly’s offense, the main takeaway was that even the “fastest-pace” offenses do not, on average, run a lot more plays than “slow-paced” offenses.  Today we are looking at # of defensive plays, but since every defensive play is also an offensive play (for the other team), the higher level distribution should be the similar.

Here are the average defensive plays run per game over the past 10 years (for each team, ordered highest to lowest):

Screen Shot 2013-07-15 at 10.53.08 AM

The Eagles rank 10th, with an average of 63.51 defensive plays per game.  However, the key is to look at the Max and Min of the table above.  Cleveland has faced the most plays, just under 65 per game.  Pittsburgh has faced the least, just under 60 per game.

So the long-term difference comes out to an average of just 5 plays per game.

Put differently, over the past 10 years, the defense that ran the MOST plays faced just 50 more plays than the defense that faced the fewest.  Note that this is an approximation since there are presumably rounding differences due to the use of averages rather than # of plays (only data available).

Going back to last week, it means that the variability in the number of forced fumbles for each team is likely NOT a function of # of plays (I say likely because the # of plays data does not include Special Teams, which could potentially skew the numbers, though I think that’s extremely unlikely.)  The correlation between average plays against and forced fumbles is -.03; so no connection.

While that’s not a huge surprise, the overall lack of variability in the # of plays data is.  Given how many different factors there are in every football game that affect the number of plays run, I expected to see a somewhat random but certainly WIDER distribution.

Perhaps it’s simply a result of the sample used (a big one, 10 years).  Over that length of time, teams are likely to cycle between “good” and “bad”, which may help the overall numbers even out.

Also, defenses have much less control over the number of plays they face than offenses have over the number of plays they run.  We can assume that “good” defenses will tend to face fewer plays than “bad” defenses, but that’s about as far as we can go.

Let’s look at individual season numbers.

Perhaps most importantly, the entire NFL is trending upward in terms of number of plays per game.  Here is a chart showing defensive plays per game over the past 10 years.  Remember that this is equivalent to offensive plays per game.

Screen Shot 2013-07-15 at 11.32.08 AM

If you look at the Y-Axis, you can see that the overall difference isn’t huge (the increase from 2003 to 2012 is just 1.57 plays per game.) However, the trend is unmistakable, with the past 4 seasons showing the most severe increases.

To this end, Chip Kelly’s offense (presumed to emphasize # of plays) is not revolutionary; it’s EVOLUTIONARY.  Tomorrow, I’ll take a detailed look at offensive plays run (same overall data, but different team data and we can draw more from it due to the “control” of the offense).  The key point here, though, is that Chip Kelly’s offense appears to be a natural extension of what we are already seeing in the league.  We have not, of course, actually seen what Kelly’s offense will look like; but it’s safe to say his “plan” fits firmly within the long-term NFL offensive progression.

Let’s take a quick look at some individual defensive play stats.

Over the past ten years:

– The 2010 Titans faced the most offensive plays, with an average of 71.2 per game.

– The 2004 Pittsburgh Steelers faced the fewest plays per game, with 55.6.

– The long-term, league-wide average is 62.9 defensive plays per game.

– The 2006 Eagles faced 65.8 plays per game, the most for the team over the past ten years.  The 2007 Eagles faced the fewest; 61.2.

– There is, not surprisingly, a positive correlation between defensive plays per game and points against, with a value of .28.

As I said above, tomorrow I’ll do a deep dive into OFFENSIVE plays per game, which should give us some idea of what we can expect from Chip Kelly.   I looked at defensive plays today since I had to address the # of Plays effect on forced fumbles (no effect).

Forced Fumbles Skill and Give/Take Recovery Rates

NOTE: This post got away from me a bit.  It’s a long one (1200+ words).  If you’re short on time, read the first section covering the 2012 Eagles, then skip to the very end to see the conclusions for today.

So yesterday I showed that Total Fumble Recovery Rates are both random and Normally distributed.  The takeaway was that there is a 97.5% chance that the Eagles will recover fumbles next season at a higher rate than they did this season.

That’s important, since it will almost definitely be a push in the positive direction for the team.  However, it’s far from the whole story.

There are a couple more aspects to cover.  I told you yesterday that we would take a look at recovery rates broken down by giveaways and takeaways, so I’ll do that first.  Then I’ll take a look at the more interesting question: Is Forcing Fumbles the result of luck or skill?  Feel free to skip to the end if that holds more interest for you.

Giveaway/Takeaway Recovery %

Not all fumbles are created equal.  For starters, see this article.  In general, it shows that recovery rates differ by TYPE of fumble.  For example, an offense is much more likely to recover a dropped snap than fumble by a receiver.  I won’t go into that much detail here; the linked article is worth a read for anyone interested.  Let’s take a look at the higher level stats though (Source: Teamrankings.com).

The long term NFL average recovery rate for “giveaway” fumbles is 52.31%.  That means that an offense, on average, recovers 52.31% of the fumbles it commits.

Conversely, a defense recovers, on average, 47.48% of the fumbles the OPPOSING offense commits.

Note that those two numbers do not add to exactly 100%, which I assume is due to fumbles that go out of bounds and are therefore recovered by neither team.

So what happened to the 2012 Eagles?

The Eagles, last season, recovered just 40.5% of the fumbles they committed.  That is roughly 12% below the expected recovery rate.  That’s bad.  However, it’s hardly a large enough deviation from the average to explain the overall performance. So…

The Eagles, last season, recovered just 25% of the fumbles the other team committed.  That is more than 22% below the expected recovery rate, a huge deviation.  In fact, over the past 10 years, only 4 teams have recovered opposing fumbles at a lower rate.  Previously, I highlighted that the Eagles only “gained” 5 turnovers on fumbles last season, FAR below the long-term league average of 11.  However, the team (according to ESPN) forced 17 fumbles, almost equal to the NFL long-term average of 17.15.

So the 2012 Eagles actually forced fumbles at a league average rate, but recovered them an extremely low percentage of the time (which is luck).  That is also extremely unlikely to happen again next year.

Is Forcing Fumbles Luck or Skill?

Now we’re getting to the more interesting stuff.  Recovering fumbles appears to be ENTIRELY luck.  However, if forcing fumbles is the result of skill, then teams have some control over the Fumble Differential equation.  So how do we know?

Similar to yesterday, we can’t know for sure without an extremely in-depth study and a lot more computing power than I have.  However, let’s look at a few different areas to get a good idea of what’s happening.

First up is team persistence.  If forcing fumbles is the result of skill, then we can expect teams that are “good” at it to continue being good at it year after year.  If it is a skill, then it is repeatable.

Here is the chart for forced fumbles, the axes are Year X and Year X+1.

Screen Shot 2013-07-12 at 12.56.10 PM

Doesn’t look like much.  The correlation value is .083, which is very small (obviously).

Just in case a year-to-year look was too susceptible to short-term variability, I also looked at the correlation between the 2-yr average and the following seasons total for each team.  Again, a value of .087, still very weak.

That’s certainly a strike against skill, but we’re not finished.

What about individual players?

We all remember watching Charles Tillman last year (he forced 10 fumbles).  Based on just last season, it seems like it’s safe to say he is actually “good” at forcing fumbles.  If he is “good”, than it’s a small logical step to say that others must be good as well.

If forcing fumbles is a skill, then we should see the “best” fumble forcers towards the top of the leaderboard each year.  Here is every player that forced 4 fumbles or more in a single season over the past 5 years.  Click to enlarge.  I’ve highlighted the players who appear on more than one list.

Screen Shot 2013-07-12 at 1.05.39 PM

It appears as though there are some players who consistently force a high number of fumbles (relative to the rest of the league).  However, notice the degree of variability in both the number of fumbles forced and the number of players who appear just once.   Some of you will have already noted, though, that what we should really be looking for is RATE.  Next week, I’ll try to equalize for that (thought of it too late for today’s post).

For now, I think it’s best to say that at an individual level, certain players appear to force fumbles more often than others, meaning it may be the result of skill.  However, given how many people are on the field at once, the relative impact of that player contribution may be small enough that it’s relatively insignificant to the overall game.  Not there yet, I’ll try to detail this more next week.

What about teams?

Certain teams appear to be better at forcing fumbles than others (the Bears are the obvious example).  The Bears look as though they’ve made forcing fumbles a large point of emphasis.  Looking at the overall totals from the last ten years bears this out.

Screen Shot 2013-07-12 at 1.13.55 PM

The Eagles are close the middle of the pack, having forced 164 fumbles over the past ten seasons.  The NFL Average is 166.9.

Does this mean the Bears are “better” at forcing fumbles than other teams?  Maybe.

As I showed above, there is really no persistence in the year-to-year forced fumble data.  However, the team totals data is Non-Normal and skewed negatively (meaning the distribution is thicker at the high-end than the low), as are the single season totals.  Despite the persistence values, it appears as though, at the margins, some teams/players do create fumbles at a relatively high rate (have to confirm though).

Similar to yesterday, I have now provided more questions than answers.  I will attempt to answer some of those next week.  Allow me though, to sum up in as clear an explanation as possible:

“Creating” fumble turnovers is the result of two discrete factors.

– Forcing the fumble.

– Recovering the fumble.

How do the relative correlations of these two factors compare?  In other words, to what degree is “fumbles gained” explained by each of these?

Here is Forcing Fumbles to Fumbles Gained:

Screen Shot 2013-07-12 at 1.48.06 PM

The correlation value is .676, very strong.

Here is Recovery rate to Fumbles gained:

Screen Shot 2013-07-12 at 1.51.40 PM

The correlation here is .59, also quite strong.

The difference in correlation strength is big enough to notice (.086), but relatively small.

Here’s the key part:

– The two factors (recovery rate and # forced) appear to be relatively equal in importance.

– Recovery rate is completely random.

– # of fumbles forced appears to be largely random (though skill is involved).  This needs more work, but putting those two factors together means:

While there may be some individual skill involved in forcing fumbles, when incorporated into the whole “fumble equation”, that contribution is small, and certainly less of a factor than random chance (luck).

Congratulations if you’ve read this far.  As is often the case, I ended up pretty far from where I intended to.

Fumble Luck…Again

Today, let’s go back to talking about fumbles and luck.  It occurred to me (or was pointed out), that there are two sides to the equation, and I’ve only really looked at one.  To refresh, I previously explained that “fumble problem” is largely overblown.

For individual players, there is some year-to-year persistence in fumble rate (fumbles/rushes), but it’s small.  Overall, there is a large amount of luck and natural variation in any particular player’s rate of fumbling.  Here is the post.

Additionally, I explained that while not all fumbles are equal, over the long-term we should expect every team to recover approximately 50%.  The counterpoint to this argument is that it’s about “hustle” and “heart”.  As you can imagine, I have little patience/regard for that side of things (in this specific scenario, not necessarily in everything).  However, I do not believe I actually took a look at the team-level statistics to back that assertion up.

Let’s look at that now.

First up, we’ll tackle the OVERALL team fumble recovery percentages.  Then I’ll break it into recovery percentages for giveaways and takeaways (much different situations which carry different expected recovery rates).  NOTE: I’ve decided to push the breakdowns until tomorrow, after reaching nearly 1000 words on the first section.

Team Fumble Recovery Percentage

This statistic (data taken from Teamrankings.com) covers the percentage of ALL fumbles that a team recovers.  This is very important for Eagles fans.

Last year, the team lost a historic amount of fumbles (22) and gained just 5 (NFL long-term average is 11).  Not coincidentally, the Eagles recovered just 35% of all fumbles last year, 4th worst in the league (Buffalo was worst with a rate of just 30.6%).

If Fumble Recovery % is truly random, then the Eagles can be expected to regress to the mean next year (50%), which would result in a better TO differential (which is highly correlated with Wins/Losses).

To get a look at the randomness, I’m going to look for year-to-year persistence.  This is where it gets tricky.  Due to the amount of players on NFL rosters and the constant turnover in personnel, just looking at a team’s year-to-year persistence isn’t enough to conclusively prove anything about fumble recovery %.  As usual, we will have to settle for a strong indication, since equalizing the data for every player and every play is far beyond the scope of anything I can (or want) to do.  Just know that this is an issue inherent in almost every NFL analytic breakdown or long-term analysis.

Before we look at the whole league, here are the Eagles’ yearly total fumble recovery percentages from 2003-2012:

Screen Shot 2013-07-11 at 4.18.26 PM

As expected, the annual totals seem to fluctuate relatively narrowly around the 50% mark.  Also of note is just how much worse last year was when compared to the previous 9 seasons.  This is a major reason why I expect improvement next year.  It’s not just that the Eagles were below the expected recovery %, it’s that they were FAR below it; it’s difficult (though far from impossible) to get much worse.

Now let’s look at the entire league.  Here is a graph showing the One Year persistence of Fumble Recovery Percentage for the entire league over the last 10 seasons.

Screen Shot 2013-07-11 at 4.28.41 PM

As you can see, there is no correlation (officially its -.06).

Due to the factors I cited above (roster changes, personnel differences, etc…), we can’t say definitively that fumble recovery % is all luck.  However, we can absolutely say that a team’s % for one year doesn’t tell us anything about it’s expected % next year.  In other words, the Eagles 35% recovery rate in 2012 doesn’t tell us anything about the 2013 season.

Mean Regression

The flip side of what I just said is that just because the Eagles were below the expected mark last year in no way means the team will be at or above the mark next year.  That’d be a bit like playing roulette and expecting the next roll to be black because the last 3 were red.  The overall idea is that each season’s recovery percentage is entirely independent.

So why do I expect the Eagles to recover?

Looking at the overall data, the standard deviation of all team recovery percentages over the last 10 years is 7.46%.  That means, if the data is random and Normally distributed, we should see approximately 68% of all individual team rates fall between 42.5% and 57.46% (1 standard deviation above and below the mean).

In our data, 220 teams fall within that range.

220 divided by 320 (our sample size) = .6875 or 68.75%

Additionally, we should expect 95% of all team rates fall within the range of +/- 2 standard deviations (35.07% – 64.927%).

In our data, we have 306 teams that fall within that range.

306 divided by 320 = .956 or 95.6%

Lastly, we should see 99.7% of teams to fall within 3 standard deviations of the mean.

In our data there is just 1 team that does not fall within the expected range (2011 Saints).

319/320 = .9968 or 99.7%

Summing up a bit:

– The data is random (no year-to-year persistence).

– The data is Normally distributed (hits the 68%/95%/99.7% mark almost exactly)

The 2012 Eagles recovery rate of 35% is almost exactly on the 2 standard deviation line.

Therefore, since we expect 95% of teams to fall within 2 standard deviations:

The 2013 Eagles have a 97.5% chance of recovering fumbles at a higher rate than they did last year.  (95% + half of the 5% distribution beyond 2 standard deviations)

One last bit for today, how does this rate business effect actual fumbles?

Here is a chart showing the correlation between fumble recovery rate and fumbles differential (Gained – Lost).  In other words, to what degree are “creating” fumble turnovers and “protecting the ball” a result of fumble recovery percentage (which is luck)?

Screen Shot 2013-07-11 at 4.58.15 PM

I’ll have more on this tomorrow, when I’ll take a more detailed look.  The chart above should give you a strong hint of where this is going though.

I’m going to stop there for today.  This section is a lot longer than I intended and I’m guessing very few people have the time/patience to read through a 3000 word post on expected fumble recovery rates.

Eagles Rebound Potential and Underplayed Risk

Bill Barnwell posted an article today at Grantland discussing which losing teams from last year are most likely to rebound next year.  He has the Eagles ranked 2nd, behind the Lions, in terms of which teams (6-10 or worse last year) are most likely to make the playoffs.

The case he makes is very similar to the case I’ve been making on this site for a long time, however, it’s interesting nonetheless.  Here is the Eagles section, I’ve bolded the most important points.  Afterwards, I’ll highlight something that isn’t getting enough discussion.

2. Philadelphia Eagles

Arguments in favor: Coaching voice change, massive turnover differential, fumble recovery rate, hidden special teams bounce back

Arguments against: Uncertainty related to coaching change, quarterback play

Although it seems difficult to remember, the Eagles were actually a passable team during the first half of last season. It was after firing defensive coordinator Juan Castillo during the team’s bye week that the Eagles quit on Andy Reid and collapsed, finishing 1-9. There’s still a good amount of the core that made the playoffs from 2008 to 2010 here, and they chose the high-risk, high-reward coaching option this offseason when they added Chip Kelly. Of all the teams on this list, it seems like the Eagles have the highest upside.

The statistical case backing them up is built upon an impossible turnover rate. Philadelphia was the other team with a minus-24 turnover margin, and by recovering 35 percent of the fumbles in their games, they finished just ahead of Kansas City, at 29th. Of course, Kelly has already become the first coach to teach Michael Vick how to avoid fumbling, so that should solve a good chunk of the problems there.

In all seriousness, Kelly’s insistence on getting the ball out quickly should reduce the likelihood of fumbles, and some simple variance should help push the Philadelphia offense back toward the middle of the pack. The defense should also deliver more than the eight interceptions it produced last year, so it’s not difficult to imagine the Eagles actually winning the turnover battle in 2013.

As for the “hidden” special teams numbers, that’s a Football Outsiders statistic that encapsulates how teams were impacted by special teams performance out of their control, including such obvious ones as how reliable field goal kickers and kickoff artists were against them. The Eagles were the fourth-most impacted team in football last year by those figures, with kickers notably going 27-for-29 on field goals against them in 2012.

Beating a dead horse:  The Eagles were VERY unlucky last year.  You’ll recognize the points above from previous articles here as well as from the dashboard prototype I threw up a couple of weeks ago.

However,

I wanted to also highlight the coaching risk.  As Bill says towards the top, the Eagles selected the high-RISK/high-reward option.  Eagles fans should not overlook the first part of that trade-off.  Kelly is a very exciting coach, and I’m encouraged by the fact that he’s willing to tear down conventional football wisdom in search of advantages.   The flip-side, though, is that he carries a higher risk of failure.

Make no mistake, if Kelly goes down, odds are he’s going down BIG-TIME.  This is not an approach that seems to lend itself to a series of mediocre seasons.  The problem with challenging convention is that if things start slowly, the external noise will be excruciatingly loud.  Old-school beat writers, ESPN talking-heads, and Joe Banner will attack Kelly and the Eagles like sharks around a bait-ball (Discovery channel reference!).

That risk and uncertainty poses the biggest potential hurdle for the team this year.  All things considered, the Eagles now look like an 8 or 9 win team (Vegas has the O/U at 7.5, so I’m bullish by one win).  Unfortunately, the Eagles also have perhaps the WIDEST expected range of outcomes.  It is completely conceivable for this team to win anywhere from 3 to 13 games next year.

I’m certainly betting on success; Kelly seems to know what he’s doing and is willing to adapt (rather than just trying to impose “his” way on the game, a la Steve Spurrier).  Just know that the natural payment for Kelly’s potential upside is a corresponding risk of spectacular failure…


Will the 2013 Eagles be “healthier”? Examining Injury counts and persistence.

One of the more widely reported reasons for the 2012 Eagles’ ineptitude was the number of significant injuries the team sustained.  Vick, Shady, D-Jax, and pretty much the entire Offensive Line were hit, each missing at least several games.  While it must have had a negative effect on last season, it’s reasonable to believe that the injuries from last season are ALSO a reason to be optimistic this year.  Surely this year’s team will not suffer as greatly.  With a healthy offensive line and full seasons out of the major playmakers, the 2013 Eagles should be in a position to rebound strongly.  Right?

Maybe, but caution is advised.

As is the often the case with anecdotal or out-of-context evidence, the complete data set tells a somewhat different story.  To get an idea of whether we should expect the Eagles to be “less injured” this year, we need to answer two questions:

– How injured were the 2012 Eagles?

– Is there any persistence in year-to-year injuries?

How injured were the 2012 Eagles?

I’m going to use two different numbers to illustrate.  The first is straightforward; it’s just the number of injury games lost by starters.  Rick Gosselin of the Dallas Morning News put together this chart that shows the relevant data for every team in the league during the 2012 season.  I’m going to assume his numbers are accurate.

The 2012 Eagles’ starters lost 63 games to injury last year.  That sounds like a lot, and while it is a lot in absolute terms, it is good enough (bad enough?) for just 25th in the league.  In other words, 7 teams lost starters to injury MORE often than the Eagles did last year.

Still, the Eagles were close to the bottom. As a result, it may be the case that we can expect the team to regress towards the league average next year, meaning fewer injuries and presumably better on-field performance.  Unfortunately, to get a look at this requires more than 1 years’ data, and I don’t have/can’t find charts like the one above for previous years.

For that we need to turn back to the Football Outsider’s Adjusted Games Lost measure that I referenced two weeks ago.  As I explained then, the AGL measure is a bit muddled.  It uses games missed as well as the injured player’s relative importance to quantify the effects of injury.  It also makes adjustments based on the injury report (Questionable, Probable, etc…) to account for the effect of a player participating at less than 100%.

As you can probably tell, there’s likely to be a lot of noise in that data.  Without seeing the exact formulation, I don’t have a sense for the specific weaknesses of the stat, but we can assume it’s far from perfect.

However, the data is available for the past 5 years and I think we can assume that the statistic has been measured consistently over that time period (i.e. no changes to the formula).  Therefore, we can use the stat to get an answer for both questions mentioned above.

– According to AGL, the 2012 Eagles measured 73.3 on the AGL scale.  The average AGL over the past 5 seasons is 56.4.

– The standard deviation for AGL over the past 5 years is 23.1.  Roughly 65% of teams over that span fall within 1 standard deviation of the average and 97% fall within 2 standard deviations, meaning the overall distribution is somewhat Normal.

What does this tell us?

Basically, it means the 2012 Eagles did suffer a relatively high number of serious injuries.  However, the team’s injury count was FAR from out of the ordinary.  Therefore, unlike other measures I’ve highlighted (fumbles, field position), we should NOT expect to see a big improvement to the 2013 Eagles purely as a result of mean-regression (better luck).

We’re not done yet though.

Remember that second question?  The one about persistence?

Well it turns out that, for reasons I haven’t fully analyzed, Adjusted Games Lost is a surprisingly persistent statistic.  That means there is a mildly strong (.30) correlation between a team’s AGL measure one year and its AGL count the following year.  The most obvious reason for this would be that certain players are “injury-prone” and are therefore likely to make continuous contributions to the AGL count each season. For example, if Mike Vick is your Quarterback, you will likely get a few bumps from him each season, as opposed to someone like Eli Manning, who has now started 146 consecutive games (including playoffs).  Regardless of the reasoning, the persistence tells us that since the Eagles were injury prone last year, they are somewhat likely to be injury-prone again this year.

Wrapping everything up, here’s the key takeaway:

There are a number of reasons to feel very good about the Eagles going into this year.  Assuming the team will be healthier, though, is not one of them.

Points Per Play; NFL Offensive Efficiency

A commenter suggested I take a look at Points per Play, so that’s what I’m doing today.  Note that I haven’t fully thought this through, so I’m going light on the analysis until I feel comfortable with the real meaning behind the data.

For starters, here are the highest points per play measures from the last ten years.  I should also note here that my data is different from the points/play and points/game data from teamrankings.com, and I haven’t yet figured out why.  For now, I’m going with mine, since I know how that was compiled, just know that there may be some small discrepancies (definitely some rounding differences).

As a reminder, Red highlighting means a team LOST the Super Bowl, Yellow means it Won, and the Eagles are in Green.

Screen Shot 2013-07-03 at 12.28.54 PM

Somewhat surprisingly, the 2007 Patriots do not rank #1, though a .559 mark is amazing.  Green Bay’s 2011 team sets the mark for offensive efficiency, in terms of maximizing the scoring impact of each play.

Regarding the Eagles, the 2009 team sets the mark for the Andy Reid Era, though the 2010 team was not far behind (.425).  Remember, both the 2009 and 2010 teams were 25% better than league average on offense.  The defense, on both teams, performed worse (+2%, -7%).

Is a high points per play measure good?

Obviously, it is.  However, the question I want to raise here is if the goal on offense should be two-fold.  Scoring points is, by far, the priority goal.  Given the choice, though, shouldn’t teams want to run a lot of plays?

In theory, running more plays takes more time off of the clock, meaning the opposing team’s offense gets less time on the field.  Commentators also frequently cite the fatigue impact of keeping the opposing defense on the field, but I don’t see a big advantage there, since presumably the offensive players get tired too (and don’t rotate like the defenders do).  It’s interesting that just 2 teams in the table above even reached the Super Bowl, with just 1 winning it.

What about the data?

Despite the logic above, there is a modest negative correlation between points per play and points allowed.  Here is the chart:

Screen Shot 2013-07-03 at 12.46.57 PM

The correlation value is -.24.

So teams that score efficiently, despite presumably giving the ball back to the other team fairly often, do not appear to allow more points as a result.

But why?

Perhaps scoring so efficiently puts a lot of pressure on the other team to keep up.  Therefore, despite receiving a lot of possessions, the other team is forced to make higher risk plays, leading to more negative plays, and potentially more turnovers.

Let’s take a look.  Here is the chart showing Points Per Play against Turnovers Created.

Screen Shot 2013-07-03 at 12.57.56 PM

Bingo.  The correlation value is a fairly strong .38.  UPDATE: There are definitely some causation issues here (i.e. forcing turnovers helps teams to score with fewer plays).  However, given the other offensive data I looked at, I feel comfortable saying it runs more in the direction cited above then in the reverse.  Just know that there is a kind of positive feedback loop at work here.

This goes a long way to explaining the apparent discrepancy I discussed above.  Teams that score frequently also give the opposing team a lot of possessions.  However, those opposing teams do not score more often as a result.  The reason (or A reason, at least), is that the opposing teams end up turning the ball over as they try to keep up.

This goes back to a post I did way back in January about team’s Pass Play Percentage.  The gist of that post was that teams may alter their game-plans too early when losing.  Even down by 2 touchdowns, teams should not abandon the run game until well into the 4th quarter.  By passing more to keep up, losing teams force themselves to successfully execute a strategy they’re not prepared for against a defense that is expecting pass.  The result, predictably, is a lot of turnovers, which obviously hurts the comeback effort.

That brings up the whole concept of Game Theory in run/pass selection, which I think is an extremely fertile area for NFL analytics and research.  Can’t address it in any more detail today though, so we’ll stop there.

Lastly, Happy Independence Day. I’m probably taking the rest of the week off since I won’t be near my computer much anyway.  Enjoy.

Big Play Offenses; Reid/Kelly Philosophical Differences

Little to no NFL news to really comment on, other than the Aaron Hernandez saga (which is so outrageous I’d just as soon never mention it).  However, rookies report to Eagles training camp on July 22, just 3 weeks from now; so things will pick up soon.

Today, I wanted to take a brief look at  “big-play” offenses.  In short, I think Chip Kelly’s offense will be far less reliant on big plays than Andy Reid’s did.  Andy Reid, despite being known as a “West-Coast” guy, emphasized the deep ball.  Going purely off memory, I believe this began with the TO acquisition, then continued thereafter.

I expect Chip Kelly’s offense to function much differently.  I think the Eagles will use D-Jax on deep routes mainly to stretch the defense and create space for both the run game and underneath TE routes.  Pure speculation at this point, but Andy liked to set things up for a deep shot, whereas I expect Chip to use the deep ball to open things up underneath.

Let’s back up for a second.

What makes a “big play” offense?

The easiest answer would be the obvious one: big plays.  It’s hard not to like deep strikes and long touchdowns.  With the Eagles’ offense though, they typically came at the expense of the ability to consistently gain first downs.  Is that a good trade-off?

Is there a way to quantify this?

Maybe.  As usual, I’ve attempted to create a shortcut.  Rather than look at the number of long scoring plays, passes over 20 yards, etc., I’ve taken total offensive yards and divided by the number of first downs.

For example, a 20 yard pass will only pick up 1 first down (20 yds/1st Down).  In contrast, three running plays of 4 yards each will also pick up 1 first down, but with just 12 yards (12 yds/1st Down).

Easy right?  There’s obviously other noise in here.  Penalties distort the overall numbers.  Negative plays (sacks) change the yards/1st down equation.

I should probably just attach the usual disclaimer: measure is not perfect, but I believe it gets at what we’re looking for.

The Results

From 2003-2012, the NFL average offensive yards per 1st down was 17.6.

So were the Eagles as “big play” dependent as many believe?

From 2003-2012, the Eagles averaged 18.2 yards per 1st down, the 3rd highest average in the league, behind only Tampa Bay and Tennessee (18.4).  Here is a table showing the entire league.

Screen Shot 2013-07-02 at 12.01.35 PM

Of note here, besides the Eagles high placement, are the teams ranked 31st and 32nd.  Over the past 10 years, the Colts and Patriots, teams known for their high-powered offense, have the lowest yards/first down averages.

The 2012 Patriots actually recored the LOWEST measure in the last 10 years; just 15.4 yards per first down.

Thinking through our perceptions of these teams, this makes a lot of sense.  When I picture Peyton Manning and Tom Brady offenses, I think of methodical movement down the field.  I do NOT think of spectacular deep throws (though both QBs can obviously do that as well).

The magnitude of the difference in averages above seems small.  Here, though, is another table.  This one shows the 15 HIGHEST averages of the past 10 seasons.

Screen Shot 2013-07-02 at 12.06.49 PM

The Eagles feature prominently, as do the 49ers and Titans.  The 2004 Eagles (Super Bowl with TO), averaged 18.7 yards per 1st down, a high measure, though not high enough to crack the table above.

So the numbers match our expectations.  Andy Reid’s Eagles did, in fact, rely more heavily on big plays than nearly any other team in the league.  Note that this is not inherently good or bad.  The correlation value of Yards/1st down to Points Scored is just .065, negligible and an indication of little to no connection.

UPDATE: Here is table showing yards/first down for each team during the Andy Reid era (’99 not included)

Screen Shot 2013-07-02 at 2.19.32 PMSo what does this mean going forwards?

The most drastic difference between Andy Reid and Chip Kelly is likely to be offensive philosophy (stating the obvious).  We don’t know what system Kelly will run, and it will likely depend on which QB wins the starting job.  However, as I’ve previously stated, I think the best proxy for what the new Eagles offense will look like is Penn State’s, followed closely by New England.  Going back to our league-wide chart above, we can see that New England’s offense, on a yards per 1st down basis, is about as far from the Eagles’ recent offense as possible.

Practically, this means:

– Longer drives

– Deep balls to set up the short game, rather than the opposite

– Lots of underneath/slot passes

– Fewer “exciting” plays, but more plays overall.  Learn to love the 5 yard pass.

– D-Jax will need to be a “team player”…he will likely be a secondary focus (at least his deep routes)

However, it does NOT mean:

– An expected difference in points scored.