I am returning to the draft discussion today, because I believe there is still useful information to be gleaned from the event. Today, we’re throwing positional impact away and focusing purely on the order that players were drafted and how they compared to others within their position group.
Before we get started, I want to refer us back to last year so you can get a sense of why this type of analysis is useful. It’s too early to judge last year’s draft class, but we definitely have a sense of each player and what the draft order would be if it was re-done with current information. Here, for example, are the top DTs from last year:
The “reach” measure is the same thing we looked at last week; a negative number there means the player was chosen EARLIER than “expected”. However, I want you to look at the “Pos % Score” column. Within the TPR model, each position has a different “maximum score” depending on the impact values I derive from the salary cap data. This
“Pos % Score” column tells us what percent of that “max score” each prospect attained. Basically, it’s an easy way to back out the positional impact adjustments and focus purely on the question “how good is this prospect?”.
There are a couple quick caveats. I don’t have the NFP ratings from last year, so those don’t figure into the scores. The TPR model does not account for “fit” or “role”, so a NT and a 4-3 DT will be compared against each other. However, since all we are trying to do is identify the “best potential player(s)”, regardless of role, I’m not too worried about either of those. In the future, I will try to increase the positional resolution of the model (I did so this year by splitting OLBs and MLBs) to better account for the “role/fit” issues.
Looking at the chart above, we can see that Fletcher Cox graded out as the best DT prospect, yet he was chosen AFTER Dontari Poe. At this moment, it looks like that was a big mistake by the Chiefs. Also note the very low rating for Derek Wolfe, who had a very weak rookie year.
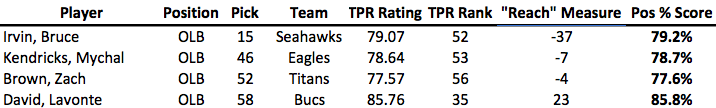
Now here is a chart of the OLBs:
Notice Lavonte David rated significantly higher than the 3 LBs chosen before him, and his rookie season bears that rating out.
Here are a couple more positions from last year, then I’ll move to this year. Notice both the order and absolute difference between players’ Pos % scores:
Above, we see the Brandon Weeden received an almost identical score as Brock Osweiler, but was taken 35 picks earlier. Also, we can clearly see the “tier” separation between prospects.

In this WR chart, compare Rueben Randle’s rating with that of either A.J. Jenkins or Brian Quick. While 49ers fans were probably surprised Jenkins couldn’t get on the field, this chart suggests he was drafted ahead of better prospects.
Ok, you get it. What about this year?
Lets start with the CBs. Please note that the only players I included are those that made the original TPR top 137:
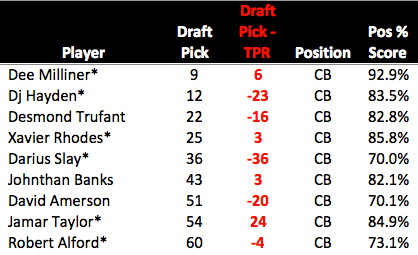
As you can see, there is some serious deviation from the pre-draft rankings. Darius Slay, in particular, looks like he was chosen too high, since both Banks and Taylor carry SIGNIFICANTLY higher grades. Obviously, these are not full-proof, but as we saw above they suggest the Lions (Slay) might have made a costly mistake.
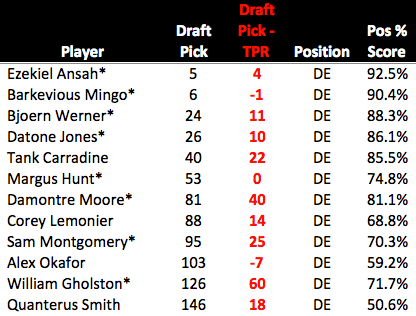
Here we have the DEs, and the variation is not nearly as severe as in the CB group. The only one who really jumps out is Margus Hunt, drafted above Damontre Moore. Hunt is a very high-risk/high-reward player, but note that the TPR rankings suggest this difference was due to Moore falling rather than Hunt being “reached” for. In fact, Hunt was drafted exactly where the TPR system rated him. Moore, however, fell 40 spots. William Gholston, near the bottom, looks to be a bit of a steal, especially compared to Alex Okafor, but since his grade is just 71.7%, he doesn’t project to be an impact player anyway.
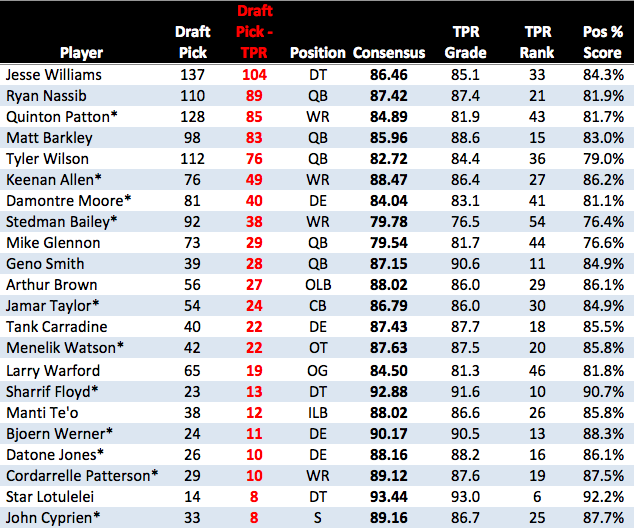
 The DTs are notable for their surprising LACK of deviation. Jesse Williams “fell” a lot, but as I said last week, that’s due to injury concerns and likely reflects a medical risk that can’t be quantified. Bennie Logan, unfortunately, rates as the biggest “reach” of the group, but note that his positional score is fairly close to the DTs drafted after him, meaning within the position group, he wasn’t a terrible pick. This would seem to suggest that the Eagles, despite their claim to draft pure “value”, likely made this pick based on “need”.
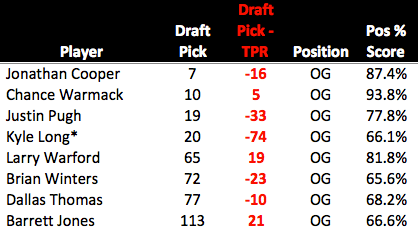 Looking at the Guard position, we see evidence of the Bears’ perplexing draft strategy. While Kyle Long “projects” as a potential OT in the future, this suggests that regardless of position, Larry Warford is much more likely to be a good player. The fact that he was also available more than 40 picks later is more damning evidence against the Bears’ perceived “value” in this draft. Again, Kyle Long might become a great player, all I’m saying is that the odds of that happening are less than the odds of Warford becoming a big contributor.
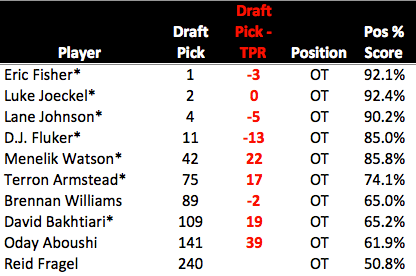 At the OT position, we can see why the Fisher/Joeckel/Johnson triumvirate was so sought after. Those three players represent the clear “top tier” at the OT position this year. Nothing to note after that, as the OTs were drafted in almost the exact order they “should” have been. However, we do see a big value difference if we look at DJ Fluker and Menelik Watson. While both players graded out similarly, Watson was taken 29 picks later, meaning he was a significantly better “value”.
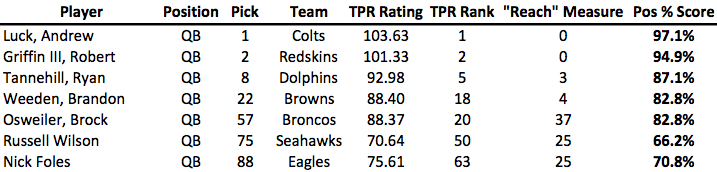
 Not too much to say here that hasn’t already been said. Mike Glennon is a very peculiar choice, but EJ Manuel represents the biggest risk. Either Manuel was rated by several teams to be the only QB worth a 1st round pick, or the Buffalo Bills were bluffed into making a poor decision. With a GM of questionable judgement and a rookie head coach, it’s likely they just screwed up.
This chart also throws the breaks on the Barkley hype. Again, the story with Barkley is “great value”, NOT “great QB”. His score is OK, but nothing special. FOr reference, it’s roughly equal to Brandon Weeden and Brock Osweiler from last year (though notably it’s much higher than Nick Foles’).
 Here are the TEs, and they tell a similar story as the DTs (as far as Eagles fans are concerned). I have Ertz rated as a slight reach, but within the TE class, he was picked where he should have been (though Escobar is clearly the better value).
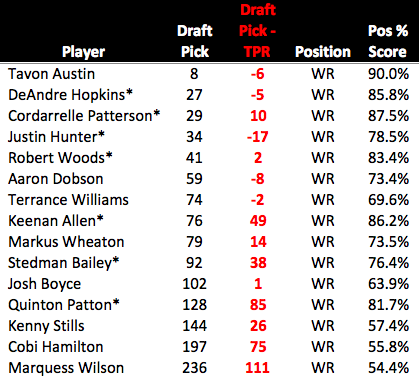
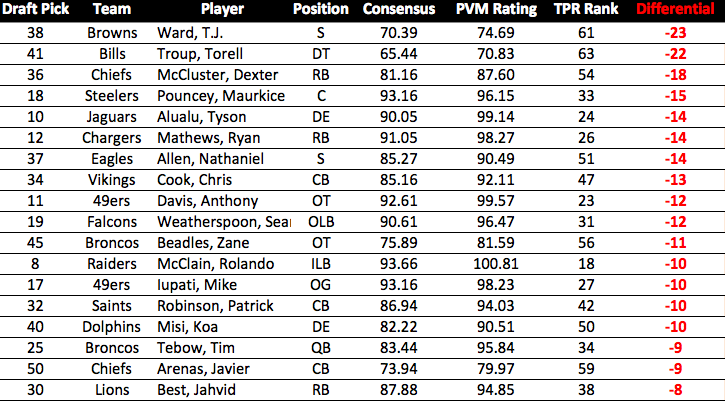
Without comment, below are some other positions. In general, it’s important to remember the larger point here. When a team “reaches” for someone, they are essentially saying “My evaluation of this kid is better than everyone else’s (or almost everyone)”, usually, they’re wrong.


 Overall, Andy’s reputation appears justified. 6 of his 13 teams here finished in the top 25% offensively. Three more finished better than average.

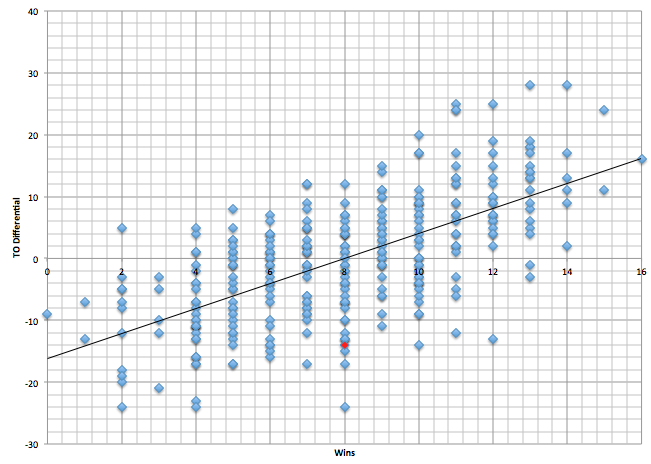
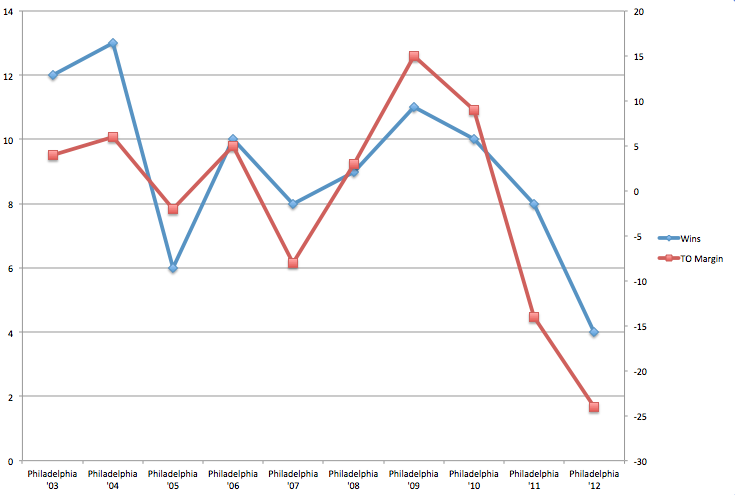
 Given what we know about the correlation between Point Differential and Wins, we should expect to see something resembling an inverse relationship here (i.e. PA goes up = Wins go down). We do see some of that, but from ’06-’09 that relationship doesn’t hold. The biggest takeaway here is just how bad (and anomalous) last year’s performance was. From 2003 to 20011, the average Points Against for the Eagles was just 20.11, with a high of 24.3 in 2005. Last year the team allowed 27.8 points per game, more than a full touchdown per game over the long-term average.