Draft Breakdown: 3rd Round (1999-2011)

Continuing our draft breakdown, here is the 3rd round.

Quick reminder:  To count as a starter, a player must have either started for 5 seasons or, if they haven’t been in the league that long, started for at least half of their career.  Not a bulletproof method (doesn’t account for the quality of the starters), but good enough to be informative.

Also, I’ve added rows for FBs and Punters, since there were a few of them drafted in this round.  Players and stats are from Pro-football-reference.com.

Here is the 3rd round chart (side-by-side with the 2nd round chart):

Screen Shot 2013-01-23 at 5.01.18 PM

– Notice that Tackles and Centers are still at or above 50% starters, compared to 70% for T/Cs taken in the 2nd round.

– The biggest decline was among DBs, with 20% of 3rd rounders starting compared to 51% for those drafted in the 2nd round.

– There was very little difference between 2nd round TEs (5/15/55) and 3rd round TEs (3/10/48).

– Less than 1 in 5 WRs taken ended up a starter.

Just a few more round to go, then I’ll try to put a graph together that lets us look at everything at once and identify the optimal rounds for each position.

Roster Breakdown update (Wait…the Falcons lost?)

So obviously I was a little distracted this morning (largely by CNN, though I’ll refrain from political discussion here.)  The Falcons, it turns out, really did lose that game (I wasn’t just hallucinating).  Sorry for the mix-up.  Here is the 49ers breakdown.  Note: doesn’t change the idea of the post at all, in fact reinforces it.  The 49ers have 7 players starting that they acquired with 1st round picks and only 4 that they drafted with 4th round picks or lower.

Screen Shot 2013-01-22 at 4.46.36 PM

Team Construction: Eagles vs Ravens/Falcons

Now that we know the Super Bowl participants, I thought it might be instructive to examine how each team was constructed and compare it to the Eagles current roster.

I used the depth charts from ESPN for each team, though with the Eagles I put the injured OL and DeSean back in.  Before we pick it apart, here is each starting line-up, with the source of each player listed.  As we’ve discussed, elite players come almost exclusively from the 1st and 2nd round, so I’ve bolded each player that was acquired with either a 1st or 2nd round pick (either through the draft or via trade).

Screen Shot 2013-01-22 at 12.54.46 PM

Screen Shot 2013-01-22 at 12.56.27 PM

Screen Shot 2013-01-22 at 12.57.33 PM

– We can immediately see the importance of hitting on your 1st round draft picks.  The Falcons have 7 starters who were acquired with 1st round picks.  The Ravens have 5.  The Eagles have just 3 4 (Peters should be listed as “Trade (1)”.  Needless to say, this year’s top pick is hugely important .

– The next BIG difference is the number of starters drafted in the 4th round or lower.  The Falcons have just 3 such players, the Ravens just 4 (including undrafted FAs).  The Eagles have 8!  As we’ve seen, late round picks provide depth players, not stars.  On average, these guys should not be starting.  Looking at the Ravens and Falcons starters, they are either high draft picks or free agents.  (Yes, some of the FAs were originally drafted with late round picks, but the idea is the teams only picked these players up after it was clear they were good.)

– This brings me to a big lesson for every fan.  Over the past few years, coming out of training camp, Eagles fans have gotten excited because a late-round pick has made the starting line-up (Matthews, Chaney, Coleman, Harris….)  Let’s stop that nonsense.  From now on I want everyone to try to remember:  If a rookie chosen with a late-round pick is starting out of camp, it’s much more likely that it is a glaring weakness than a “draft steal”.  

– The most unfortunate part of this examination is that it appears as though the Eagles will need at least 2-3 years to put a Super Bowl roster together, and that’s assuming they hit on almost every 1st and 2nd round pick.  Roseman really needs to be as good at talent evaluation as Lurie believes he is, because the Eagles can’t afford to waste any more top picks.

2nd Round breakdown 1999-2011

Last week we looked at the performance of 1st round draft picks made from 1999-2011.  Now let’s take a look at the 2nd round.

I’ve made a slight adjustment, grouping CBs and Ss together as DBs.  I did this because players frequently switch back and forth between these positions, and it’s tough to know what teams were projecting each player to play when they were drafted.

Below is the chart, I’ve placed it beside the 1st round chart to allow for easy comparison.

Screen Shot 2013-01-21 at 3.24.18 PM

Takeaways?

– It should come as no surprise that the % of All-Pros and Pro Bowl players has dropped precipitously.  As I showed in an earlier post, as a general rule, elite NFL players come from the 1st round.  Finding elite talent after that is fairly random.

– Second round LBs have almost the same odds of starting (54%) as do LBs taken in the first round (58%).  This certainly supports the Eagles past philosophy of avoiding LBs early in the draft.  However, it remains to be seen whether that holds past the 2nd round.

– Second round DEs start just 36% of the time, compared to 67% for 1st rounders.  This might be the most surprising result.  It appears as though if you need DE help, you have to get it in the 1st round.

– Conversely,  70% of Tackles taken in the 2nd round ended up as starters.  Additionally, almost the same percentage made a Pro Bowl as those take in the first round.  This would seem to suggest that if you can’t get an Elite OT prospect, likely in the top 10, than it is better to wait and take a T in round 2.

– 2nd round running backs have performed rather poorly.  Just 27% have become starters.  Shady is the exception to what should be a rule against drafting RBs in the 2nd.  RBs also were among the worst performers in the 1st round.

Soon we’ll add the 3rd round, which should allow us to start seeing trends.  Eventually, we’ll have a good idea of what positions the Eagles should target and when in the draft they should take them.  This won’t hold for their top pick, but the mid-late rounds are likely much more luck driven, in which case the team should look to historical data for guidance.


Chip Kelly and Two Point Conversions (hypothesis formulation)

UPDATE: The following is a case for occasionally attempting 2 pt conversions earlier in the game (when current coaches don’t typically try them), NOT going for two every time.  Should have made that clearer.

There’s an article up on Bleacher Report that talks about the possibility of Chip Kelly attempting 2-point conversions more often:

http://bleacherreport.com/articles/1489471-philadelphia-eagles-on-chip-kelly-and-two-point-conversions.

It’s interesting because it indirectly highlights how one of the biggest weaknesses (assumed) to Chip Kelly’s candidacy might also be one of the biggest strengths.  Kelly’s lack of NFL experience is presumed to increase the risk that he won’t be successful as a coach, however, all Eagles fans should hope that this also has the side effect of freeing Kelly from some prevailing NFL wisdom.  Specifically, I’m hoping Kelly takes a much more aggressive approach to both 2-point conversions.

As most fans know, the 2-point conversion gives the offense the ball at the 2-yard line, with one play to get in the end zone.  Much has been written about the optimal strategy regarding 2-point tries, with mixed opinions.

However, among NFL coaches, there seems to be a general consensus that you should NOT go for two unless it is absolutely necessary.  Assuming NFL coaches have actually looked at the statistics, we are led to believe that they are deferring to the historical success rate, which is in the 47%-48% range depending on which plays the data compilers include (botched kicks for instance).  A 48% success rate means the expected value of an extra point is higher, and therefore the correct play.

So why do I want Kelly to go for it more often?  I believe that the following three aspects, when aggregated, will lead to a higher than 50% success rate, meaning the expected value for the 2-point conversion will be higher than an extra point.

– If we assume that the league-wide success rate is 47-48%, then obviously some teams have better conversion rates.  I have not pulled the statistics (unfortunately they are not as readily available as most other measures), but I think it’s reasonable to suggest that a team with an above-average offense can expect to have an above-average conversion rate as well.  (If Chip Kelly does not put together a better-than-average offense, he will be a huge disappointment.)

– I’m also hypothesizing that the element of surprise via the no-huddle offense will itself add to the conversion success rate.  NFL defenses have been conditioned to leave the field after allowing a TD.  It’s a fairly small jump to assume that an NFL team using a hurry-up offense to attempt 2-point conversion, especially in the first half, will catch the defense off-guard.  The associated confusion/lack of defensive focus will presumably add to the likelihood of offensive success.  (Yes, if the Eagles always went for two, they would lose this element of the strategy.  That’s why its best implemented only occasionally.)

– Lastly, currently teams do not devote a significant amount of practice time towards the 2-point conversion.  Obviously, considering the rarity with which most teams attempt the play, devoting practice time to it likely isn’t worth the time spent.  However, if a team decided to implement the 2-point play more often, then it would therefore make sense to practice the 2-pt playbook more often.  Does anyone disagree that practicing the plays more often would make them more effective?

So…

I apologize for the lack of data here, but we’re dealing largely with a theory that hasn’t been tested in the NFL.  While the above analysis may seem a bit disjointed, the overall question is as follows:

Would the 3 factors mentioned above (strong offense, surprised defense, more practice) add more than 2%-3% to the overall 2 pt. conversion success rate?

If you believe the answer is yes, then hope that Chip Kelly’s ego is (as I suspect) big enough to give him the confidence to move strongly against prevailing NFL wisdom.

P.S. Unfortunately, the most easily predicted aspect of this plan is commentator reaction.  Even if it is statistically the right play, you can bet every announcer will talk about how “bold” and “risky” the decision is, as well as how stupid it is every time it doesn’t work.

Chip Kelly effects…

To date, I’ve avoided most coaching discussion, especially when it comes to comparing candidates.  The fact is, the only people who can begin to have an educated opinion on that subject are those who personally know each candidate.

Needless to say, I don’t have that knowledge, and neither to almost all of the sports writers who have been profiling the coaches.  Ignore everything you hear about who made the best hire…nobody in the press has any real knowledge of how each new coach will do.

However, now that a new coach has been found, we can talk a little about what it means for the team.

Immediately after Chip Kelly was hired, the discussion turned towards the QB situation.  For some reason (likely the need for a column topic), many commentators seem to believe that this somehow complicates the Eagles QB options.  It doesn’t.

– Michael Vick will NOT be the Eagles QB next year.  Much is being made of Kelly’s desire for mobile QBs, particularly those that can run an option-based scheme.  Those making this argument then jump to “Vick is a good runner so maybe Kelly will want him”.  This jump ignores a few aspects that each preclude Vick from being a “Chip Kelly” QB:

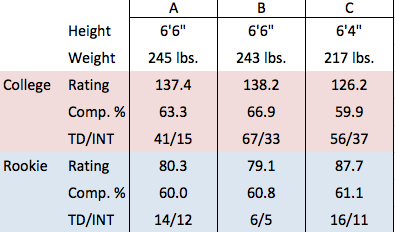
Vick takes a lot of sacks and has very poor pocket awareness.

Vick is one of the least accurate QBs in the league.

Vick turns the ball over a relatively high rate.

Ignoring Vick’s contract situation and age, I am confident that Kelly will review game tape of Vick and decide that he isn’t the guy to go with.  Anyone suggesting otherwise is, in my opinion, struggling to come up with things to talk about.

– This is NOT the end of Nick Foles.  While I don’t know how Kelly will adapt his offensive system in the NFL, my guess is that it will be a balanced (run-pass) but very fast paced scheme, much like the NE Patriots run.

People think of New England as a Pass-Heavy offense; this year they ranked 4th in the league in passing yards.  However, the Patriots also ranked 7th in the league in rushing yards.  

Also note that Tom Brady is one of the slowest QBs in the league and does not contribute anything significant to that rushing rank.  Yet, Brady is a perfect QB for that system because he:

– is very accurate with the ball and almost never throws an interception.  His 2.1% interception rate is the second lowest EVER. (Aaron Rodgers is 1st with a ridiculous 1.7% rate.)

– makes good decisions quickly, rarely forcing anything and consistently making the optimal read.

– has limited mobility but excellent pocket awareness, with a sack rate of just 4.84% (20th all-time).

While Nick Foles is obviously not as good as Tom Brady, he has a similar skill set.  As such, there is no reason to believe he can’t run a fast-paced, balanced offensive system (which I believe Kelly will attempt).  Also, with the RB talent that the Eagles have, I’m hopeful that Kelly will be able to construct a playbook that takes a lot of the pressure away from Foles.  I think there is a strong chance that Kelly reviews Foles’ performance this year and decides to make a go of it with him.

– Root for Geno Smith…but not for that reason.  Geno Smith has also begun to gain some traction with Eagles’ writers. Fortunately, by now most have dispelled the notion that Smith is a “running” QB.  He isn’t, although his race appears to be obscuring that fact for some.  However, he is very accurate, and has the size/athleticism/reputation that NFL teams love.  Therefore, with strong pre-draft workouts or a good combine performance, he has the potential to move up draft boards.  If he gets taken in the top 3, that means the Eagles have an excellent chance to get one of the two best fits for the team (Joeckel and Lotulelei, IMO).  Without a QB moving into the top 3, it gets a bit dicey and, as currently projected, there’s probably even odds that both Joeckel and Lotulelei are gone by #4.

If the current rumors regarding a move to a 3-4 defense are true, then missing out on both Lotulelei (the NT we’d need to run that scheme) and Joeckel would be a terrible outcome (fit wise).  Hopefully whoever the Eagles draft will be an impact player, but getting an impact player at a true position of need obviously will lead to a much quicker turnaround for the team.

So every Eagles fan should hope to see very positive Geno Smith stories between now and the draft.  As it happens, Smith’s skill-set would appear to be a great match for Andy Reid’s system, and we all know that Reid started his last job by drafting a QB with a top 5 pick.

P.S. now that I’ve offered completely subjective opinions/predictions, I’m sure Kelly will trade Foles, sign Vick to a long-term deal, and draft Smith to be a wildcat specialist…

Draft History Breakdown – 1st Round

Which positions are most likely to fail/succeed when taken in the first round?

I pulled the data and put together the chart shown below.  Note that counting someone as a “starter” is a bit subjective.  Inclusion in the below data means that a player started for at least 5 years in the league, or if they joined the league less than 5 years ago, has started for more than half the time.  However, just because they have started doesn’t mean they have been good.  Unfortunately, an analysis that deep will have to wait.  For now:

Screen Shot 2013-01-16 at 2.32.56 PM

Takeaways:

– It does appear as though the conventional wisdom regarding O-Linemen is correct.  They are typically safer picks, as evidenced by the high starter % for G/C/T.

– Choosing a QB is, statistically, a very bad decision.   Just 62% of the 37 QBs drafted in the first round ended up “starting” for a reasonable amount of time.  However, that number is definitely inflated, as the sunk cost aspect of choosing a QB with a high pick (at least until the most recent CBA) led teams to continue starting players who didn’t deserve to.

Unless you’ve got a top pick and there is a truly incredible prospect, you SHOULD NOT DRAFT A QB.  Hopefully Chip Kelly reads this before jumping on Geno Smith at #4.  That’s not to say he should draft him, only that he has to be blown away by Smith to make it a reasonable decision.

– LBs have proven to be the most difficult to peg.  The position has the lowest rate for starters out of the first round (58%), but the highest rates for All-Pros and Pro Bowls.  That tells me LBs are perhaps the hardest players to evaluate coming into the league.

We’ll take a look at the other rounds soon, and eventually put it all together for a complete draft guide, but for now it appears as though there is clear split regarding the odds of success for draft picks (in the first round):

– O-Line, TE, DBs (Safer)

– DEs, DTs, LBs, QBs, RBs (Riskier)


More on Foles

After putting yesterday’s post together and getting a helpful twitter suggestion, I decided to take a look at how Foles stacked up against a larger sample of rookie quarterbacks.

I pulled together the rookie stats for every quarterback drafted in the first round since 1999.  Including Nick Foles (I realize he wasn’t a first round pick), that gave me 38 QBs.  I then eliminated 7 QBs that played in fewer than 5 games in their rookie seasons (Losman, Russell, Grossman, Rodgers, Pennington, Rivers, Quinn.)  I did not include this year’s other rookies, as we don’t know yet how their career’s will progress, though it certainly looks like each will be successful.

That leaves us with 31 QB’s.  Here is the sample charted by rookie Passer Rating, with Nick Foles in red:

Screen Shot 2013-01-15 at 12.46.42 PM

The interesting takeaway is that there are very few “false positives”.  Of the 8 QBs with higher rookie ratings than Foles, the closest there is to a “bust” is Tim Tebow, who is still relatively young and has a chance (however slight) to turn his career around.  Jake Locker doesn’t really impress me, but he did make progress this year and it’s fair to say the jury is still out on him (also note that he played in just 5 games his rookie year, the minimum for the sample.)

Other notes from that chart:

-Eli Manning’s rookie rating, with 9 games played, was just 55.4.

-Donovan McNabb’s was just 60.1.

Now let’s look at completion percentage:

Screen Shot 2013-01-15 at 1.04.22 PM

We see a similar story as with the Rating graph.  Only Big Ben, Culpepper, Matt Ryan, and Carson Palmer completed a higher percentage of throws in their rookie seasons.

If Foles had been taken in the first round, there wouldn’t be any talk of even looking at other potential quarterbacks heading into next year.  Additionally, he would have played a much larger role in the head coaching search, and we’d be hearing stories of how “Coach X is really excited to work with Foles”.

The fact is, statistically, Foles had a VERY strong rookie season, especially when one considers the patchwork O-Line he was playing behind.

Now I’ll get back to the draft…


Guess who…

Let’s take a break from the draft research and play a quick game.  See if you can identify the following three quarterbacks.

Screen Shot 2013-01-14 at 1.38.18 PM

Better yet, with no additional information, which one would you choose?

Any answer is right, because there is almost nothing there to differentiate the three players.   So who are they?

Most serious Eagles fans will know that Player B is Nick Foles.  His 6/5 td-int ratio is a giveaway.

The other two players will both be leading their teams this weekend in the NFC/AFC title games.  Player A is Joe Flacco, player C is Matt Ryan.

Anyone out there who doesn’t want Nick Foles to start next year?  Otherwise, feel free to join me on the bandwagon.  Still plenty of room.

Best drafting teams from 1999-2011…

Continuing our draft research, I attempted to create a method for determining which teams were the best and worst at drafting over Andy Reid’s tenure, with 2012 excluded since it’s too early to judge most of this year’s rookies.

Before the results, I have to explain how I got there (feel free to skip if you don’t care about the methodology):

First, in order to evaluate players, I used the Career Approximate Value statistic from Pro-Football-Reference.com.  This is FAR from a perfect measure, but I don’t know of any better way to compare player production for different positions.

Second, Career AV is a cumulative measure.  So players with longer careers will tend to have higher Career AVs.  To compensate for this, I divided each players CAV by the number of seasons they were in the NFL.  It’s important to note that this skews the data in favor of players who were productive over long periods of time versus those (i.e. Shawn Andrews) who were spectacular for a short time and non-existent the rest.

I then totaled those measures for each team, giving us a rough idea of the amount of production derived from each team’s drafts.

However, we aren’t done yet.  In order to adjust for the differing value of each draft pick, I calculated the average point value of each round (according to basic NFL draft chart), then used those measures to calculate the total “Draft Points” used by each team.  That way, teams that use a lot of 1st round picks to find production will not be equal to teams that found the same production with lesser picks.

Finally, I divided the Total Adjusted CAV for each team by the total Draft Points used to obtain that production.

The results?  Some expected, some shocking.  Here are the ten teams (in order) that ranked best from 1999-2011 in identifying and selecting productive players in the draft:

Tennessee, Chicago, Indy, Dallas, Green Bay, Atlanta, Carolina, San Diego, Philadelphia (9th), Houston.

Here are the ten worst (ordered worst to best):

Detroit, St. Louis, Oakland, San Fran, Washington, Minnesota, Kansas City, Cincinnati, Buffalo, Tampa Bay.

Note: This is an attempt to rank teams based on the efficiency with which each used their draft picks.

For the skeptics: A first glance at the best and worst drafting teams would lead one to believe there is a flaw in the methodology.  The Titans?  Really?  On a hunch, I graphed each team’s Adjusted AV/Draft Point (the measure I walked through above) against each team’s wins over the subject time period (Texans not included since they were not in the league for the whole time period).  Here is the chart:

Screen Shot 2013-01-11 at 4.06.26 PM

Interesting, right?  We see a clear positive correlation between the drafting measure we calculated and team performance (wins).  Not only that, but it’s a pretty strong relationship (coefficient of .55).

This doesn’t prove the effectiveness of my methodology, but it is certainly what we would expect to see given an accurate measure of drafting skill.  Teams that draft better should, on average, perform better on the field.

Here is a graphic showing each team’s Adjusted AV per Draft Point, with the Eagles highlighted in red.

Screen Shot 2013-01-11 at 4.15.42 PM

So what did we learn?  The Eagles actually have been pretty good at using draft picks since 1999 (and Detroit has been absolutely terrible).  Keep in mind that this just measures a team’s ability to find productive players with each pick. It doesn’t account for whether picks achieved success while with the team that drafted them.  For instance, the Eagles get credit for Derrick Burgess, even though most of his success came with another team.

Also remember that this is per pick, not total production (i.e. New England had the 4th highest total Adjusted AV, but also used the second most picks to get there).

I’ll be digging further into the data to see what else we can get out of it, but I believe we can drop the whole “Andy Reid sucked at drafting” meme.  It’s also a good reminder that as much as some fans hated Reid, over his tenure here, most other franchises were much worse.