Importance of First Round (Chart as promised)

Below is the chart I promised yesterday.  The data is from Pro-football-reference.com and it does not include the supplemental draft.  The data is total occurrences, not individual players.  So 108 All-Pro mentions includes multiples from players who made it more than once; it does NOT mean 108 different players made the All-Pro 1st team.

Screen Shot 2013-01-10 at 2.25.04 PM

I doubt anyone is overly surprised, but it certainly illustrates the importance of 1st round picks.  Also keep in mind that there were less 1st round picks made overall than any other round other than the 2nd.  So on a percentage basis, the data would be even more skewed towards the first round.

Obviously there is some skew to consider, since a players get longer/more opportunities if they are drafted early.  However, given how many variables go into talent evaluation and performance projection, it’s pretty clear to see that NFL scouts do a very good job of identifying the most talented players.

It is extremely rare for an elite player to drop beyond the second round.  We do not yet know if there is persistent “market-beating” talent among GMs or whether an “index-tracking” approach would be better off.

I use those terms because I believe the stock market provides a good model of how to view drafting in professional sports.  Just as it’s extremely difficult to consistently beat the market trading individual stocks, I expect it is also very difficult to draft consistently better than the “consensus” best available.  Unfortunately, without seeing every team’s draft board, we don’t know the true “consensus” rankings.  Therefore, we’ll try a few different ways of measuring draft skill, starting tomorrow.

Food for thought:

Over the subject time period, here are the five teams with the most and least draft picks (Houston not included):

Most-

Tennessee (122), Green Bay (119), New England (118), Philadelphia (116), San Fran (114).

Least-

New Orleans (83), NY Jets (84), Washington (87), Miami (96), Detroit (96)


New Orleans (


Quick draft history note

Going through draft data since 1999 (Reid’s first draft), figured I’d throw out a quick note:

– From 1999-2011, the average number of draft picks per team was just over 104.   (Note: the Texans were not included in that count since they haven’t existed that long.)

– The Eagles made 116 selections over that timeframe.  The Patriots, famous for accumulating picks, made just two more than the Eagles with 118.

– The Titans made 122 picks, leading the league.

– The Saints and Jets made the fewest picks, with 83 and 84.

In total, the players drafted from 1999-2011 were named to the All-Pro first team 171 times. 108 of those were by players drafted in the first round, or an astounding 63%.   I’ll do a graph on this soon, but needless to say, if you want an elite player, you can’t afford to miss with 1st round picks.

For instance, just 21 All-Pro first team mentions came from the second round, or just over 12%.

Note: All data came from pro-football-reference.com.

More reasons for hope…examining turnover luck and field position.

I’ve been digging through a lot of data while putting together a database that we can examine for interesting information.  In the process, I’ve come across some encouraging news for the Eagles heading into next year.

First, a few stats from this year:

– According to Football Outsiders, the Eagles ranked 14th in yards per offensive drive (35.51 ypd).

– The team also ranked 14th in defensive yards per drive (30.50 ypd), or yards allowed per drive.

Neither of those is great, but if you looked at nothing besides those measures, you’d be very surprised that the team finished 28th in the league.  Now let’s look at two related stats (also from Football Outsiders):

– The Eagles ranked 24th in offensive points per drive (1.54).

– The team ranked 28th in points allowed per drive (2.21).

Those numbers make it a bit easier to see why the team’s record was so bad.  But why the discrepancy?  Why were the Eagles so much worse than almost every other team at converting yards to points?

It will be news to almost nobody that the answer lies mainly in two stats, turnovers and field position.  However, most people don’t fully appreciate just how bad the team’s performance was in those areas this year.  Here are a few more stats from this year before we get to the hopeful part (I promise there is one).  Over the past ten years:

– Many people know the Eagles had the worst TO differential of any team (-24, tied with this year’s Chiefs and the ’04 Rams).

– However, a big reason for this was that the team lost 22 fumbles this year.  Over that time frame, only the ’07 Ravens were worse.  Conversely, the Eagles threw 15 interceptions this year, which is nothing to get too upset over.

–  The team only had 13 takeaways, behind only the ’06 Redskins for least since 2003.

–  The Eagles average starting field position (25.19 yard line) ranked 27th in the league this year.

– Eagles opponent’s started with better field position (31.86 yard line) than anyone else in the league.

– Combined, the net result of  -6.67 yards was by far the worst difference in the league (St. Louis was next with -5.87.)  In clearer terms, the Eagles had to go nearly 7 more yards each drive than their opponents in order to find the end zone or field goal range.

So we have a team that lost more fumbles and created fewer turnovers than almost any other team in recent history.  That, along with poor special teams play, led to the worst field position differential in the league by far, which goes a long way towards explaining why the offense and defense could finish in the middle of the pack for yards per drive without scoring/preventing points.

It also explains how Nick Foles could look good (i.e. move the offense) without better results.  He almost literally could not have received less help from the rest of the team by way of field position or extra possessions.

So where’s the hope I promised?  For that we have to re-engage our old friend, the correlation analysis.  Here’s what it tells us:

– Earlier this year, we looked at individual player fumbling rates and found that most of it is the result of luck.  In other words, be very skeptical whenever you hear that a player has a “fumbling problem”.  Therefore, it should come as no surprise that the same holds true for teams.

Using every team’s performance from the last ten years and measuring lost fumbles from one year to the next, I derived a correlation coefficient of .0837 (very weak).  This means that although the Eagles had a historically bad year (losing 22 fumbles), there is no reason to expect next year will be anywhere near as bad.

A little mean reversion will go a long way towards improving the TO differential. (Also, see the fumbling recovery rate post from earlier this year.)

– Similarly, I ran the same analysis on takeaways, and found a similarly weak correlation coefficient of .0838.  Turns out, there is very little persistence in takeaways as well.  Therefore, we have no reason to expect the Eagles to be as impotent next year when it comes to creating turnovers as they were this year.

For those of you that are skeptical, here is the data chart.  Takeaways are on the Y axis, with takeaways the following season on the X.

Screen Shot 2013-01-08 at 1.00.02 PM

Note:  I am not suggesting that both takeaways and fumbles are COMPLETELY luck.  At the margins, there are players who are clearly good at not fumbling and similarly I expect that there are a few teams/players that are persistently good at forcing turnovers.  However, overall, those teams/players are exceptions.

Wrapping up, by examining data from the last 10 years, we can see some evidence that suggests that this year, the Eagles were both a bad team AND a very unlucky one.  While there’s no guarantee they become a good team next year, I feel comfortable saying it is likely they won’t be as unlucky.

Illustrating the Roster

Everyone likes graphics, so I put one together showing the holes in the current Eagles roster (only starters.)  I realize not every player will return, but as of this moment, this is what it looks like. First, the offense:

Screen Shot 2013-01-06 at 6.09.55 PM

There’s going to be some disagreement, but on the whole most of the Eagles are easy to pin.

– Kelce is a question-mark because of his injury, but he certainly has the potential to be an above-average center.

– Celek is a bit of a fan favorite, but the fact is there is a clear upper-echelon among league TEs and he isn’t among them.

– Foles is an unknown, but I see no reason why he can’t be at least a league-average QB.  Obviously it’s hard to win if that spot isn’t green, but that’s a separate issue.

– Kelly made some progress, but I don’t see his ceiling as anything higher than league average and think it’s more likely he ends up as a career depth player.

Overall, a pretty good lineup, and the biggest reason why the Eagles have a chance to rebound quickly from this year.

Unfortunately, we do have to look at the defense:

Screen Shot 2013-01-06 at 6.18.30 PM

Much more to debate here, but at the very least, there is far too much red in this picture.

– Kendricks gets a rainbow because he’s shown signs of being everything from a scrub to a pro bowler.  I think it’s likely he ends up as a slightly above-average LB, maybe more, but he has some big weaknesses that could hold him back.

– Can’t believe Nnamdi gets the yellow/red, but there’s really no way around it after the season he had.  Maybe he bounces back, but it won’t be for the Eagles.

– This is the first time since 2006 that Cole doesn’t grade as well above-average, but he had a very quiet year.  Showed very little ability to beat his man one-on-one (which he used to be great at.)  Let’s hope it was a fluke, but at age 30 (31 next year) that may be wishful thinking.

Now look at both pictures and it should be pretty easy to see why I’d like the Eagles to use the #4 pick on the best defensive player available (hopefully the DT.)  As nice as a stud OT would be, the talent level on defense is far too low.  Unfortunately, there’s no top safety or corner this year, so we could be looking at a trade down situation.

New coach might like to make a splash with such a high draft pick, but the best way to build the team could very well be moving down, picking up extra picks, then drafting a safety/lb/corner where it makes sense.  It’d be a very unsatisfying use of the #4 overall pick, but then again, watching a similarly bad defense next year would be far worse than unsatisfying.

Week 17: Eagles vs. Giants Rewind

Two notes before we get to it:

1) There was almost nothing positive to take from that game.  On review, it was as bad as it seemed live (maybe even worse since the lack of effort was abundantly clear when each player was viewed individually.)

2) There weren’t many players of interest for the team’s future due to injuries.

In light of that, here are the Rewind thoughts, followed by some pictures:

– Anyone who watched Vick on Sunday should have a newfound appreciation for Nick Foles.  There are few things as annoying for a football fan than to watch the QB repeatedly miss open receivers.  The super-athletic “mobile” QB’s can have their speed, I’ll take accuracy over running any day.

LeSean McCoy is crazy good.  The lone bright spot this week, McCoy might have single-handedly made the Eagles head coaching job the most attractive available.  I have mixed feelings on Chip Kelly, but there’s no doubt that he must be salivating at the prospect of having McCoy/Brown as his backfield.

As far as turnaround plans go, the Eagles is fairly simple:  Let McCoy carry the offense behind a healthy line while you fix the defense and get a longer look at Foles.

– I mentioned that Graham would be a focus while reviewing the tape, so…he played an OK game.  Wasn’t nearly as disruptive as he has been over the past few weeks, but the Giants are among the toughest match-ups in the league for pass rushers.  Graham made a few nice plays and repeatedly drove his blocker backwards, but couldn’t get off the block to finish the job.  However, given the fact that everyone else on the defense either mailed it in or didn’t have the talent to be on the field in the first place, it’s probably not a game to draw anything significant from.

– The LBs for the Eagles had an absolutely embarrassing performance.  I’d prefer not to mention their names in the hope that they will just disappear from both the roster and my memory.  Demeco and Mychael can come back, everyone else needs to go.   Complete lack of ability.

Now the illustrations:

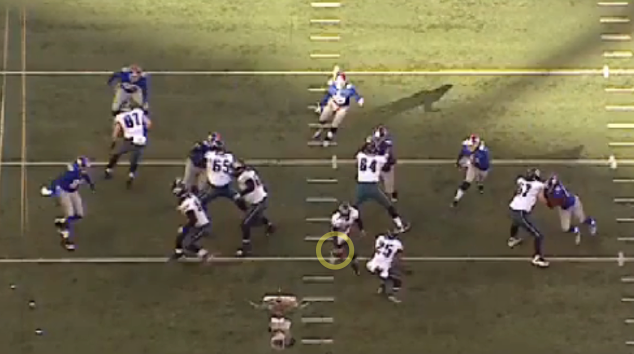
Hand-off to nobody – One of the most frustrating aspects of the Vick era can be seen below.  Most readers here will recognize it, since we’ve seen it much more often than anyone should.  Vick either fakes the hand-off with nobody in the backfield, or does it to the side opposite the runner.

Screen Shot 2013-01-04 at 2.04.08 PM

Running PA when you’re not a running team is problematic enough, but doing it without even having a RB to fake-accept the hand-off is downright obnoxious.  Normally I’d chalk this up to a miscommunication, but it’s happened often enough that simple miscommunication seems unlikely.  Additionally, though I haven’t gone back and checked, I don’t recall seeing this from Foles, which indicates it’s not by design.  Needless to say, I’m stumped.  Regardless, with Vick gone, let’s hope we never see it again.

Dear Colt, thanks for playing, better luck next career.

Though there were lots of plays that highlighted the myriad defensive holes of the Eagles, this one is particularly galling because of the situation.  The team is already losing 28-7.  There are just 10 seconds left in the half and the Giants are already in field goal range.  That means this is a pretty straightforward play for the defense:  KEEP THEM OUT OF THE END ZONE.  The Giants have 3 TOs, but with only 10 seconds remaining, they likely only have two plays left, this one and a field goal attempt.

The Eagles recognize the situation and line up accordingly in a quarters-zone prevent defense.  That means the two safeties and outside corners essentially split the field into four slices, with each of them responsible for one.   Meanwhile, the two LBs and Boykin (slot corner) each have an underneath zone.  The goal of the play is not necessarily to prevent a completion, it’s simply to force the Giants to complete a ball in bounds and tackle them in play, eliminating a TD as a possibility and forcing a field goal.  The DTs run a twist, but it doesn’t produce much pressure.

Screen Shot 2013-01-04 at 2.52.57 PM

With the above picture and situation in mind, lets jump to later in the play:

Screen Shot 2013-01-04 at 2.39.12 PM

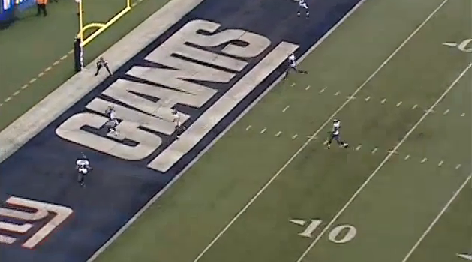
This is the moment of the catch and the only correct response is either What?!? or various profanities strung together.  To recap, the Eagles’ only goal on this play was to prevent a receiver from getting behind them for a TD.  Not only does that happen, but Colt Anderson manages to wind up nearly 5 yards under his man at the catch!

So how did it happen?  Colt Anderson had a brain-cramp.

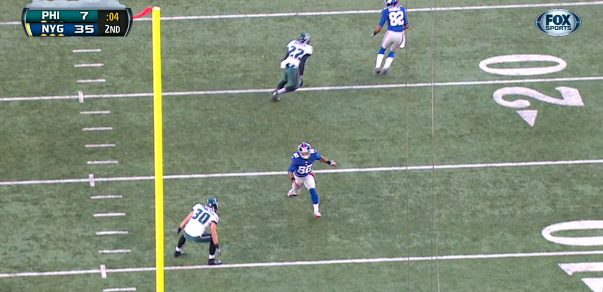
If you look back at the initial diagram, Cruz runs a seem, but stutter-steps twice.  His second stutter-step occurs just in front of Colt and causes Anderson to freeze.  The only thing Anderson CAN NOT do in this situation is stop moving and let Cruz behind him, so of course that’s exactly what he does.  Here is Colt’s freeze:

Screen Shot 2013-01-04 at 3.11.36 PM

An absolute disaster of a play for Colt and the Eagles, though it obviously wouldn’t have changed the outcome.  Even if Anderson gets thrown by the stutter-step, he absolutely MUST maintain his momentum moving backwards.  That way, even if he guesses wrong on which direction Cruz is going, he has a chance to recover.  Instead, he stands still, while Cruz is still near full-speed.  The chances of Colt catching Cruz after giving him a head start?  Absolutely none.  We knew Anderson didn’t have the speed to run with fast receivers, but we’ve also learned that he doesn’t know how to compensate for it.

The Wheel Route strikes again.

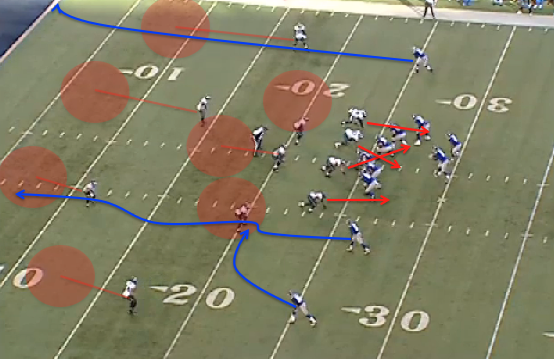
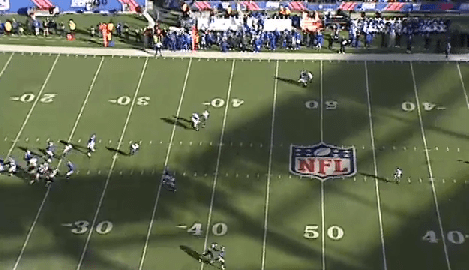
This play is from earlier in the game, when the outcome was still technically in doubt.  The Giants are up 14-0 with 3:26 left to go in the 1st quarter.  3rd down with 4 yards to go.   The result of the play is a 41 yard completion to Bradshaw out of the backfield.  Here is the pre-snap setup:

Screen Shot 2013-01-04 at 3.36.52 PM

Nothing too crazy going on, though there is one big note to make.  See Colt Anderson’s assignment (safety to the bottom of the screen)?  Immediately after the snap, Colt moves to double-team the slot receiver.  Not sure exactly what Todd Bowles saw to make him call this up, but regardless, it results in a huge hole that the Giants end up exploiting.  UPDATE: To clarify: this looks a bit like robber coverage with Colt playing an underneath zone.  However, at the snap Anderson moves full speed at the slot WR with no regard to his route.  Therefore, it seems more like a double-team than a zone read that Anderson saw and reacted to.

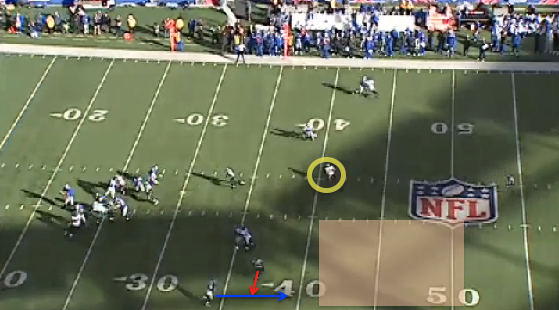
Below is the key moment of the play.  Say what you want about Eli Manning, but the guy is very good at manipulating defenses, especially with the pump-fake.  Here, he uses it perfectly to shift Demeco Ryan’s coverage angle, resulting in the separation he needs to get the ball over top to Bradshaw.  I’ve highlighted Demeco’s angle as he falls for the pump-fake and attacks where he thinks the ball is going.  Also highlighted is Colt Anderson and the space he vacated, resulting in a huge window for Manning to deliver the ball.

Screen Shot 2013-01-04 at 3.47.06 PM

And finally, below, we see Bradshaw as he gets behind Ryans.

Screen Shot 2013-01-04 at 3.23.58 PM

The Wheel Route is one the Giants have used with great effect against the Eagles over the past few years.  The key is that it forces a LB into coverage, where they are typically uncomfortable, and then increases the pressure on said LB through the pump-fake.  The fakes are hard enough for CBs to resist, but even more difficult for LBs purely because they aren’t in coverage as often.  Normally, the safety would provide deep help and ideally break up the play, but Colt left for the double-team, resulting in a very tough matchup for Demeco and 41 yards for the Giants. This particular play is not an indictment of Colt.  It appeared as though the double-team was 100% by design.

Also of note: Kurt Coleman (the deep safety) misses a tackle on Bradshaw after the reception and DRC makes the tackle after chasing the play from more than 15 yards back.

End of the Rewinds

That’s the end of the Eagles Game Rewinds for this year.  However, I’ll probably diagram a few big plays from the playoff games.

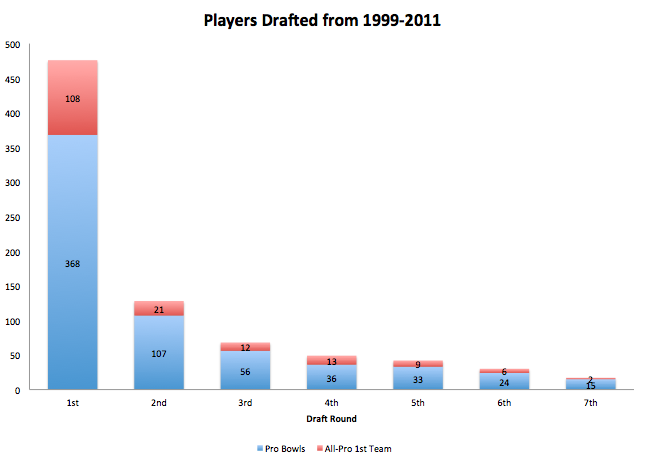
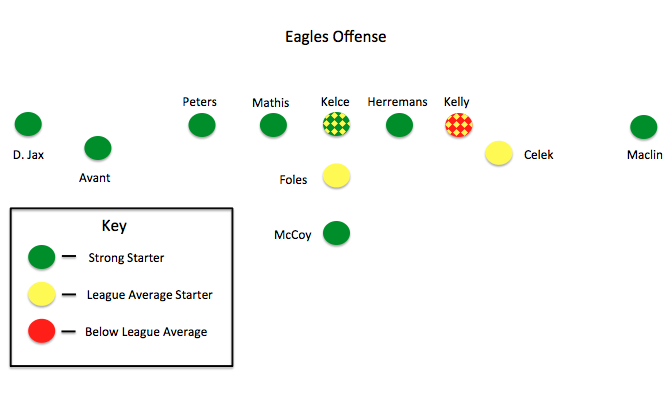
Meanwhile, we’ll shift to a roster evaluation and see what the weaknesses are heading into the offseason before an in-depth dive into draft history to see how much is luck vs. skill.

More on Post-4 Win Success

Regarding yesterday’s post, two of the 10+ win teams following a 4 win season were under new coaches:

NY Jets ’06 – Eric Mangini was hired and led the team to 10 wins.  However, his tenure thereafter was mixed and I don’t think any Eagles fan wants a similar experience.

Atlanta ’08 – The team won 11 games in Mike Smith’s first year.  Also Matt Ryan’s rookie year.  This is really the gold standard for 4 win turnarounds.

Other notable new-coach turnarounds:

Miami ’08 – Biggest turnaround in NFL history, improved from 1-15 to 11-5.  Tony Sparano’s first year, as well as Bill Parcells’ first year leading the front office.

Saints ’06 – Team hired Sean Payton and Drew Brees, improving to 10 wins from just 3 the previous season.

Colts ’12 – Obviously Andrew Luck’s rookie year, team improved from 2 wins to 11.  Also Chuck Pagano’s first season as coach, though that was complicated by his cancer treatments.


Hope for next year?

The Eagles finished the year with 4 wins.  Everyone’s heard plenty of talk over the last few seasons of parity in the NFL, but what kind of season could the Eagles put together following such a bad year?

Over the past 10 seasons, 27 teams have finished the year with 4 wins (not including this year.)

The good news?

Ten of them (more than 1/3) have followed a 4 win season with 9+ wins, with six teams registering 10 wins or better.

Here is the frequency chart:

Screen Shot 2013-01-03 at 3.16.17 PM

Quick rebounds not only happen, they do so relatively often.  The coaching decision is obviously huge, but regardless, given the injuries this team sustained and the past performance of 4 win teams, seen in the chart above, it’s not unreasonable to expect the Eagles to contend for a playoff position as soon as next year.

“Pass to score TDs, run to kick field goals”…or not

With the current emphasis on the passing game in the NFL, the adage “throw to score TDs, run to kick field goals” has become popular with commentators.

Is it true?

To get an idea, I looked at the passing play percentage and points scored for every team in the league going back to 2003, giving me 320 data points.  Here is the chart, with passing play percentage on the X and points scored on the Y:

Screen Shot 2013-01-02 at 4.01.26 PM

See a relationship?

If you said no, you’d be correct.  The correlation value for the above data series is -.083, which means there is really no relationship.  Passing the ball more often does not appear to lead to more points scored.

Some of you (if not everyone) are probably thinking:  “Wait, teams change their play-calling when the are winning/losing, skewing the run/pass ratio.”  My answer: Of course they do, but that itself should not skew the above data to such a degree that there is NO relationship between passing percentage and points scored (if passing really did lead to more points scored.)  Teams that noticeably change their strategy can only do-so late in the game, limiting the number of plays they can run that will skew their overall averages.  Additionally, teams that are running the ball to kill the clock take as much time as possible, running as few plays as possible, again limiting the skew.  Overall, of all the plays run in the NFL every year, relatively few of them are run by teams focused on anything except scoring points.

Feel free to disagree, but if passing the ball more really did lead to more points scored (i.e. TDs instead of field goals), I’d expect to see at least a weak-moderate positive relationship despite any skew effects of teams killing the clock.

Conversely, we can also ask: “Do teams pass more when they are losing?” While the data can’t tell us definitively which is cause and which is effect (do losing teams throw more or does throwing lead to more points against?), it can show us if there is a relationship between the two. Here is the chart, this time with Points Allowed on the Y axis:

Screen Shot 2013-01-02 at 4.37.13 PM

A fairly clear positive relationship exists.  In fact, the correlation value of .46 confirms there is a moderate positive relationship between Passing Play Percentage and Points Allowed.

Let me note again that the data doesn’t prove “Losing teams throw more often”, but it does lend pretty strong support to that hypothesis.  However, given the data above, perhaps losing teams should consider running the ball more, since passing it doesn’t appear to give them a greater chance of catching up (scoring points.)

Obviously this doesn’t hold for end of game scenarios where the clock becomes a big factor (passing takes less time then running.)  However, it does suggest that teams that fall behind early shouldn’t alter their game plan until it is absolutely necessary (very late in the game), something Andy Reid repeatedly did over his career with the Eagles.

Andy Reid Playcalling

Andy Reid’s play-calling has been a favorite topic of discussion for fans since he was hired.  Now that he’s gone, let’s take a look back at he run/pass ratio.  I’m compiling a lot of data for a more in-depth look (and one we’ll be able to draw statistically significant conclusions from), but for now, here is a basic view of the percentage of passing plays called by the Eagles:

Screen Shot 2013-01-02 at 1.59.22 PM


Notes: The data is from teamrankings.com and only goes back to 2003.  The averages are not weighted by number of plays, in hopes of giving a better view of differences in general offensive philosophy.

Over that time period (2003-2012):

– The Eagles average annual passing rate was 59.90%, behind only 4 other teams (Arizona, Detroit, New Orleans, St. Louis).

– Detroit passed the most, by far, with an average rate of 62.84%.

– The Steelers had the lowest average rate, passing 52.47% of the time.

– The highest single year rate was registered by Detroit in 2006, when the Lions passed on 68.43% of plays.  They went 3-13 that year.

– The lowest single year rate came from the Steelers in 2004, when the team passed on just 39.20% of plays.  That year the team went 15-1 (Big Ben’s rookie year).

Next up, we’ll tackle the obvious question:  Does passing more equal winning more? More points scored?  Putting the data together now.  I hope to have an answer in the next day or so.

Andy Reid Era Stats: Part 2

I highlighted turnover differential earlier but figured it would be interesting to look at how the offense and defense progressed over the Andy Reid era.  Below is a chart showing Points Scored and Points Against (total, not league rank).  Here are some interesting notes:

– Over his first seven seasons, Andy Reid’s team had an average league rank of 12.4 for Points Scored.  Over his last seven: 10.3.  Pretty consistent.

– Points Against average rank over the same time periods?  First seven seasons: 9.4    Last seven: 14.9    The defensive performance declined substantially over time.

– From 2000-2004 (Andy Reid’s peak), the Eagles average Points Against rank was 3.4.  Safe to say the Eagles success was built on defense.  (Points For average rank over the same period was 8.8)

– Over the past 4 seasons, the Eagles average Points Against rank is 19.

– For those of you thinking of Jim Johnson (hard not to when confronted with these numbers):  Average points against with JJ: 290.  Without JJ: 346.6.

Screen Shot 2012-12-31 at 10.22.03 AM


This ties in rather well with the message gleaned from the draft history post.  Reid’s inability to find quality defenders in the draft was perhaps his biggest persistent weakness (I know it wasn’t only Reid in the draft room, but you’re kidding yourself if you think he didn’t have the final say.)