Forced Fumbles Skill and Give/Take Recovery Rates

NOTE: This post got away from me a bit.  It’s a long one (1200+ words).  If you’re short on time, read the first section covering the 2012 Eagles, then skip to the very end to see the conclusions for today.

So yesterday I showed that Total Fumble Recovery Rates are both random and Normally distributed.  The takeaway was that there is a 97.5% chance that the Eagles will recover fumbles next season at a higher rate than they did this season.

That’s important, since it will almost definitely be a push in the positive direction for the team.  However, it’s far from the whole story.

There are a couple more aspects to cover.  I told you yesterday that we would take a look at recovery rates broken down by giveaways and takeaways, so I’ll do that first.  Then I’ll take a look at the more interesting question: Is Forcing Fumbles the result of luck or skill?  Feel free to skip to the end if that holds more interest for you.

Giveaway/Takeaway Recovery %

Not all fumbles are created equal.  For starters, see this article.  In general, it shows that recovery rates differ by TYPE of fumble.  For example, an offense is much more likely to recover a dropped snap than fumble by a receiver.  I won’t go into that much detail here; the linked article is worth a read for anyone interested.  Let’s take a look at the higher level stats though (Source: Teamrankings.com).

The long term NFL average recovery rate for “giveaway” fumbles is 52.31%.  That means that an offense, on average, recovers 52.31% of the fumbles it commits.

Conversely, a defense recovers, on average, 47.48% of the fumbles the OPPOSING offense commits.

Note that those two numbers do not add to exactly 100%, which I assume is due to fumbles that go out of bounds and are therefore recovered by neither team.

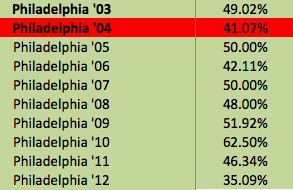
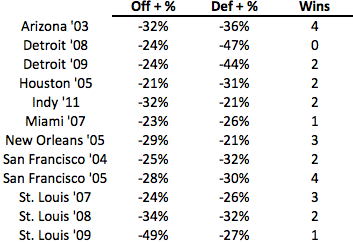
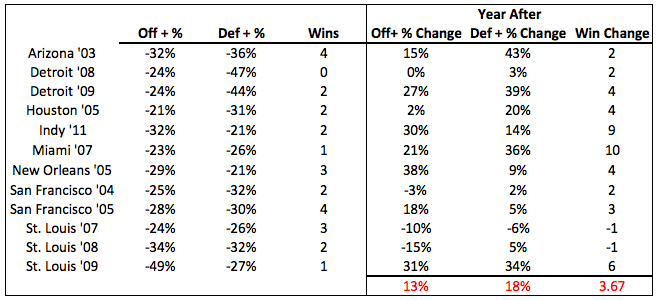
So what happened to the 2012 Eagles?

The Eagles, last season, recovered just 40.5% of the fumbles they committed.  That is roughly 12% below the expected recovery rate.  That’s bad.  However, it’s hardly a large enough deviation from the average to explain the overall performance. So…

The Eagles, last season, recovered just 25% of the fumbles the other team committed.  That is more than 22% below the expected recovery rate, a huge deviation.  In fact, over the past 10 years, only 4 teams have recovered opposing fumbles at a lower rate.  Previously, I highlighted that the Eagles only “gained” 5 turnovers on fumbles last season, FAR below the long-term league average of 11.  However, the team (according to ESPN) forced 17 fumbles, almost equal to the NFL long-term average of 17.15.

So the 2012 Eagles actually forced fumbles at a league average rate, but recovered them an extremely low percentage of the time (which is luck).  That is also extremely unlikely to happen again next year.

Is Forcing Fumbles Luck or Skill?

Now we’re getting to the more interesting stuff.  Recovering fumbles appears to be ENTIRELY luck.  However, if forcing fumbles is the result of skill, then teams have some control over the Fumble Differential equation.  So how do we know?

Similar to yesterday, we can’t know for sure without an extremely in-depth study and a lot more computing power than I have.  However, let’s look at a few different areas to get a good idea of what’s happening.

First up is team persistence.  If forcing fumbles is the result of skill, then we can expect teams that are “good” at it to continue being good at it year after year.  If it is a skill, then it is repeatable.

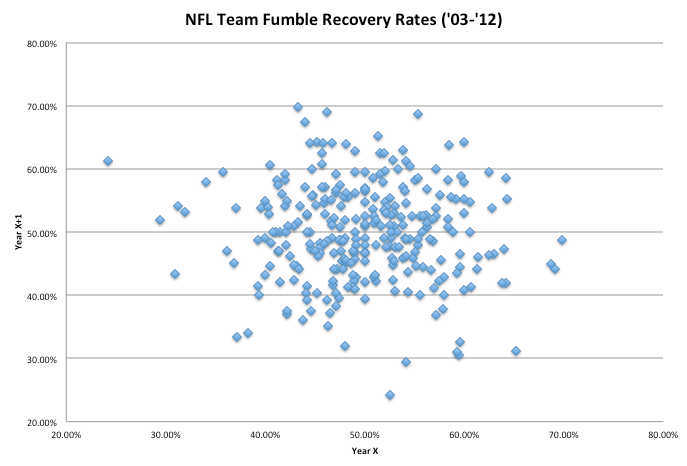
Here is the chart for forced fumbles, the axes are Year X and Year X+1.

Screen Shot 2013-07-12 at 12.56.10 PM

Doesn’t look like much.  The correlation value is .083, which is very small (obviously).

Just in case a year-to-year look was too susceptible to short-term variability, I also looked at the correlation between the 2-yr average and the following seasons total for each team.  Again, a value of .087, still very weak.

That’s certainly a strike against skill, but we’re not finished.

What about individual players?

We all remember watching Charles Tillman last year (he forced 10 fumbles).  Based on just last season, it seems like it’s safe to say he is actually “good” at forcing fumbles.  If he is “good”, than it’s a small logical step to say that others must be good as well.

If forcing fumbles is a skill, then we should see the “best” fumble forcers towards the top of the leaderboard each year.  Here is every player that forced 4 fumbles or more in a single season over the past 5 years.  Click to enlarge.  I’ve highlighted the players who appear on more than one list.

Screen Shot 2013-07-12 at 1.05.39 PM

It appears as though there are some players who consistently force a high number of fumbles (relative to the rest of the league).  However, notice the degree of variability in both the number of fumbles forced and the number of players who appear just once.   Some of you will have already noted, though, that what we should really be looking for is RATE.  Next week, I’ll try to equalize for that (thought of it too late for today’s post).

For now, I think it’s best to say that at an individual level, certain players appear to force fumbles more often than others, meaning it may be the result of skill.  However, given how many people are on the field at once, the relative impact of that player contribution may be small enough that it’s relatively insignificant to the overall game.  Not there yet, I’ll try to detail this more next week.

What about teams?

Certain teams appear to be better at forcing fumbles than others (the Bears are the obvious example).  The Bears look as though they’ve made forcing fumbles a large point of emphasis.  Looking at the overall totals from the last ten years bears this out.

Screen Shot 2013-07-12 at 1.13.55 PM

The Eagles are close the middle of the pack, having forced 164 fumbles over the past ten seasons.  The NFL Average is 166.9.

Does this mean the Bears are “better” at forcing fumbles than other teams?  Maybe.

As I showed above, there is really no persistence in the year-to-year forced fumble data.  However, the team totals data is Non-Normal and skewed negatively (meaning the distribution is thicker at the high-end than the low), as are the single season totals.  Despite the persistence values, it appears as though, at the margins, some teams/players do create fumbles at a relatively high rate (have to confirm though).

Similar to yesterday, I have now provided more questions than answers.  I will attempt to answer some of those next week.  Allow me though, to sum up in as clear an explanation as possible:

“Creating” fumble turnovers is the result of two discrete factors.

– Forcing the fumble.

– Recovering the fumble.

How do the relative correlations of these two factors compare?  In other words, to what degree is “fumbles gained” explained by each of these?

Here is Forcing Fumbles to Fumbles Gained:

Screen Shot 2013-07-12 at 1.48.06 PM

The correlation value is .676, very strong.

Here is Recovery rate to Fumbles gained:

Screen Shot 2013-07-12 at 1.51.40 PM

The correlation here is .59, also quite strong.

The difference in correlation strength is big enough to notice (.086), but relatively small.

Here’s the key part:

– The two factors (recovery rate and # forced) appear to be relatively equal in importance.

– Recovery rate is completely random.

– # of fumbles forced appears to be largely random (though skill is involved).  This needs more work, but putting those two factors together means:

While there may be some individual skill involved in forcing fumbles, when incorporated into the whole “fumble equation”, that contribution is small, and certainly less of a factor than random chance (luck).

Congratulations if you’ve read this far.  As is often the case, I ended up pretty far from where I intended to.

Fumble Luck…Again

Today, let’s go back to talking about fumbles and luck.  It occurred to me (or was pointed out), that there are two sides to the equation, and I’ve only really looked at one.  To refresh, I previously explained that “fumble problem” is largely overblown.

For individual players, there is some year-to-year persistence in fumble rate (fumbles/rushes), but it’s small.  Overall, there is a large amount of luck and natural variation in any particular player’s rate of fumbling.  Here is the post.

Additionally, I explained that while not all fumbles are equal, over the long-term we should expect every team to recover approximately 50%.  The counterpoint to this argument is that it’s about “hustle” and “heart”.  As you can imagine, I have little patience/regard for that side of things (in this specific scenario, not necessarily in everything).  However, I do not believe I actually took a look at the team-level statistics to back that assertion up.

Let’s look at that now.

First up, we’ll tackle the OVERALL team fumble recovery percentages.  Then I’ll break it into recovery percentages for giveaways and takeaways (much different situations which carry different expected recovery rates).  NOTE: I’ve decided to push the breakdowns until tomorrow, after reaching nearly 1000 words on the first section.

Team Fumble Recovery Percentage

This statistic (data taken from Teamrankings.com) covers the percentage of ALL fumbles that a team recovers.  This is very important for Eagles fans.

Last year, the team lost a historic amount of fumbles (22) and gained just 5 (NFL long-term average is 11).  Not coincidentally, the Eagles recovered just 35% of all fumbles last year, 4th worst in the league (Buffalo was worst with a rate of just 30.6%).

If Fumble Recovery % is truly random, then the Eagles can be expected to regress to the mean next year (50%), which would result in a better TO differential (which is highly correlated with Wins/Losses).

To get a look at the randomness, I’m going to look for year-to-year persistence.  This is where it gets tricky.  Due to the amount of players on NFL rosters and the constant turnover in personnel, just looking at a team’s year-to-year persistence isn’t enough to conclusively prove anything about fumble recovery %.  As usual, we will have to settle for a strong indication, since equalizing the data for every player and every play is far beyond the scope of anything I can (or want) to do.  Just know that this is an issue inherent in almost every NFL analytic breakdown or long-term analysis.

Before we look at the whole league, here are the Eagles’ yearly total fumble recovery percentages from 2003-2012:

Screen Shot 2013-07-11 at 4.18.26 PM

As expected, the annual totals seem to fluctuate relatively narrowly around the 50% mark.  Also of note is just how much worse last year was when compared to the previous 9 seasons.  This is a major reason why I expect improvement next year.  It’s not just that the Eagles were below the expected recovery %, it’s that they were FAR below it; it’s difficult (though far from impossible) to get much worse.

Now let’s look at the entire league.  Here is a graph showing the One Year persistence of Fumble Recovery Percentage for the entire league over the last 10 seasons.

Screen Shot 2013-07-11 at 4.28.41 PM

As you can see, there is no correlation (officially its -.06).

Due to the factors I cited above (roster changes, personnel differences, etc…), we can’t say definitively that fumble recovery % is all luck.  However, we can absolutely say that a team’s % for one year doesn’t tell us anything about it’s expected % next year.  In other words, the Eagles 35% recovery rate in 2012 doesn’t tell us anything about the 2013 season.

Mean Regression

The flip side of what I just said is that just because the Eagles were below the expected mark last year in no way means the team will be at or above the mark next year.  That’d be a bit like playing roulette and expecting the next roll to be black because the last 3 were red.  The overall idea is that each season’s recovery percentage is entirely independent.

So why do I expect the Eagles to recover?

Looking at the overall data, the standard deviation of all team recovery percentages over the last 10 years is 7.46%.  That means, if the data is random and Normally distributed, we should see approximately 68% of all individual team rates fall between 42.5% and 57.46% (1 standard deviation above and below the mean).

In our data, 220 teams fall within that range.

220 divided by 320 (our sample size) = .6875 or 68.75%

Additionally, we should expect 95% of all team rates fall within the range of +/- 2 standard deviations (35.07% – 64.927%).

In our data, we have 306 teams that fall within that range.

306 divided by 320 = .956 or 95.6%

Lastly, we should see 99.7% of teams to fall within 3 standard deviations of the mean.

In our data there is just 1 team that does not fall within the expected range (2011 Saints).

319/320 = .9968 or 99.7%

Summing up a bit:

– The data is random (no year-to-year persistence).

– The data is Normally distributed (hits the 68%/95%/99.7% mark almost exactly)

The 2012 Eagles recovery rate of 35% is almost exactly on the 2 standard deviation line.

Therefore, since we expect 95% of teams to fall within 2 standard deviations:

The 2013 Eagles have a 97.5% chance of recovering fumbles at a higher rate than they did last year.  (95% + half of the 5% distribution beyond 2 standard deviations)

One last bit for today, how does this rate business effect actual fumbles?

Here is a chart showing the correlation between fumble recovery rate and fumbles differential (Gained – Lost).  In other words, to what degree are “creating” fumble turnovers and “protecting the ball” a result of fumble recovery percentage (which is luck)?

Screen Shot 2013-07-11 at 4.58.15 PM

I’ll have more on this tomorrow, when I’ll take a more detailed look.  The chart above should give you a strong hint of where this is going though.

I’m going to stop there for today.  This section is a lot longer than I intended and I’m guessing very few people have the time/patience to read through a 3000 word post on expected fumble recovery rates.

Eagles Rebound Potential and Underplayed Risk

Bill Barnwell posted an article today at Grantland discussing which losing teams from last year are most likely to rebound next year.  He has the Eagles ranked 2nd, behind the Lions, in terms of which teams (6-10 or worse last year) are most likely to make the playoffs.

The case he makes is very similar to the case I’ve been making on this site for a long time, however, it’s interesting nonetheless.  Here is the Eagles section, I’ve bolded the most important points.  Afterwards, I’ll highlight something that isn’t getting enough discussion.

2. Philadelphia Eagles

Arguments in favor: Coaching voice change, massive turnover differential, fumble recovery rate, hidden special teams bounce back

Arguments against: Uncertainty related to coaching change, quarterback play

Although it seems difficult to remember, the Eagles were actually a passable team during the first half of last season. It was after firing defensive coordinator Juan Castillo during the team’s bye week that the Eagles quit on Andy Reid and collapsed, finishing 1-9. There’s still a good amount of the core that made the playoffs from 2008 to 2010 here, and they chose the high-risk, high-reward coaching option this offseason when they added Chip Kelly. Of all the teams on this list, it seems like the Eagles have the highest upside.

The statistical case backing them up is built upon an impossible turnover rate. Philadelphia was the other team with a minus-24 turnover margin, and by recovering 35 percent of the fumbles in their games, they finished just ahead of Kansas City, at 29th. Of course, Kelly has already become the first coach to teach Michael Vick how to avoid fumbling, so that should solve a good chunk of the problems there.

In all seriousness, Kelly’s insistence on getting the ball out quickly should reduce the likelihood of fumbles, and some simple variance should help push the Philadelphia offense back toward the middle of the pack. The defense should also deliver more than the eight interceptions it produced last year, so it’s not difficult to imagine the Eagles actually winning the turnover battle in 2013.

As for the “hidden” special teams numbers, that’s a Football Outsiders statistic that encapsulates how teams were impacted by special teams performance out of their control, including such obvious ones as how reliable field goal kickers and kickoff artists were against them. The Eagles were the fourth-most impacted team in football last year by those figures, with kickers notably going 27-for-29 on field goals against them in 2012.

Beating a dead horse:  The Eagles were VERY unlucky last year.  You’ll recognize the points above from previous articles here as well as from the dashboard prototype I threw up a couple of weeks ago.

However,

I wanted to also highlight the coaching risk.  As Bill says towards the top, the Eagles selected the high-RISK/high-reward option.  Eagles fans should not overlook the first part of that trade-off.  Kelly is a very exciting coach, and I’m encouraged by the fact that he’s willing to tear down conventional football wisdom in search of advantages.   The flip-side, though, is that he carries a higher risk of failure.

Make no mistake, if Kelly goes down, odds are he’s going down BIG-TIME.  This is not an approach that seems to lend itself to a series of mediocre seasons.  The problem with challenging convention is that if things start slowly, the external noise will be excruciatingly loud.  Old-school beat writers, ESPN talking-heads, and Joe Banner will attack Kelly and the Eagles like sharks around a bait-ball (Discovery channel reference!).

That risk and uncertainty poses the biggest potential hurdle for the team this year.  All things considered, the Eagles now look like an 8 or 9 win team (Vegas has the O/U at 7.5, so I’m bullish by one win).  Unfortunately, the Eagles also have perhaps the WIDEST expected range of outcomes.  It is completely conceivable for this team to win anywhere from 3 to 13 games next year.

I’m certainly betting on success; Kelly seems to know what he’s doing and is willing to adapt (rather than just trying to impose “his” way on the game, a la Steve Spurrier).  Just know that the natural payment for Kelly’s potential upside is a corresponding risk of spectacular failure…


Will the 2013 Eagles be “healthier”? Examining Injury counts and persistence.

One of the more widely reported reasons for the 2012 Eagles’ ineptitude was the number of significant injuries the team sustained.  Vick, Shady, D-Jax, and pretty much the entire Offensive Line were hit, each missing at least several games.  While it must have had a negative effect on last season, it’s reasonable to believe that the injuries from last season are ALSO a reason to be optimistic this year.  Surely this year’s team will not suffer as greatly.  With a healthy offensive line and full seasons out of the major playmakers, the 2013 Eagles should be in a position to rebound strongly.  Right?

Maybe, but caution is advised.

As is the often the case with anecdotal or out-of-context evidence, the complete data set tells a somewhat different story.  To get an idea of whether we should expect the Eagles to be “less injured” this year, we need to answer two questions:

– How injured were the 2012 Eagles?

– Is there any persistence in year-to-year injuries?

How injured were the 2012 Eagles?

I’m going to use two different numbers to illustrate.  The first is straightforward; it’s just the number of injury games lost by starters.  Rick Gosselin of the Dallas Morning News put together this chart that shows the relevant data for every team in the league during the 2012 season.  I’m going to assume his numbers are accurate.

The 2012 Eagles’ starters lost 63 games to injury last year.  That sounds like a lot, and while it is a lot in absolute terms, it is good enough (bad enough?) for just 25th in the league.  In other words, 7 teams lost starters to injury MORE often than the Eagles did last year.

Still, the Eagles were close to the bottom. As a result, it may be the case that we can expect the team to regress towards the league average next year, meaning fewer injuries and presumably better on-field performance.  Unfortunately, to get a look at this requires more than 1 years’ data, and I don’t have/can’t find charts like the one above for previous years.

For that we need to turn back to the Football Outsider’s Adjusted Games Lost measure that I referenced two weeks ago.  As I explained then, the AGL measure is a bit muddled.  It uses games missed as well as the injured player’s relative importance to quantify the effects of injury.  It also makes adjustments based on the injury report (Questionable, Probable, etc…) to account for the effect of a player participating at less than 100%.

As you can probably tell, there’s likely to be a lot of noise in that data.  Without seeing the exact formulation, I don’t have a sense for the specific weaknesses of the stat, but we can assume it’s far from perfect.

However, the data is available for the past 5 years and I think we can assume that the statistic has been measured consistently over that time period (i.e. no changes to the formula).  Therefore, we can use the stat to get an answer for both questions mentioned above.

– According to AGL, the 2012 Eagles measured 73.3 on the AGL scale.  The average AGL over the past 5 seasons is 56.4.

– The standard deviation for AGL over the past 5 years is 23.1.  Roughly 65% of teams over that span fall within 1 standard deviation of the average and 97% fall within 2 standard deviations, meaning the overall distribution is somewhat Normal.

What does this tell us?

Basically, it means the 2012 Eagles did suffer a relatively high number of serious injuries.  However, the team’s injury count was FAR from out of the ordinary.  Therefore, unlike other measures I’ve highlighted (fumbles, field position), we should NOT expect to see a big improvement to the 2013 Eagles purely as a result of mean-regression (better luck).

We’re not done yet though.

Remember that second question?  The one about persistence?

Well it turns out that, for reasons I haven’t fully analyzed, Adjusted Games Lost is a surprisingly persistent statistic.  That means there is a mildly strong (.30) correlation between a team’s AGL measure one year and its AGL count the following year.  The most obvious reason for this would be that certain players are “injury-prone” and are therefore likely to make continuous contributions to the AGL count each season. For example, if Mike Vick is your Quarterback, you will likely get a few bumps from him each season, as opposed to someone like Eli Manning, who has now started 146 consecutive games (including playoffs).  Regardless of the reasoning, the persistence tells us that since the Eagles were injury prone last year, they are somewhat likely to be injury-prone again this year.

Wrapping everything up, here’s the key takeaway:

There are a number of reasons to feel very good about the Eagles going into this year.  Assuming the team will be healthier, though, is not one of them.

Points Per Play; NFL Offensive Efficiency

A commenter suggested I take a look at Points per Play, so that’s what I’m doing today.  Note that I haven’t fully thought this through, so I’m going light on the analysis until I feel comfortable with the real meaning behind the data.

For starters, here are the highest points per play measures from the last ten years.  I should also note here that my data is different from the points/play and points/game data from teamrankings.com, and I haven’t yet figured out why.  For now, I’m going with mine, since I know how that was compiled, just know that there may be some small discrepancies (definitely some rounding differences).

As a reminder, Red highlighting means a team LOST the Super Bowl, Yellow means it Won, and the Eagles are in Green.

Screen Shot 2013-07-03 at 12.28.54 PM

Somewhat surprisingly, the 2007 Patriots do not rank #1, though a .559 mark is amazing.  Green Bay’s 2011 team sets the mark for offensive efficiency, in terms of maximizing the scoring impact of each play.

Regarding the Eagles, the 2009 team sets the mark for the Andy Reid Era, though the 2010 team was not far behind (.425).  Remember, both the 2009 and 2010 teams were 25% better than league average on offense.  The defense, on both teams, performed worse (+2%, -7%).

Is a high points per play measure good?

Obviously, it is.  However, the question I want to raise here is if the goal on offense should be two-fold.  Scoring points is, by far, the priority goal.  Given the choice, though, shouldn’t teams want to run a lot of plays?

In theory, running more plays takes more time off of the clock, meaning the opposing team’s offense gets less time on the field.  Commentators also frequently cite the fatigue impact of keeping the opposing defense on the field, but I don’t see a big advantage there, since presumably the offensive players get tired too (and don’t rotate like the defenders do).  It’s interesting that just 2 teams in the table above even reached the Super Bowl, with just 1 winning it.

What about the data?

Despite the logic above, there is a modest negative correlation between points per play and points allowed.  Here is the chart:

Screen Shot 2013-07-03 at 12.46.57 PM

The correlation value is -.24.

So teams that score efficiently, despite presumably giving the ball back to the other team fairly often, do not appear to allow more points as a result.

But why?

Perhaps scoring so efficiently puts a lot of pressure on the other team to keep up.  Therefore, despite receiving a lot of possessions, the other team is forced to make higher risk plays, leading to more negative plays, and potentially more turnovers.

Let’s take a look.  Here is the chart showing Points Per Play against Turnovers Created.

Screen Shot 2013-07-03 at 12.57.56 PM

Bingo.  The correlation value is a fairly strong .38.  UPDATE: There are definitely some causation issues here (i.e. forcing turnovers helps teams to score with fewer plays).  However, given the other offensive data I looked at, I feel comfortable saying it runs more in the direction cited above then in the reverse.  Just know that there is a kind of positive feedback loop at work here.

This goes a long way to explaining the apparent discrepancy I discussed above.  Teams that score frequently also give the opposing team a lot of possessions.  However, those opposing teams do not score more often as a result.  The reason (or A reason, at least), is that the opposing teams end up turning the ball over as they try to keep up.

This goes back to a post I did way back in January about team’s Pass Play Percentage.  The gist of that post was that teams may alter their game-plans too early when losing.  Even down by 2 touchdowns, teams should not abandon the run game until well into the 4th quarter.  By passing more to keep up, losing teams force themselves to successfully execute a strategy they’re not prepared for against a defense that is expecting pass.  The result, predictably, is a lot of turnovers, which obviously hurts the comeback effort.

That brings up the whole concept of Game Theory in run/pass selection, which I think is an extremely fertile area for NFL analytics and research.  Can’t address it in any more detail today though, so we’ll stop there.

Lastly, Happy Independence Day. I’m probably taking the rest of the week off since I won’t be near my computer much anyway.  Enjoy.

Big Play Offenses; Reid/Kelly Philosophical Differences

Little to no NFL news to really comment on, other than the Aaron Hernandez saga (which is so outrageous I’d just as soon never mention it).  However, rookies report to Eagles training camp on July 22, just 3 weeks from now; so things will pick up soon.

Today, I wanted to take a brief look at  “big-play” offenses.  In short, I think Chip Kelly’s offense will be far less reliant on big plays than Andy Reid’s did.  Andy Reid, despite being known as a “West-Coast” guy, emphasized the deep ball.  Going purely off memory, I believe this began with the TO acquisition, then continued thereafter.

I expect Chip Kelly’s offense to function much differently.  I think the Eagles will use D-Jax on deep routes mainly to stretch the defense and create space for both the run game and underneath TE routes.  Pure speculation at this point, but Andy liked to set things up for a deep shot, whereas I expect Chip to use the deep ball to open things up underneath.

Let’s back up for a second.

What makes a “big play” offense?

The easiest answer would be the obvious one: big plays.  It’s hard not to like deep strikes and long touchdowns.  With the Eagles’ offense though, they typically came at the expense of the ability to consistently gain first downs.  Is that a good trade-off?

Is there a way to quantify this?

Maybe.  As usual, I’ve attempted to create a shortcut.  Rather than look at the number of long scoring plays, passes over 20 yards, etc., I’ve taken total offensive yards and divided by the number of first downs.

For example, a 20 yard pass will only pick up 1 first down (20 yds/1st Down).  In contrast, three running plays of 4 yards each will also pick up 1 first down, but with just 12 yards (12 yds/1st Down).

Easy right?  There’s obviously other noise in here.  Penalties distort the overall numbers.  Negative plays (sacks) change the yards/1st down equation.

I should probably just attach the usual disclaimer: measure is not perfect, but I believe it gets at what we’re looking for.

The Results

From 2003-2012, the NFL average offensive yards per 1st down was 17.6.

So were the Eagles as “big play” dependent as many believe?

From 2003-2012, the Eagles averaged 18.2 yards per 1st down, the 3rd highest average in the league, behind only Tampa Bay and Tennessee (18.4).  Here is a table showing the entire league.

Screen Shot 2013-07-02 at 12.01.35 PM

Of note here, besides the Eagles high placement, are the teams ranked 31st and 32nd.  Over the past 10 years, the Colts and Patriots, teams known for their high-powered offense, have the lowest yards/first down averages.

The 2012 Patriots actually recored the LOWEST measure in the last 10 years; just 15.4 yards per first down.

Thinking through our perceptions of these teams, this makes a lot of sense.  When I picture Peyton Manning and Tom Brady offenses, I think of methodical movement down the field.  I do NOT think of spectacular deep throws (though both QBs can obviously do that as well).

The magnitude of the difference in averages above seems small.  Here, though, is another table.  This one shows the 15 HIGHEST averages of the past 10 seasons.

Screen Shot 2013-07-02 at 12.06.49 PM

The Eagles feature prominently, as do the 49ers and Titans.  The 2004 Eagles (Super Bowl with TO), averaged 18.7 yards per 1st down, a high measure, though not high enough to crack the table above.

So the numbers match our expectations.  Andy Reid’s Eagles did, in fact, rely more heavily on big plays than nearly any other team in the league.  Note that this is not inherently good or bad.  The correlation value of Yards/1st down to Points Scored is just .065, negligible and an indication of little to no connection.

UPDATE: Here is table showing yards/first down for each team during the Andy Reid era (’99 not included)

Screen Shot 2013-07-02 at 2.19.32 PMSo what does this mean going forwards?

The most drastic difference between Andy Reid and Chip Kelly is likely to be offensive philosophy (stating the obvious).  We don’t know what system Kelly will run, and it will likely depend on which QB wins the starting job.  However, as I’ve previously stated, I think the best proxy for what the new Eagles offense will look like is Penn State’s, followed closely by New England.  Going back to our league-wide chart above, we can see that New England’s offense, on a yards per 1st down basis, is about as far from the Eagles’ recent offense as possible.

Practically, this means:

– Longer drives

– Deep balls to set up the short game, rather than the opposite

– Lots of underneath/slot passes

– Fewer “exciting” plays, but more plays overall.  Learn to love the 5 yard pass.

– D-Jax will need to be a “team player”…he will likely be a secondary focus (at least his deep routes)

However, it does NOT mean:

– An expected difference in points scored.

Visualizing Last Season

I’ve gone over a lot of different statistics over the past few months, most of which illustrated just how bad the Eagles were last year.  Throughout that effort, I’ve been attempting to come up with a way to visualize all of these stats together.  The goal is to create a kind of dashboard that shows, at one glance the strengths and weaknesses of the team and its performance relative to historical averages.  Today, I’d like you to look at a first draft.

I’m far from an expert at Excel (at least when it comes to the graphing tools), so if you know of a better way to visualize the data, please let me know.  Here’s what I’ve got so far:

Below are several charts that each contain 6 data points.  They are as follows:

Max, Min, Avg, +1 StDev, -1 StDev, and the 2012 Eagles

I’ve highlighted the 2012 Eagles in Red and the Average in Yellow.  The timeframe for included data is noted at the top of each chart.  

For example, here is Points Scored:

Screen Shot 2013-06-27 at 11.43.37 AM

So the 2012 Eagles scored 280 Points, which is significantly worse than the time period average (345), but within 1 standard deviation (272).

Simple enough?  It’s not elegant, but my hope is to create something for which I can show a lot of charts next to each other with minimal explanation.  Hopefully, since they’re all formatted the same, it will be easy to visualize everything at once.  I’ll list a few more below so we get a better idea of what it would look like.

In the run-up to the season, I hope to put a comprehensive set together so we can see all of last season, statistically, at a glance.  Hopefully, this will also help illustrate which areas of the game we should expect significant improvement in.

Screen Shot 2013-06-27 at 11.52.08 AMScreen Shot 2013-06-27 at 11.57.36 AMScreen Shot 2013-06-27 at 12.07.40 PMScreen Shot 2013-06-27 at 12.00.02 PMScreen Shot 2013-06-27 at 12.02.26 PM


Interesting? Suggestions?

———————–

Tonight is the NBA draft.  Normally this isn’t that noteworthy of an event, unless the Sixers have a high lottery pick (tonight they pick 11th).  However, the Sixers have a new GM, so perhaps something interesting will happen.

Most mock drafts have the Sixers taking a Big (C/PF), noting that the team “needs” help at that position.  That analysis is remarkably short-sighted.  Given the structure of the game (small rosters, 5 men on the court at a time, etc…), the NBA is HEAVILY dependent on “stars”.  This means that NBA teams should draft BPA no matter what.  It is even more important to do this in the NBA than it is in the NFL (and we’ve seen how vital it is in the NFL).

Fortunately, the new GM (Sam Hinkie), is a member of the “analytics” crowd, so surely he knows this.  I don’t follow the NBA draft nearly as much as the NFL draft, so I won’t make any specific player recommendations.  However, even though he hasn’t made a single move yet, I have more confidence in Hinkie than I’ve had in any Sixers GM during my lifetime (28 years).  That itself is cause for optimism.

It may be time to start paying attention to the Sixers again.  If you’ve tuned out the past couple years, let me catch you up on everything you NEED to know:

– Jrue Holiday is VERY good, and has a legitimate shot at being a “star”-level player.

– It is VERY difficult for the Sixers to sign marquee free agents because Pennsylvania has a state income tax (unlike Florida or Texas).  It might also be because Philly is not a “warm-weather” location, but I think that aspect is largely overblown (you’ll hear it a lot from the press).

There you go, you’re caught up.  The rest would just make you sad and remind you why you tuned out in the first place.


Do More Plays = More Injuries?

A few weeks ago, Tommy Lawlor from IgglesBlitz suggested I take a look into whether there is a connection between plays run and injuries.  Today, I’ll do that.  The theory is relatively straightforward, if you run more plays (for instance, out of a no-huddle offense) you have more opportunities for players to get hurt.  Additionally, we can assume that relative levels of fatigue increase with the number of plays.  I think it’s also safe to assume that there MAY be a positive connection between fatigue and injury rate.

I guess it’s theoretically possible for fatigue to LIMIT injuries (players aren’t moving as fast or cutting as quickly), but I think it’s more likely to work the other way.

In any case, given Chip Kelly’s state preference for running lots of plays on offense, it’s a worthwhile endeavor to see what, if any, the negative effects will be on the Eagles players.

Methodology

Here’s the tough part.  There are A LOT of variables that go into injuries.  Additionally, to get a full answer, we’d have to delve very deeply into the plays per game numbers.  The ideal way of measuring (as far as I can tell) the correlation would involve logging individual players’ number of plays versus their individual injury occurrences.  Unfortunately, I don’t have the data (nor the time/resources) to accomplish such a complete project.

However, I’ve taken a shortcut in an effort to get a quick look at the issue.

From Teamrankings.com, I’ve downloaded the number of offensive plays run for each NFL team from 2008-2012.  On the injury side, I’ve used Football Outsiders’ Adjusted Games Lost metric.  Note that this statistic is not a straight man-games lost measure.  It accounts for the differing injury report designations along with the relative importance of each player (i.e. losing a starting QB is much worse than a 3rd string DE).

While this doesn’t directly address the issue at hand (is injury occurence positively correlated with plays run), it does get at the higher level issue (and perhaps more pertinent question) of how big of an effect will Chip Kelly’s uptempo offense have on the Eagles injury rate.

Note I only went back to 2008 because that’s the earliest season for which I could find the FO AGL stats.

Results

Good news for Eagles fans (at least not bad news); there does not seem to be a connection between Adjusted Games Lost and Offensive Plays run.  Here is the chart, the correlation value is -.019.  Don’t read into the fact that the correlation is negative; the magnitude suggests there’s no connection either way.  UPDATE: I had the X and Y (dependent/independent) flipped in the original chart, now fixed.

Screen Shot 2013-06-25 at 2.19.24 PM

As I said, this is by no means a definitive analysis.  I’d like a larger sample.  It also doesn’t account for TYPE of play, nor does it account for the change in personnel on the field for each play.  For example, a kneel down will count as an offensive play despite not carrying any significant risk of injury.  Similarly, teams running out the clock with their backups will factor into the data, whereas we are not really concerned with those situations.

Regardless, it’s at least an indication that the Eagles should NOT expect to see a significant increase in rate of injury as they increase the number of plays run.  There are a number of potential reasons for this.  First of all, the rate of injury is actually very low, so an individual play carries a very small risk.  Therefore it should require a relatively large increase in number of plays before we see any effects.

Also, injury rate itself is so variable that we can’t immediately attribute more injuries to more plays.  We have to allow for the possibility that increases to overall injury rate are random (though we didn’t see an increase here).

There’s certainly a lot more work that can be done on this subject.  There MUST be some correlation, for no other reason than more plays = more opportunities to get hurt.  The real question is magnitude, which appears (in this analysis at least), to be very small.  We also don’t know whether injury rate is flat or whether it increases as the game progresses (do more injuries occur later in games, perhaps shedding light on the fatigue factor).

For now though, there’s no reason for Eagles fans to worry.

A couple other major takeaways from the data:

– There is a relatively surprising lack of variation in the number of plays run by each team.  Over the past 5 seasons, the leader in plays per game has been New England, with 67.9.  That makes sense.  However, the lowest average belongs to the Buffalo Bills, who ran an average of 59.94 plays per game.  Notice the difference between the two teams is just 8 plays per game.  As you can imagine, injuries a rare enough that an 8 play increase should not have a major effect on the number of injuries.

– The Eagles averaged 64.64 plays per game over the same timeframe, placing the team 7th overall.  Essentially, the Eagles under Andy Reid ALREADY ran more offensive plays per game than most teams.

– The NFL Average from 2008 to 2012 was 63.15 plays per game.

– The highest number of plays run per game in an individual season belongs to last year’s Patriots, who averaged 74.3.  The lowest was 56.7 by the 2010 Titans.

Surprising Stats

Short post today.  I’ve gone through and found what I believe to be some interesting/surprising NFL stats.  No deep meaning or long analysis, I’ll let the numbers mainly speak for themselves.

– Matt Stafford has thrown more Passes per game than any QB in history.  By itself, that’s not a big surprise.  However, the size of his lead is ridiculous.  Here is the top ten of all-time, taken from Pro-football-reference.com:

Screen Shot 2013-06-24 at 12.20.55 PMBy comparison, Donovan McNabb, during his time with the supposedly “pass-crazy” Andy Reid Eagles, averaged 32.06 attempts per game, nearly 30% fewer passes per game than Stafford.


– Tony Romo has the 5th highest Passer Rating in history, just 1 tenth of a point worse than Peyton Manning.  Check out the top 5:

Screen Shot 2013-06-24 at 12.28.37 PM

– Michael Vick has just 13 more career passing yards (20,274) than his cousin, Aaron Brooks (20,261)

– Adrian Peterson, Gale Sayers, and Barry Sanders all have career yards per carry averages of 5.0….

D’Angelo Williams, Napoleon Kaufman, and Tatum Bell all have career YPC averages of 4.9.

– Muhsin Muhammed had 860 career receptions, nearly 100 more than Eric Moulds (764) and more than 100 more than Michael Irvin (750), Andre Rison (743) and Donald Driver (743).

– Noted statue Peyton Manning is tied for 2nd all time (with Dan Marino) for low sack percentage (3.13%).  Michael Vick’s career sack percentage is 8.60%.  QB Mobility is overrated…

– Jim Kelly is in the HOF.  Here are some of his career NFL numbers, side-by-side, with Donovan McNabb:

Screen Shot 2013-06-24 at 1.14.05 PM

What happens to Terrible Teams in year 2?

It’s no secret that the Eagles sucked last year.  The team was 23% worse than league average in Points Scored and 22% worse than league average in Points Against.  There are a lot of explanations for what happened, but there’s no denying the fact that the team’s production was awful.  I’ve previously discussed the Turnover issues, specifically predicting that the 2013 team will perform better if for no other reason than better luck.

Today, let’s expand that topic a bit, moving beyond turnovers.

What happens to a team the year AFTER it performs TERRIBLY?

To find such teams, I looked at the last decade in the NFL (2003-2012) and found every team that was more than 20% below league average in BOTH Points Scored and Points Against.

There are only 15 such teams (out of 320 in the sample).  Also, 3 of these team seasons occurred last year (Eagles, Raiders, Jacksonville).  Since I can’t see the future (still working on that), those obviously won’t help us much.

That leaves 12 teams from which to draw information from.  Here they are:

Screen Shot 2013-06-19 at 11.08.06 AM

These are the WORST teams of the NFL from 2003-2011.  What happens the following season?

Screen Shot 2013-06-19 at 11.22.03 AM

On the right side of the table, I’ve shown the CHANGE in Offensive and Defensive performance relative to league average (Points For and Points Against).  I’ve also shown the CHANGE in Wins for each team in the subsequent season.

To overemphasize, those numbers are CHANGE, not absolute.  So the 2004 Cardinals won 6 games (4+2), not 2.

Now that I’ve cleared that up, let’s look at the results, which I’ve highlighted in Red.  On average, the teams improved their offensive production by 13% (relative to league average) and their defensive performance by 18%.  Those are obviously HUGE gains.  Perhaps most importantly, the teams above, on average, improved by nearly 4 wins.

Why?

There a number of reasons for expecting a large improvement this year from the Eagles.  Injuries, bad luck, new coach, etc…  However, another major factor is that the NFL is DESIGNED to ensure really bad teams don’t stay bad for long.  That’d be a big problem for developing and keeping fans.  To alleviate this, the NFL uses two strategies:  The NFL Draft, and the Schedule.

Everyone here is probably familiar with both (definitely how the draft works).  Quickly, the NFL schedule uses the standings to create the non-divisional match ups each year.  So the Eagles, by virtue of finishing last in the division, will play other teams this year that also finished last in their respective divisions.  The upshot is that the Eagles have games next season against the Lions, Bucs, and Cardinals.

For the teams in the chart above, these factors also played a role in the subsequent improvement.  Basically, if your team is terrible, you SHOULD get an impact player in the draft (perhaps more than 1).  Also, by pitting bad teams against each other, the league ensures that at least one of them will win those games (ignoring the rare tie).

That does a long way to explaining the general improvement, but I’m still surprised at the average magnitude.  If you look closely, you can see that 3 teams are pulling the average way up, the 2012 Colts, the 2008 Dolphins, and 2010 Rams.

What happened to each of these teams?  I explored this a few months ago, but let’s go again.

2011-2012 Colts:  This one is easy.  Andrew Luck.  The 2011 Colts were terrible and were then awarded the #1 draft pick.  The team also got a new coach (Chuck Pagano), though I’m going to assign most of the credit to Luck, perhaps the greatest QB prospect in my lifetime.

2007-2008 Dolphins:  The team improved by an amazing 10 wins.  Why?  Well the Dolphins, after finishing with 1 win, received the #1 overall pick, selecting Jake Long.  The team also changed its front office (bringing Bill Parcells and Jeff Ireland in) and its coaching staff (hiring Tony Sparano).  The team also brought in a new QB, Chad Pennington.

My twitter followers will know that Chad Pennington has a career passer rating above 90 and holds the NFL record for completion percentage (66%).  He was a lot better than people remember.

2009-2010 Rams:  Again, the team received the #1 draft pick and took a QB, Sam Bradford.  The coaching staff did NOT change, though Steve Spagnuolo was entering just his 2nd year (so 2010 was his first year with “his” quarterback).

What does it all mean?

The Eagles will be better in 2013 than they were in 2012.  There are MANY factors working in their favor.  Additionally, as seen above, a new coach is often the key to a quick turnaround.  Note that the new coach effect sometimes flames out, but for now we are just looking at next season.

Also, the common denominator above is a new QB.  The Eagles don’t exactly have one of those (I’d be very surprised if Barkley won the job), but it’s not like Nick Foles has been a long-time starter, so I believe he can have a similar effect (I’m not expecting Luck-level improvement here).

However, another key from above is the importance of high draft picks.  Put simply, Lane Johnson has to be an impact player…

IF Johnson isn’t a bust, the Eagles can easily win 7-8 games, with a realistic chance at getting to 9-10 wins and a division title.  To get to 7 wins, the Eagles need to win 3 more than last year.  7 of the 12 teams above improved by 3+ wins.

Also, looking at combined Offensive and Defensive performance relative to league average, if the Eagles improve by just the average measure above (+13%, +18%), the resulting performance would correlate to almost exactly 7 wins. (Maybe I’ll run that graph tomorrow).

P.S. If gambling were legal, the following lines would look VERY attractive to me:

Eagles Division Title: 5/1

Eagles Wins Over/Under:  7