How often do “Can’t Miss” prospects miss?

I previously stated that “no prospect is risk-free”.  Today we’ll look into just what that means.

The Data:

I went back through every draft from 2005-2011 and compiled the Scouts Inc. grades on each player taken in the first round.  According to the Scouts Inc. grading scale, any prospect with a 90+ grade projects as a potential “elite player”.  Recognizing that 10 points on a 100 point scale is a pretty big range, I will only look at prospects rated 95 or better.  Theoretically, these players should be the absolute best of the “elite” prospects and should carry a very low miss rate.  We’ll look at each rating and assign players to 1 of 3 categories:  Hit (Those who can be considered elite players), Bust (completely non-productive players), and everyone else.  Forewarning, I’m going to err on the positive side but feel free to assign your own if you disagree.  At the end, we’ll total up the categories and see what happens.

Note: These types of breakdowns typically devolve into parsing Hits/Busts, as everyone will have their own opinions on which players belong in which categories.  This is not my goal.  My hope is that while there will be disagreements over a few of the ratings, the overall numbers will provide useful insight.  Remember, this is not an individual player analysis, it’s an attempt to draw insight into the broader “elite prospect” pool.  One or two ratings changes won’t matter that much.

Also, we are much more interested in the “Busts”, so moving players from “Hits” to “Everyone Else” or vice-versa doesn’t really effect what we are looking at.

The 99s:

We’ll begin with the absolute best, those players receiving a 99 pre-draft grade.  Here they are:

Screen Shot 2013-03-05 at 3.57.01 PM

Hits: Aaron Rodgers, Calvin Johnson, Andrew Luck (a bit early but remember we’re being generous).

Busts: None

The 98s: 

Screen Shot 2013-03-05 at 4.12.37 PM

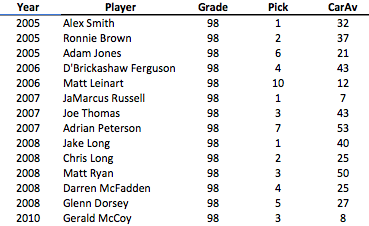
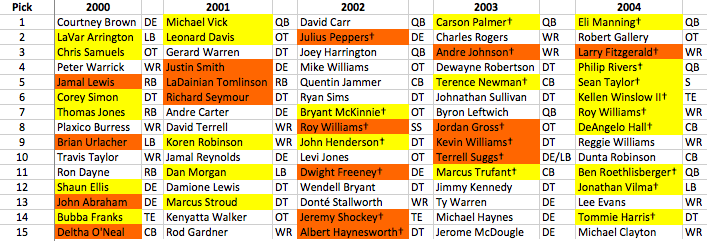
Hits: Ferguson, Thomas, Peterson, Jake Long (on the edge due to last year), Matt Ryan, Gerald McCoy

Busts: Adam Jones, JaMarcus Russell, Matt Leinart

The 97s:

Screen Shot 2013-03-05 at 4.18.24 PM

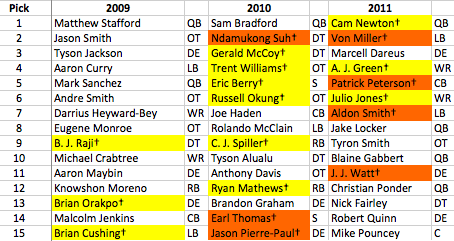
Hits: Suh, Von Miller, A.J. Green, Patrick Peterson, RG3, Marcell Dareus

Busts: Mike Williams, Brady Quinn, Jason Smith, Curry

The 96s:

Screen Shot 2013-03-05 at 4.30.11 PM

Hits: Ngata, Keuckly

Busts: Sims, Quinn, Rivers, Gabbert, Maybin
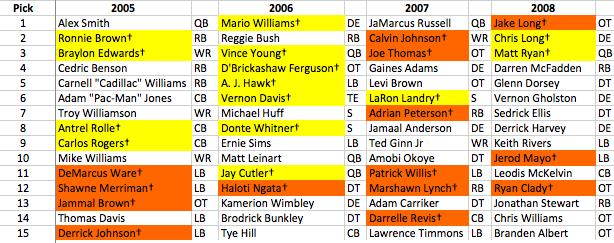
The 95s:

Screen Shot 2013-03-05 at 4.37.02 PM

Hits: Merriman (was elite while on roids, so i guess that counts), Willis, Revis, Earl Thomas (ugh)

Busts: Travis Johnson, David Pollack, Alex Barron, Jamaal Anderson, Amobi Okoye, Derrick Harvey

The Totals:

The 99s:  Hits – 3/5, Busts – 0

The 98s: Hits – 6/14, Busts – 3/14

The 97s: Hits – 6/21. Busts – 3 4/23

The 96s: Hits – 2/21. Busts – 4 5/21

The 95s: Hits – 4/30, Busts – 6/30

In looking at those totals, it’s clear that there is actually a difference in success odds for each discrete rating, which really surprises me (though it’s hardly enough data to confirm). In general, there is a clear decrease in Hit odds and corresponding increase in Bust odds as you move from 99 to 95.

However, it also clearly shows what I was originally hoping to illustrate: There is no such thing as a risk-free prospect.  I realize that none of the 99s rated as busts, but since there are only 5 of them, and given the Edwards and Bush careers, I think its safe to say we will see a 99 bust at some point.

In total there were 93 prospects included that rated 95 or better.  Of these, I rated 16 18 as Busts, or 19.35%.

So examining the absolute best of the best prospects, almost 20% of them end up busting.     I realize this is a very subjective breakdown, but even with a few changes either way, the overarching point remains, even the best prospects have a significant chance of complete failure.

BPA absent Positional Value adjustments

Last post I attempted to explain, in no uncertain terms, why taking a Guard in the first round makes little sense (especially in the top half of the first round).  However, I get the sense that many people remain unconvinced.  Today, I’ll take a slightly different look at it to see if I can sway the remaining holdouts.  I apologize for the repetition in subject-matter, but this is an EXTREMELY important topic, as it goes to the heart of Optimal Draft Strategy.

First, I want you to ask yourselves if you agree with the following statement:

GMs should, in general, take the Best Player Available (“BPA”) with every draft pick.

I’m guessing most readers here would back that strategy, and I certainly do.  HOWEVER, it is not enough to just endorse that statement and use it as the basis for a draft strategy.  First, you must definite exactly what BPA means.

Here is where I am seeing some confusion and where I believe there is a big disagreement.  The people calling for taking Warmack high in the draft (forget about the Eagles for a moment, I’m speaking in broader terms), are using BPA as support.  The problem is that, in their BPA definition, they do not seem to be adjusting for positional value, which is a MASSIVE mistake.

Rather than attempting to explain why with a rational argument (for that see my last post), I’ll try to illustrate it.  Here are the top ten OTs and Gs from this past season, according to Pro Football Focus.  They are listed in order, with their original draft pick included.

Screen Shot 2013-03-04 at 11.34.40 AM

There are two big takeaways from this chart.  First, look at the draft picks.

I know I’ve said this repeatedly, but if you want an “elite” OT, you have to take him in the first round.  The same clearly does not hold for the Guard position.  This provides a clearer illustration of the opportunity cost argument I made last week.  There are really only two ways to get an elite OT in the NFL, draft him or sign him in FA. (I know we traded for Peters, but that’s a RARE exception).  Additionally, signing an elite OT in FA requires a huge contract.  Therefore, the BEST way to add a top OT to your team is to draft him in the first round.  Choosing a G means you are forgoing that opportunity.

The second point I want to highlight from the chart above gets at positional value.  Again, I want you to answer a question:

All other things being equal, would you rather trade Anthony Davis for Evan Mathis (or any other top Guard) or vice-versa?

I’m a big Mathis fan, but that’s a no-brainer.  Clearly most of the league agrees as well, hence the salary differences between OTs and Gs.

Assuming you agree, that means the #10 OT is worth more than the #1 G.

How about Brandon Albert versus Evan Mathis?

This one probably creates a bit more disagreement, but my guess is, on the whole, people would take Albert, who ranked as the 25th best OT according to Pro Football Focus.

Regardless, clearly there is a discrepancy in value between OTs and Gs.  Also, while I’ve focused on Gs and OTs, the same analysis can (and must be) done with all positions, and then incorporated into each team’s prospect rankings.  To not account for this is a huge mistake and one that appears is made by a lot of the writers who support taking a G high in the draft under a flawed concept of BPA.

To make sure I’m being clear: This should be incorporated into the “tiered” rankings I advocated previously.  So it is theoretically possible for a G to be the best choice with a top 15 pick, but it would require an amazing G prospect that can overcome the positional value difference to make it to the top 1 or 2 tiers, as well as every other player (from positions of greater value) within the same prospect tier being taken before said top 15 pick.

Hopefully this has convinced a few more of you, or at least provided a clearer explanation of what I was getting at last week.  This isn’t exactly Eagles-specific, because I don’t think there’s any way they take Warmack at #4, but it applies to any team with a top 15 pick.

Lastly, I’ll leave you with an analogy.  A frequent defense of G picks (and OL picks in general) in the first round has been that they are “safer”.  In general, that is true, as our strategy chart showed.  However, this is only one half of the equation.  As anyone in finance knows, evaluation is always a question of risk vs. REWARD.  To look at one side and ignore the other is a recipe for sub-optimal decision-making.

For example, given the choice between to raffles, and ignoring an external factors, which would you rather enter:

A) 60% chance of winning $100.

B) 75% chance of winning $75.

While the odds of success for raffle B are significantly higher, the correct answer (in a vacuum) is A, since the expected payout is greater.  It’s impossible to apply such specific values to players, but it’s a useful exercise nonetheless.  Here, imagine a DE as raffle A and an OL as raffle B.  To take the OL just because he offers less risk (25% chance of miss versus 40%) would clearly be a poor decision.

Dispelling the Chance Warmack Nonsense

I’ve been asked by a few people about my thoughts on Chance Warmack, so today I’ll attempt to provide a definitive explanation for why taking him with the 4th pick (or any high pick for that matter) is almost definitely a terrible idea (I’ll explain the one scenario that makes sense as well).

Although I have been clear about the Eagles not taking him, I haven’t fully explained, and judging by this article (Don Banks mock draft), there needs to be a reasoned analysis.

The first big point to consider is that Warmack is NOT risk-free.  No draft pick is, regardless of what scouts believe.  While some picks/positions are clearly LESS RISKY than others, every selection carries a chance (I really wish that wasn’t his name) that the player won’t pan out.

Let me provide a few quick examples.  Here are some pre-draft scouting reports, followed by the corresponding player:

One of the more versatile offensive tackles to enter the draft in a long while, [He] is a terrific prospect that will offer immediate returns as well as long-term potential. Should quickly come in and start as a left tackle for a franchise, yet could also grow into a dominant strong-side blocker. Will only get better as he physically matures and improves his skills as a run blocker. SI.com

The Player?  Robert Gallery, selected #2 overall.

“I can’t remember being in such awe of a quarterback in my decade of attending combines and pro days. [His] passing session was the most impressive of all the pro days I’ve been to. His footwork for such a big quarterback was surprising. He was nimble in his dropbacks, rolling out and throwing on the run. The ball just explodes out of his hands.” – Todd McShay

The subject?  The immortal JaMarcus Russell.

Athleticism at the…position is unmatched by any player drafted in the last decade.  Incredible vision…Surprising power and is not afraid to run people over.  Absolutely chiseled physique…good character guy…Threat to score every time he touches the ball, and he should do that a lot in the NFL…Rarely does an athlete of this caliber enter the NFL. -draftclass.com

Player?  Reggie Bush

Obviously there are a lot of players that we can look back and poke holes in, but the fact is each of the above players was considered very low risk at the time they were drafted.  I’m not saying Warmack will be a bust, odds are he’s gonna be very good, but let’s just remember that scouting reports don’t always pan out.

The second and more significant reason for not taking Warmack (or any guard) is Opportunity Cost. When you use a draft pick, you are not just selecting a player, you are also deciding NOT to use that pick on a different prospect(s).  You can’t evaluate each choice in a vacuum, you must look at what else is available, otherwise the whole idea of “value” gets thrown out the window.

Remember our rule of thumb regarding the draft:  Elite players come from the first round, and mostly from the top half of the first round, REGARDLESS OF POSITION (with a few exceptions like K, P, FB, etc…)

Before we fully consider that, let’s also bring our draft strategy card into the picture:Screen Shot 2013-02-28 at 2.12.35 PM

Sorry for the small font, but there’s a lot of info in there.  To refresh, the chart shows the odds of success by position and round for prospects taken in the draft from 1999-2011.

By combining our elite prospect guideline with this chart, it’s pretty easy to see why taking a guard is a bad idea in the top of the first round.  If we gauge the relative impact by position, Guards come out near the bottom (which is why so few are drafted highly).  The fact is, a dominant DE or T will have a greater effect on the game than a dominant G.  Also, there are very few opportunities to add elite players at high-value positions, with the Draft being, by far, the best route for all teams (as a result of the contract value).

Therefore, choosing Warmack means you are forgoing the RARE opportunity to add an elite player at a more valuable position.  If it was easy to find top OTs or DEs or DBs, then taking a G wouldn’t be such a big deal.  Unfortunately, if you don’t use the draft for the high value positions, it becomes VERY difficult and almost ALWAYS expensive to fill them through other avenues (FA, Trades).

I should note at this point that this does depend on the draft board.   I am a firm advocate of BPA strategy.  However, there are enough positions of higher value than G that I’m extremely confident there are better options than Warmack at #4.  Remember that we shouldn’t be ranking players individually, but rather slotting them by tiers to account for the large margin of error in player evaluations.  So looking at the tier that includes  Warmack (varies according to team board), there is a very high likelihood that, at #4, there is another player within that tier that plays a more impactful position.

Lastly, if we look at the chart, we can see that Guards are among the easiest to find late in the draft (highest probability).  In the 6th round, for example, 21% of guards selected from 1999-2011 became starters (started for at least 5 seasons or half of their time in the league if they were drafted less than 5 seasons ago).  Conversely, just 5% of DEs and 4% of DBs taken in the 6th became starters.  While players selected that late are very unlikely to be “elite” players, you’d clearly take an Elite DE/average G combo over the reverse.

To sum up before I get to the one exception scenario, the goal in the 1st round of the draft for EVERY team needs to be MAXIMIZING IMPACT.  Each year 15 teams (top 15 picks) get a reasonable shot at adding an “elite” player.  Outside of that draft choice, the opportunities to add elite players are few and far between.  Most often, the only other option is for teams to overpay in free agency, especially for premier positions.  Therefore, teams cannot squander their best opportunities to add elite players on lower-impact positions, regardless of how strong the prospect is.

I mentioned at the top that there was one (extremely unlikely) scenario where it made sense to draft Warmack:

BOTH:

– Warmack would have to be in his own tier, and CLEARLY a far better prospect than anyone else on the board.  From what I’ve seen, that is not the case.

– There would have to be NO interest in trading for the Eagles pick, eliminating that as an option.  Even a trade involving relatively less compensation than normal would be enough to move, so I really do mean that a trade would have to be nearly impossible.  Again, the odds of there being ZERO interest in anything approaching a reasonable offer for the #4 pick are very low.

OR – the subject Guard (not Warmack) would have to be so amazing as to completely redefine the Guard position.  I’m not even sure what that would look like.  Safe to say it’s not happening anytime soon.

So for the time being, ignore Don Banks and anyone else suggesting the Eagles should/will take Warmack.

Round 2: Luck vs. Skill in the NFL Draft

Round 1 looked at historical draft performance and persistence based purely on total production as defined by CarAv.  Today we’ll make an adjustment to the model and rerun the analysis to see if anything changes.

For reference, Round 1 found absolutely no correlation in team performance from one year to the next.

The adjustment for round 2 is accounting for draft position. Using the default NFL Draft Chart, I assigned a draft points value to every player selected from 1999-2009.  I then summed up the total draft points used by each team each year, and divided that number by the total CarAv to arrive at a Points per CarAv value, which I then used to rank teams each year.

This should sound very familiar, as it is similar to the method I used in our first draft performance ranking.  However, while that analysis looked at best performance over the whole length of time, this is only concerned with performance each individual year.  As such, we don’t have to adjust for the cumulative nature of CarAv, so the rankings are a bit different.

Before we start parsing the results, here is the new ranking:Screen Shot 2013-02-26 at 12.48.19 PM

This one definitely passes the eye test.  At the top of the board are Indy, Baltimore, Green Bay, Pittsburgh, and the Giants.  Notice anything in common?

Meanwhile, at the bottom of the board are Detroit, Oakland, Cleveland, and Arizona.

So before digging in, it appears to be a reasonable ranking according to what we know of each team’s performance.

The Caveat – Using this system accounts for teams that perennially pick at the end of the draft (or the beginning), that way a team like the Patriots doesn’t get penalized for not finding similar quality players as a team like Cleveland, which, on average, picks much higher in the draft.  However, using the NFL Draft Value Chart does have a drawback.  The  chart is HEAVILY skewed towards the top of the first round.  For instance, the #1 pick is worth 3,000 points while the last pick in the draft is worth just 2.  The upshot is that using it to adjust for team draft position skews the results in favor of teams who do not have a lot of Draft Points (i.e. good teams that don’t pick high in the draft or teams that don’t have 1st round picks).  This is an area that I will try to adjust for in a future analysis.

Luck vs. Skill – Remember that if the draft is mostly skill, there should be positive correlation between team performance one year and the next.  How much correlation? That’s up for serious debate.  Regardless, here is the chart followed by the correlation value:Screen Shot 2013-02-26 at 1.02.14 PM

Doesn’t look like much, so I added a trendline to make it clearer.  The value is .167.  Not huge, but significant, and certainly a different story from the last look, which showed no connection.

If we take a step back, this comes out where I imagined the luck vs. skill argument to be when I started the original analysis.  I believe that there is obviously skill involved in the draft, but that luck is far more determinant of team success in this area of the NFL.  In general, my theory is that GM skill is illustrated by moving around the draft to maximize value/odds, and not necessarily in selecting players.  A lot more to do to support that, but I think this analysis is a step in the right direction.

Other notes from the analysis:

– It should come as no surprise that, according to this analysis, the Eagles 2002 draft remains its best.  Overall, the team’s average ranking over the subject time period was 15th.

– The Eagles were one of the most schizophrenic teams when it comes to draft performance, with a more volatile ranking than all but 3 teams (Jets, Miami, and Denver). The Broncos were least consistent.

– By this measure, the Eagles worst draft during the Andy Reid Era was 2003, when the team spent 26.71 draft points per CarAv.  For comparison, in 2002 (best draft), the team spent just 6.15 draft points per CarAv.  For those who don’t remember, 2003 was the Jerome McDougle, L.J. Smith draft.

– Over the subject timeframe, the Eagles have spent 3.74 draft points LESS than the league average per CarAV, which ranks 9th best in the league. (Chart below)

– The Colts spent 8.70 LESS draft points per CarAV than league average, while the Lions spent 13.05 points MORE than league average…

– The Detroit Lions have been shockingly inept when it comes to the draft.  The teams average ranking is 26th, but for a clearer illustration, here are the Lions 1st round picks from 1999-2009:

Screen Shot 2013-02-26 at 1.18.30 PM


Remember the post on how important it is to hit in the first round?  Needless to say, the Lions blew it…repeatedly.  To be fair, the team’s most recent #1s look OK (Suh, Fairley)…if you forget about Jahvid Best.

– The Patriots have fallen off dramatically.  From 1999-2003 the team’s average ranking was 10.6.  From 2004-2009 its average ranking jumped to 19.

– While the above analysis looked at average ranking, here is a chart showing performance over the whole time period, as defined by average draft points per CarAV minus league average. (So average team performance versus league average). Negative numbers = better performance.

Screen Shot 2013-02-26 at 1.46.47 PM

There’s a lot more I can do now that I’ve put the information together (which took much longer than I expected).  So expect to see a few more points from this analysis.

Overall, the evidence still stands heavily in luck’s corner in its fight with skill for the soul of the NFL Draft, though it’s fair to say skill has landed a couple jabs.


Luck vs. Skill in the NFL Draft

Today I’m going to take a shot at divining the relative importance of luck versus skill in the NFL draft.  This is a complicated subject, and as such I’ll probably try a few different methods over the next few weeks.

Before I get started, I’d like to note that this is a different analysis than the previous draft performance evaluation I did.  Whereas that attempted to grade teams according to how efficiently they used draft resources, this breakdown is purely about maximizing production.

Ranking the teams:

The first step I took was to go back through each draft and rank team performance each year.  I used the Pro-football-reference.com CarAV stat to gauge individual player production, then added each to get a measure of every team’s draft class by year.  I then ranked each team according to that production for each year and used those rankings to arrive at an average draft performance ranking.  This table should make things a bit clearer:

Screen Shot 2013-02-22 at 2.56.22 PM

I know it’s tough to see, but those with good eyesight will find annual draft rankings for each team from 1999-2009.  The one big note here is that the CarAv numbers do not include this year’s statistics (I haven’t updated my database yet).  So players who broke-out this year will not be fully accounted for.  Also, this does not account for different numbers of draft picks, so teams that trade picks for players will be undercounted here.  This is ONLY a measure of total production.

As you can hopefully see, the Eagles performed quite well by this measure (as they did in our other draft analysis).  Here the team is ranked 8th with an average ranking of 14th.  The team’s best draft came in 2002, when the Eagles ranked 1st overall (the Brown, Sheppard, Lewis, Westbrook draft).

Other strong years for the Eagles were 2005, when they ranked 3rd overall (Patterson, Herremans, Cole) and 2009 when the team ranked 5th (Shady, Maclin).

Low points for the Eagles were 2003 and 2004 (ranked 28th and 30th).

Also, notice Super Bowl winners Green Bay, Indy, Baltimore, NYG, and Pittsburgh all placed in the top ten.

FYI, if you are examining the chart, you shouldn’t get too hung up on the 2009 rankings (or even 2008), as those are most subject to change once I add this year’s data.

Luck Vs. Skill:

Now that we have annual rankings, we can look to see if performing well one year gives any indication of performing well the following year.  If the draft is mostly skill, then those front offices that are “good” at drafting should be consistently ranked towards the top, with “bad” drafters consistently at the bottom.  Theoretically we’d see less consistency among the “bad” drafters since presumably being bad would lead either a change in strategy or a change in decision-makers.

The are some obvious caveats before I get to the numbers.  I did not account for changes in front office personnel.  The CarAv measure is far from perfect, as we’ve discussed before, so the rankings are bit subjective.  Additionally, not every team is trying to maximize production.  Some use draft picks to fill roster holes, so judging teams by player production doesn’t give them credit if they have other goals in mind (whether they should have any goal besides maximizing production is another story).

Below is the chart, but let me make something abundantly clear before I show it to you.  I AM NOT SUGGESTING THE DRAFT IS COMPLETELY LUCK.  As I just mentioned, there are a lot of caveats to this type of breakdown.  Also, as I said at the top, there are a number of different ways to look at the subject, so we can’t jump to conclusions from just one.

Still…

Screen Shot 2013-02-22 at 3.27.07 PM

Pretty much the definition of no relationship.

I also looked at multi-year averages in an attempt to get rid of some of the noise caused by a random bad/good year.  Below is the same chart, using average rankings from 99-01, 02-04,05-07,08-09 instead of individual years.

Screen Shot 2013-02-22 at 3.51.39 PM

Yet again, nothing there.

Again, this doesn’t mean there is NO skill in drafting, it’s just a starting point that suggests there MIGHT BE a lot of luck (and certainly a lot more than GMs would like people to think).  I’m going to try to account for some of the holes and weaknesses in this analysis, and I’ll repost when I finish.  There is a lot of potential noise here.

One more chart:Screen Shot 2013-02-22 at 4.19.17 PM

This is the frequency chart of our rankings.  Sure looks a bit Normal doesn’t it? (Normal=random).  The standard deviation is 3.37, meaning if it’s normally distributed we would expect about 68% of the values to be between 13-19 (inclusive).  In our table, 22 out of 32 are within that range….or 68.75%.

Additionally, we’d expect 95% of the values to fall within 2 standard deviations (outside the 10-22 range in our table).  We have 30/32…or 93.75%.

What this means (I could be wrong, I’m not a statistician) is that if luck was the sole determining factor for the draft performance rankings, you’d get a distribution that looks A LOT like the one we see above.

Lot’s more to do on this subject, but for now its Luck 1 – Skill 0.

Positional Breakdown of the top 15

After my last post about the historical odds of selecting an All-Pro caliber player in the top 5 versus 11-15, there were several comments about the potential effects of positional skew, so I will address those today.  For example, Quarterbacks are much more likely to be taken in the top 5 than anywhere else in the top 15 picks, so that could affect the overall All-Pro odds.

Before we get to some charts, let me note that one of the reasons I didn’t address this in the last post is that, when broken down by position, the sample sizes get very small.  Hence, we have to be careful not to jump to conclusions.  However, the skew effects by position are real and potentially very large, so it’s worth looking into.

I split the top of the draft into three segments, 1-5, 6-10, and 11-15.  Below are charts illustrating the positional breakdown for each.  We are looking at all drafts from 1995-2011.  The data labels are a bit ugly, but I wanted to show both the values and percentages by position.  Unfortunately, the colors do not match up by chart, so you’ll have to actually compare numbers if you want to dig in.

Screen Shot 2013-02-11 at 1.29.55 PMScreen Shot 2013-02-11 at 1.30.02 PMScreen Shot 2013-02-11 at 1.30.08 PM


We can see pretty clearly that there is a big difference in positional distribution.  Before we re-evaluate the All-Pro odds, its worth noting:

– QBs, not surprisingly, are much more likely to get taken in the top 5.  The premium on the position means teams are much more competitive for them and therefore have to use more draft resources (i.e. higher picks) in order to get them.

– Wide receivers show a very strange pick distribution, with 9 selected in the top five, 18 going between picks 6-10, and just 6 selected from picks 11-15.  Haven’t yet come up with a reasonable hypothesis for this (mainly the drop-off from 18 to 6) but it may just be random.

So how does this effect our “elite” player odds?

Well it depends on the position, obviously.  The overall thesis from the last post was that teams are no more likely to find All-Pro caliber players in the top five than they are to find them with picks 11-15.  Overall, the data bears that out.  However, if you are looking for an All-Pro quarterback, its pretty clear that you need to take them in the top 5, if only because  top graded QBs don’t last very long (so most “1st Round” QBs go in the top 5).

What happens when we look at positions that don’t exhibit great frequency variation by pick?

First, let’s look at Defensive Ends.  In the above charts we can see that from 1995-2011, 11 DEs were taken in the top 5, 9 were selected from 6-10, and 14 went between picks 11 and 15.  Were the top 5 picks any more likely to become elite players?

Screen Shot 2013-02-11 at 1.54.23 PM


Not really according to the data, but since the samples are small, we should probably stick to saying it’s “unclear”.  In any case, this chart certainly supports the notion that it’s probably better to trade down from the top 5 (at least if the team is set on choosing a DE).

Now let’s look at OTs, another position for which there is relative consistency in terms of frequency by draft pick.

Screen Shot 2013-02-11 at 1.59.10 PM


Again it’s unclear.  Here the odds in the top 5 are clearly better than from 11-15, but with just 8 picks in the latter range, we’re really taking a leap to infer anything significant.  Also, the odds here are better between 6-10 than from 1-5.

Outside of QBs, which are so skewed by frequency that we can’t do much with the data, the only position that appears to show a significant decline in odds of success as you move later in the top 15 is Wide Receiver, and the numbers here are shocking.

Screen Shot 2013-02-11 at 2.06.13 PM

To make it a little more interesting, here are the 6 WRs that were selected between 11 and 15:  Yatil Green, Troy Edwards, Rod Gardner, Donte Stallworth, Lee Evans, Michael Clayton.

I’m guessing most people here have only heard of 3-4 of them…

I could go position by position and give you the All-Pro chart for each, but I don’t think it’d be that valuable.  Some positions show slight odds declines, but remember, the question isn’t just “Are the odds better with a top 5 pick?”, it’s “is the difference in odds great enough to outweigh the compensation gained by trading down?”

In general, my previous point stands:  Teams would be better off trading down from the top 5 (while remaining in the top 15).  This doesn’t hold if you are taking a QB, but for everyone else, nothing I’ve seen contradicts this strategy.

But how could this be?  I admit it doesn’t make a lot of intuitive sense.  All of the “elite” players chosen between 11-15 were available with picks 1-5, so shouldn’t the odds have been better there? They should, but they’re not, mainly because NFL scouting isn’t perfect.

Overall, NFL scouts appear to be very good at segmenting players by general ability (tiers if you will).  That’s why elite players are predominantly selected in the first round and almost never slip past the second round.  HOWEVER, scouts do not appear to be good at sub-sorting those tiers.  So they can pick out the handful of DEs (or whatever position you want) that are the best, but ranking the players within that group is extremely difficult.  This is where the problem of false precision comes into play.  If teams would recognize that limitation, they would consistently trade down, selecting the last available player in the best “tier”.  GMs and scouts, though, appear to believe they can reasonably predict which individual player is going to be better,  leading them to use draft resources inefficiently.

If you play fantasy football, you should be familiar with this.  I’m betting at least some of you sort players by tier prior to each season, and draft accordingly.  So you don’t get hung up on which QB is the “best”, you just make sure you get one from the best group, understanding that it’s impossible to predict exactly who among that group will have the most successful season.

I’m going to do a deeper analysis of this concept soon and look at the relative performance of players according to order drafted (for instance, does the 1st player taken at any position outperform the next player taken at the same position), but for now, the Star/Joeckel/trade-down strategy remains (assuming those players are as highly regarded as currently indicated, Joeckel seems to be losing some ground to other OTs).


Big evidence for trading down with a top 5 pick.

Having some trouble with the Game Rewind program, so that’ll have to wait, but what I’ve done instead is far more interesting anyway.

We’ve explained pretty clearly that “elite” players come almost exclusively from the first round. Additionally, it was my expectation that the top 5 picks would see a much higher percentage of All-Pros/Pro Bowlers taken than in the rest of the round.   THIS IS WRONG!

I’ve been operating under the assumption that the Eagles at #4, must get an All-Pro player, because teams rarely get to pick that high in the draft.  However, it turns out the odds of getting an elite player are really no greater in the top-5 than in the top 15.  Here are the numbers:

I looked at every draft from 1995-2011 (slightly different time-frame than I typically use), counting how many All-Pros and Pro Bowlers came from each pick (insert normal caveat about Pro Bowl designation here).  Please note that if a player counts as an All-Pro, he does NOT also count as a Pro Bowler. So…

Screen Shot 2013-02-08 at 12.09.30 PM

Odds of getting an All-Pro player is no different in the top 5 than in picks 11-15.

Here is the same chart, with additional rows showing the comparison of the top 15 picks versus the rest of the 1st round.

Screen Shot 2013-02-08 at 12.13.16 PM

As you can see above, there is little difference within the top 15 picks (the Pro Bowl drop-off is notable, but the All-Pro designation is a lot more valuable IMO).  However, there is a HUGE drop-off after pick 15.   Admittedly pick 15 is an arbitrary place to split the first round, but it does appear to be close to (if not equal to) the actual inflection point when it comes to a dramatic shift in the odds of getting an elite player.

So what does this mean for the Eagles?  Well it depends on your viewpoint, but it certainly supports the notion that the Eagles’ optimal strategy would be to trade down from 4, picking up extra picks while staying in the top 15.  In fact, given how high the pick is, the team could probably trade down twice and still remain in the top 15.

If the team is blown away by either Joeckel or Lotulelei (my two current favorites for the team, with the DT ahead by a nose) and one of them is available, then the Eagles make that pick.  However, if there are ANY reservations about either, or if neither is still on the board, than the right move is to trade down to the bottom of the top 10 and either take the best available, or trade down another couple picks and then take the best available player.

I realize the All-Pro and Pro Bowl designations are a bit subjective, but creating any other criteria in order to identify “elite” or “impact” players would arguably be just as subjective, so this is what we’re going with.

For those who are interested, here are the draft picks I looked at, with All-Pro’s highlighted red and Pro Bowlers highlighted yellow.

Screen Shot 2013-02-08 at 12.25.59 PM

Screen Shot 2013-02-08 at 12.26.50 PM

Screen Shot 2013-02-08 at 12.27.31 PM

Screen Shot 2013-02-08 at 12.28.07 PM

Ozzie Newsome vs. Andy Reid (Drafting)

Lots of Ozzie Newsome plaudits going around, and justifiably so.  Since he is widely considered the best personnel man in the league, I thought it’d be fun to compare his drafts side-by-side with Andy Reid’s over his tenure with the Eagles.

Here is a breakdown of Ravens and Eagles draft choices since 1999.

Let’s start with the big one, the first round.  AP1 means All-Pro, PB means Pro Bowl, and St means seasons as a starter.  We covered CarAV before (its the pro-football-reference measure of production).  Please note that CarAv is not calculated for K/P, that’s why they each have a zero.

Looking over all of it, the big difference is in this round, which readers of this blog will realize is by far the most important.  Outside of McNabb, Reid just wasn’t able to produce impact players like Ngata, Suggs, Lewis, McAlister.  It isn’t enough to get decent players like Patterson in the 1st round.  Additionally, the aforementioned Ravens overshadow Newsome’s big mistakes with Boller, Clayton, Taylor.

Screen Shot 2013-02-06 at 1.04.17 PM

Contrast that to the 2nd round.  Suddenly Ozzie doesn’t look like a genius.  In fact, it’s a pretty clear advantage to the Eagles (not to say the Eagles haven’t missed a bunch of these picks.)  However, as we’ve seen, the 1st round is significantly more important than the rest of the draft combined.  So mistakes in the 2nd round aren’t nearly as punitive.

Screen Shot 2013-02-06 at 1.16.15 PM

The third round tilts in the Eagles favor, especially since B-West was drafted here.  Meanwhile,the Ravens’ 3rd round history is relatively undistinguished.

Screen Shot 2013-02-06 at 1.16.25 PM

Lots of misses in the 4th round for the Eagles, though they had more draft choices than the Ravens.  Notice this is where the Ravens grabbed players who could contribute significantly at relatively unimportant positions (FB, P, interior OL).  Production-wise it’s fairly close.

Screen Shot 2013-02-06 at 1.55.05 PM

The 5th round has to go to the Eagles since Trent Cole is by far the best selection from either team.

Screen Shot 2013-02-06 at 1.55.13 PM

This 6th round is a relative wasteland for the Eagles, though there’s hope Kelce will change that. Meanwhile the Ravens hit on Thomas and Taylor.  Note: that is not a typo, Derek Anderson really did make a Pro Bowl.

Screen Shot 2013-02-06 at 1.55.21 PM

Script gets flipped for the 7th round, as the Ravens haven’t found anyone useful.  The Eagles have done a pretty good job in the 7th, though that can also be attributed to the weakness of the team allowing players like Chaney and Coleman to become starters.

Screen Shot 2013-02-06 at 1.55.42 PM

As you can see, when it comes to drafting it’s a fine line between genius (Ozzie) and fired (Andy), but it depends largely on success in the 1st round.  The only real standout for Ozzie in the later rounds is Adalius Thomas.

Newsome has had a lot of success with UFAs, but in terms of the actual draft, he’s built his reputation on the performance of his first round picks, not late-round steals.

Eagles Inefficient Draft Choices

Using our chart from yesterday, I went back over the Eagles draft history from the sample time period and separated the “inefficient” picks from the “efficient” ones.  Note: After reviewing the chart, I made one change, taking the 4th round WR selection out of the “inefficient” category.

First a couple interesting notes:

– Overall, there are 3310 players included in this analysis.  League-wide, just over 42% of these are considered sub-optimal/inefficient picks by our chart.

– Exactly 50% of Eagles draft choices from 1999-2011 graded as sub-optimal.

– This is surprising because in our earlier analysis, the Eagles actually came out as among the better drafting teams in the league (top third, though there’s a big margin of error in those rankings.)

Up until now, this has been a largely abstract discussion, but it’s about to get real.  Below is a chart of all of the Eagles inefficient draft picks by our standards.  Look on in dismay… Unfortunately, since the Eagles are part of the sample, we can’t really say the team would have been better off if they had never made any of these picks, but it sure seems like that’s the case (it’s an all or nothing decision to use the strategy, so you can’t pick out Shady and Celek and give back the rest).

Screen Shot 2013-01-31 at 1.48.35 PM

Remember that I’m not saying all of these are BAD choices, just that for the team to make them, it should have had extremely strong support for why each player was better than the rest of the prospects at his position group.  I’m guessing that the Eagles, for the most part, did not apply that standard…though Shady does seem like he may fit that description as I recall him being rated significantly higher than any other RB at the time.

Given a do-over, how many of those picks would you still make?

Also, it sheds some light on supposed draft “steals”.  For example, we can all agree that Brent Celek was well worth a 5th round pick (in hindsight).  But how much credit should the Eagles get for that selection?

Using our sample, if you selected 3 TEs in the fifth round at random, you would have a roughly 39% chance of finding a “starter” (1-(.85^3)).  Not fantastic odds, but pretty good.  So was Celek skill or just the result of the overall odds given that the Eagles tried three times to find a TE in the 5th round?

P.S. I forgot to note yesterday that ZERO out of 54 DTs taken in the 7th round from 1999-2011 became starters.  The Eagles selected 3 such players.

I know I mentioned yesterday that I would discuss the whole Talent vs. Need philosophy, but I’m going to wait until I can add some more data to the discussion.

Hacking the Draft….Default Positional Targets by Round

Yesterday we took a look at the success rates of different positions by draft position and round.  Today, we’ll use the chart to go a step further, identifying Position/Round combinations that are clearly sub-optimal and eliminating them.  After doing this we arrive at a modified chart that provides some valuable information and can greatly inform draft strategy.  Please note that this analysis is based on the general philosophy that says: The draft should be used to maximize talent and increase the overall skill level of the team.  Free agency and trades should be used to plug roster holes.  I’ll detail why I believe this is the case tomorrow.

First, a few caveats.  All of this relies on the assumption that our sample (draft picks from 1999-2011) is representative of draft classes going forwards.  This may not be the case, but it’s a fairly large sample and I have no reason to believe it is significantly skewed.

Also, when broken down by position and round, we are dealing with small sample sizes.  For instance, our sample has just 10 centers that have been chosen in the 5th round, with just 2 qualifying as “starters”.  Obviously, this is not a large enough sample to conclude that 20% is the true probability of finding a starting center in the 5th round.  This is a good example of why we are refraining from setting strict rules, instead using it to develop a general strategy.

Lastly, the first round of the draft is fundamentally different from the other rounds, especially in the very early picks.  The goal in the first round (especially in the top 10) is to find an elite player, regardless of position.  Therefore, as a general instruction for using the strategy we develop here: It should be adhered to more strictly as it gets later in the draft.    So picks in the first round should be based largely on scouting and player evaluations, whereas picks in the 7th round should be based almost entirely on historical probability.  This is particularly important for Eagles fans, since the team has the #4 overall pick.  For that selection, throw this chart away and hope for an All-Pro caliber player at whatever position in which that skill level is available.

The Process:

Here is a sample chart comparing three positions and their associated success rates in each round:

Screen Shot 2013-01-30 at 9.42.19 AM

Focus on the first two rounds and think about which positions you would select in both the 1st and 2nd round.  While there is plenty of room for disagreement, my personal opinion would be that the DE position is the optimal choice in the 1st, despite the DB position having better odds of success.  The reason for this is the relative decline in odds as you move later in the draft.  In the second round, the DE success rate is just 36%, whereas DB success is still above 50%.  Conversely, LBs are clearly not a good decision in the first round, since the success rate for the position falls off very little as you move into the 2nd round, making a 2nd round LB a MUCH better value than a first rounder.

Using that relatively simple analysis and applying it throughout the draft, we get this chart:

Screen Shot 2013-01-30 at 10.29.40 AM

I’ve blacked out areas that, in my opinion, are not good values based on our stats.  Consult yesterday’s post if you want to check the odds yourself, but in most cases I just eliminated rounds that offered no better odds of success than later opportunities.  Careful observers will note that I could have gone much farther if I applied the relative draft pick value standard to each area.  For example, according to the default NFL Draft Value chart, a 5th round pick is worth more than four 7th round picks (a clear example of how flawed the Draft Value chart is IMO).  Applying that to the chart, you would obviously rather choose four DBs in the 7th round (9% success each) than one DB in the 5th round (14% success each).  However, due to the number of uncontrolled variables and the potential for non-representative samples, we need to be careful not to go overboard and fall victim to false precision.

Now that you know the general idea/process behind the chart, take a minute to look at it and you’ll notice some interesting things (and almost definitely pick up on things that I will fail to mention or haven’t realized).

My takeaways:

– The 5th and 6th round are particularly notable for the small number of positions for which these picks make sense.  The 6th round is a relative wasteland, suggesting that at this point scouting means nothing.  Therefore, if we stick to the chart, a team should either choose a DT, TE, or G in the 6th round or trade down into the 7th round.  Any other decision is an inefficient use of assets.

It’s possible the Patriots realize this, explaining why they were willing to move down a pick in the 6th round of 2011 (trading with the Eagles) for no compensation, in a trade reportedly made “just for fun”.

– This is also a clear illustration of why DEs are so valued by some teams.  If you do not choose one in the 1st round, the next opportunity to choose one efficiently isn’t until the 5th round, when your odds of success are just 23%.

– The 7th round might be best used exclusively on the OL.  Looking at the odds above, it’s clear that T/G/C have a much better chance of success as 7th round picks than any other significant position.

– RBs are incredibly hard to pick, and it is probably a better use of resources to just sign one in free agency.  (Hard to believe for Eagles fans, since both Shady and Bryce were draft picks.  These guys are RARE exceptions.)

– WRs are rarely an efficient pick, with just the 1st, 2nd, and 7th rounds as value opportunities according to our chart.

There is plenty more we can do with this information, but I’ll hold off on that until another day.  In particular, we can use this to grade teams’ performance over the past decade, which I hope to do soon.