Hacking the Draft…Comprehensive Chart

Hopefully everyone has enjoyed the round-by-round breakdown.  While there are obviously a number of variables that can’t be controlled for, the pure statistical look at each position group has already provided some interesting insight.

Before I get to the big chart, let me just clarify exactly what I think this type of analysis is good for, then dig into an Eagles example.  Feel free to skip to the chart and come back.

The purpose of this is NOT to arrive at a set of rules by which teams should draft players.  Instead, it is meant to provide a general guideline, or a “default draft position”.  For example, yesterday I said that selecting DEs in the 3rd round is a terrible value proposition according to the data I’ve collected.  That doesn’t mean drafting a DE in the 3rd round is ALWAYS a terrible decision, it just means that for a team to make that decision, it must see or know something about the subject player that makes him CLEARLY much better than any other prospect available at that position.

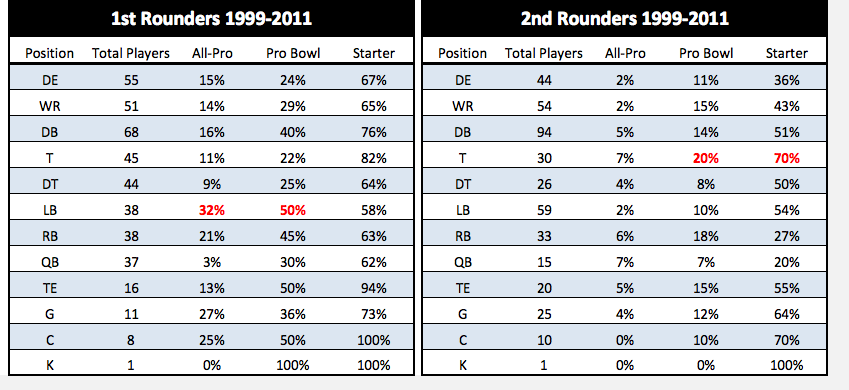
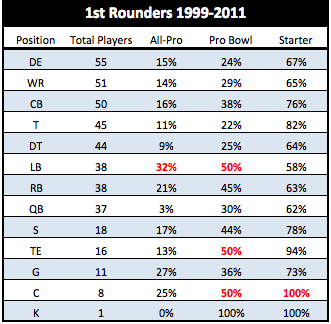
The biggest flaw in NFL draft strategy, as far as I can tell, is each team’s confidence in its own ability to evaluate talent.  Regardless of the general manager, every team has historically had a very large margin of error when it comes to talent evaluation.  For instance, in the 1st round less than 6 in 10 LBs selected from 1999-2011 had or are having significantly productive careers (according to our definition.)

So what does that mean?  It means teams, in general, should be mostly focused on value during the draft, as opposed to parsing prospects.  This is perhaps never more apparent than when a team decides to trade up to select someone.  Let’s use the Eagles as an example.  NOTE: This is a very rough example, with numbers pulled from my ass, and is only meant to illustrate a larger point.

When the team traded up for Brandon Graham, it swapped 1st round picks with Denver and gave up two 3rd rounders as well (moving up from 24 to 13).

At the 13th pick, no DEs had been taken.  Between picks 13 and 24, 3 were taken, including Graham.  So that means the Eagles, in their analysis, decided that they had to take a DE (will not argue that decision here, though I was mad they passed on Early Thomas, and can produce witnesses that will verify I said that when it happened).

The only way the trade made sense was if the Eagles, in their DE analysis, decided that the odds of Graham becoming a stud DE were MUCH higher than the odds of JPP, Morgan, or Hughes becoming a stud DE.  Here is where the “margin of evaluation error” comes into play.

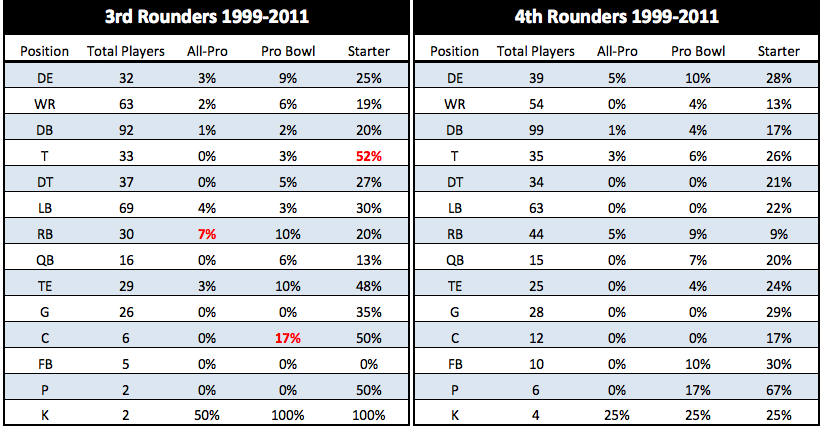
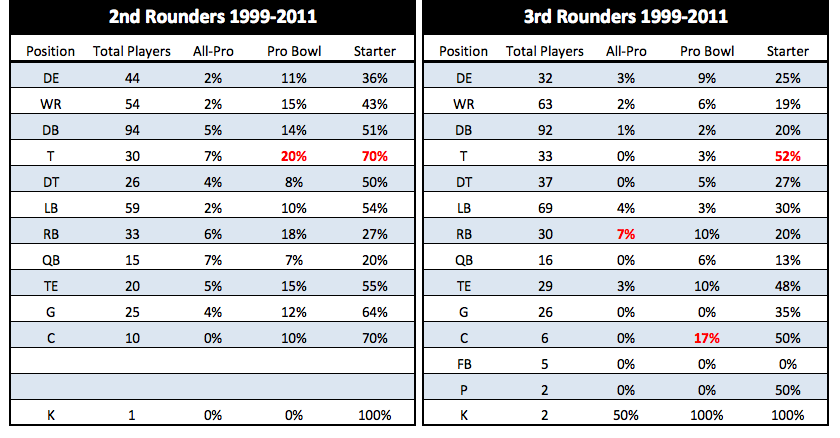
Using our historical draft data, we can calculate the odds of getting a starting DE with a 1st round pick and two 3rd round picks (I realize they were hoping more than an average starter, but stay with me).  Using the table below, we can calculate those odds to be 81.5%.  Using the Pro Bowl percentages from the earlier tables, we arrive at 37% for the odds of getting a Pro Bowl DE if you select DEs with a 1st round pick and 2 third round picks.  So here is the breakdown for “generic DEs”:

– 1st Round Pick – 24% chance of Pro Bowl, 67% chance of starting

– 1st Round Pick and 2 third round picks – 37% Pro Bowl, 81.5% starting.

Please note that this DOES NOT mean the Eagles made a bad decision.  Obviously the odds should be better for the 13th pick than for the 24th pick (we’ll get to that another time).  It DOES MEAN, however, that the Eagles, in their evaluation of Brandon Graham, should have been almost certain that he was more than 37% likely to be Pro-Bowl caliber, and more than 81.5% likely to start.

I have no doubt that they believed this, BUT, if they had applied a margin of error to their own analysis (as any good team should) prior to making the trade, they would have been unlikely to go through with it.  Let’s be extremely generous and assume the Eagles front office could peg these odds with a MOE of +/- 15% (WARNING: overly simplified statistics).   That means if they estimated Graham had a 90% chance of starting, his true odds of starting were almost definitely between 75-100%.

Immediately we can see an issue.  Even giving Graham incredibly high odds of starting (90%, which is more bullish than any team should be with any players outside the top few picks) and the Eagles a very generous MOE (+/-15%), the resulting range still does not exclude the 81.5% starting odds for the generic position of a first and two thirds (although it is near the bottom of that range).

That means the Eagles really should NOT have been (though I’m sure they were) confident that Graham would be better than just taking whichever DEs were available at #24 and in the third round, and hence, should not have made the trade.

I don’t mean to suggest that trading up is never a good idea, simply that the evaluative bar for whichever prospect is the target must be EXTREMELY high, and much higher than the standard currently being applied by most teams.

My final point:  Teams do not appear to take a probabilistic approach to drafting (which they almost certainly should), and I would guess that they do not actively overlay a margin of error onto their evaluations.  This is very much a “new-school vs. old-school” issue, similar to the statistical revolution in baseball, but IT IS NOT THE SAME.  It is largely a matter of GMs being willing to recognize and account for their own shortcomings and cognitive biases.  The franchises that can apply this will, in the long run, be more successful than those that don’t.  (Looking into which teams might be using this type of strategy will be another day’s post)

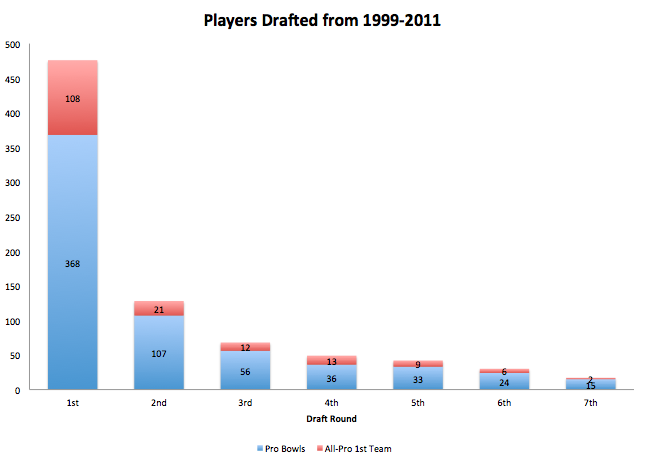
Ok, enough talk.  Here is the chart with every round included. I removed the All-Pro and Pro Bowl columns to make it easier to compare.  Dig into it and see what you think.  Later this week we’ll mine it for an “optimal default strategy”.

Screen Shot 2013-01-29 at 10.54.06 AM

Hacking the Draft…4th round breakdown

Today we get the 4th round historical breakdown and, finally, we get some incredibly interesting results.  As a reward for sticking with me through this, I’ll give you a couple takeaways first, which I’ll follow with the chart.

– In the 3rd Round, teams should NOT DRAFT:  Defensive Ends, Defensive Backs, Quarterbacks, Fullbacks.

– Conversely, teams should focus on: Tackles, Running Backs, Tight Ends.

Here is the side-by-side comparison, at this point IGNORE the All-Pro and Pro-Bowl columns:

Screen Shot 2013-01-28 at 10.57.23 AM

Plenty to notice here.

– Most surprising are the position groups I listed above.  From 1999-2011, 3rd round DEs, QBs, and FBs were LESS LIKELY to become significant contributors than were 4th round picks at the same positions.  (DBs in the 3rd and 4th round were about equal)

– We must also keep the relative value proposition in mind.  Looking at the default NFL Draft Value Chart, an average 3rd round pick is worth TWO 4th round picks.  So let’s game out an example:

Team A wants a DE and is sitting at its pick in the 3rd round.  That team can either select a DE or trade down, picking up two 4th round picks in exchange for the 3rd.  That team can then use BOTH 4th round picks to select two DEs.  Which offers better odds and by how much?

3rd Round DE:  25% chance of a starter (chart above)

Two 4th Round DEs: 48% chance of a starter (.72*.72=.5184 chance of missing both, 1-.5184=.48)

So by making the trade, the team has nearly DOUBLED its chances of finding a starting caliber DE.

– Also notice that our 2nd round breakdown showed that DEs chosen in that round have a 36% chance of starting.  Here, the value proposition looks incredible.  According to the Value Chart, an average 2nd round pick is worth nearly 6 4th round picks!  Obviously it’s almost impossible to make that trade (no team has six 4th round picks in the same year), but there appear to be severe inefficiencies in the draft value chart.

– The Eagles, over that time-frame, used three 3rd round picks on DEs…

– The Eagles, over that time-frame, used two 3rd round picks on DBs…

– The Eagles, over that time-frame, had 12 TOTAL 3rd round picks.  They used nearly half of them very poorly.  (Statistically speaking, not a grade of how those picks actually worked out)

Caveat – This analysis is based on nothing but the overall odds of each position groups success.  I did not control for the fact that different teams had different numbers of picks.  So it’s possible that (if drafting has a lot of skill) bad drafting teams had more 3rd round picks, skewing the results.  We’ll get to the skill aspect a little later, but I am very skeptical that it has resulted in any significant skew to these results.

Tomorrow, I’ll show rounds 5-7 and then we’ll start putting together an “ideal” draft strategy.

Draft Breakdown: 3rd Round (1999-2011)

Continuing our draft breakdown, here is the 3rd round.

Quick reminder:  To count as a starter, a player must have either started for 5 seasons or, if they haven’t been in the league that long, started for at least half of their career.  Not a bulletproof method (doesn’t account for the quality of the starters), but good enough to be informative.

Also, I’ve added rows for FBs and Punters, since there were a few of them drafted in this round.  Players and stats are from Pro-football-reference.com.

Here is the 3rd round chart (side-by-side with the 2nd round chart):

Screen Shot 2013-01-23 at 5.01.18 PM

– Notice that Tackles and Centers are still at or above 50% starters, compared to 70% for T/Cs taken in the 2nd round.

– The biggest decline was among DBs, with 20% of 3rd rounders starting compared to 51% for those drafted in the 2nd round.

– There was very little difference between 2nd round TEs (5/15/55) and 3rd round TEs (3/10/48).

– Less than 1 in 5 WRs taken ended up a starter.

Just a few more round to go, then I’ll try to put a graph together that lets us look at everything at once and identify the optimal rounds for each position.

2nd Round breakdown 1999-2011

Last week we looked at the performance of 1st round draft picks made from 1999-2011.  Now let’s take a look at the 2nd round.

I’ve made a slight adjustment, grouping CBs and Ss together as DBs.  I did this because players frequently switch back and forth between these positions, and it’s tough to know what teams were projecting each player to play when they were drafted.

Below is the chart, I’ve placed it beside the 1st round chart to allow for easy comparison.

Screen Shot 2013-01-21 at 3.24.18 PM

Takeaways?

– It should come as no surprise that the % of All-Pros and Pro Bowl players has dropped precipitously.  As I showed in an earlier post, as a general rule, elite NFL players come from the 1st round.  Finding elite talent after that is fairly random.

– Second round LBs have almost the same odds of starting (54%) as do LBs taken in the first round (58%).  This certainly supports the Eagles past philosophy of avoiding LBs early in the draft.  However, it remains to be seen whether that holds past the 2nd round.

– Second round DEs start just 36% of the time, compared to 67% for 1st rounders.  This might be the most surprising result.  It appears as though if you need DE help, you have to get it in the 1st round.

– Conversely,  70% of Tackles taken in the 2nd round ended up as starters.  Additionally, almost the same percentage made a Pro Bowl as those take in the first round.  This would seem to suggest that if you can’t get an Elite OT prospect, likely in the top 10, than it is better to wait and take a T in round 2.

– 2nd round running backs have performed rather poorly.  Just 27% have become starters.  Shady is the exception to what should be a rule against drafting RBs in the 2nd.  RBs also were among the worst performers in the 1st round.

Soon we’ll add the 3rd round, which should allow us to start seeing trends.  Eventually, we’ll have a good idea of what positions the Eagles should target and when in the draft they should take them.  This won’t hold for their top pick, but the mid-late rounds are likely much more luck driven, in which case the team should look to historical data for guidance.


Draft History Breakdown – 1st Round

Which positions are most likely to fail/succeed when taken in the first round?

I pulled the data and put together the chart shown below.  Note that counting someone as a “starter” is a bit subjective.  Inclusion in the below data means that a player started for at least 5 years in the league, or if they joined the league less than 5 years ago, has started for more than half the time.  However, just because they have started doesn’t mean they have been good.  Unfortunately, an analysis that deep will have to wait.  For now:

Screen Shot 2013-01-16 at 2.32.56 PM

Takeaways:

– It does appear as though the conventional wisdom regarding O-Linemen is correct.  They are typically safer picks, as evidenced by the high starter % for G/C/T.

– Choosing a QB is, statistically, a very bad decision.   Just 62% of the 37 QBs drafted in the first round ended up “starting” for a reasonable amount of time.  However, that number is definitely inflated, as the sunk cost aspect of choosing a QB with a high pick (at least until the most recent CBA) led teams to continue starting players who didn’t deserve to.

Unless you’ve got a top pick and there is a truly incredible prospect, you SHOULD NOT DRAFT A QB.  Hopefully Chip Kelly reads this before jumping on Geno Smith at #4.  That’s not to say he should draft him, only that he has to be blown away by Smith to make it a reasonable decision.

– LBs have proven to be the most difficult to peg.  The position has the lowest rate for starters out of the first round (58%), but the highest rates for All-Pros and Pro Bowls.  That tells me LBs are perhaps the hardest players to evaluate coming into the league.

We’ll take a look at the other rounds soon, and eventually put it all together for a complete draft guide, but for now it appears as though there is clear split regarding the odds of success for draft picks (in the first round):

– O-Line, TE, DBs (Safer)

– DEs, DTs, LBs, QBs, RBs (Riskier)


Best drafting teams from 1999-2011…

Continuing our draft research, I attempted to create a method for determining which teams were the best and worst at drafting over Andy Reid’s tenure, with 2012 excluded since it’s too early to judge most of this year’s rookies.

Before the results, I have to explain how I got there (feel free to skip if you don’t care about the methodology):

First, in order to evaluate players, I used the Career Approximate Value statistic from Pro-Football-Reference.com.  This is FAR from a perfect measure, but I don’t know of any better way to compare player production for different positions.

Second, Career AV is a cumulative measure.  So players with longer careers will tend to have higher Career AVs.  To compensate for this, I divided each players CAV by the number of seasons they were in the NFL.  It’s important to note that this skews the data in favor of players who were productive over long periods of time versus those (i.e. Shawn Andrews) who were spectacular for a short time and non-existent the rest.

I then totaled those measures for each team, giving us a rough idea of the amount of production derived from each team’s drafts.

However, we aren’t done yet.  In order to adjust for the differing value of each draft pick, I calculated the average point value of each round (according to basic NFL draft chart), then used those measures to calculate the total “Draft Points” used by each team.  That way, teams that use a lot of 1st round picks to find production will not be equal to teams that found the same production with lesser picks.

Finally, I divided the Total Adjusted CAV for each team by the total Draft Points used to obtain that production.

The results?  Some expected, some shocking.  Here are the ten teams (in order) that ranked best from 1999-2011 in identifying and selecting productive players in the draft:

Tennessee, Chicago, Indy, Dallas, Green Bay, Atlanta, Carolina, San Diego, Philadelphia (9th), Houston.

Here are the ten worst (ordered worst to best):

Detroit, St. Louis, Oakland, San Fran, Washington, Minnesota, Kansas City, Cincinnati, Buffalo, Tampa Bay.

Note: This is an attempt to rank teams based on the efficiency with which each used their draft picks.

For the skeptics: A first glance at the best and worst drafting teams would lead one to believe there is a flaw in the methodology.  The Titans?  Really?  On a hunch, I graphed each team’s Adjusted AV/Draft Point (the measure I walked through above) against each team’s wins over the subject time period (Texans not included since they were not in the league for the whole time period).  Here is the chart:

Screen Shot 2013-01-11 at 4.06.26 PM

Interesting, right?  We see a clear positive correlation between the drafting measure we calculated and team performance (wins).  Not only that, but it’s a pretty strong relationship (coefficient of .55).

This doesn’t prove the effectiveness of my methodology, but it is certainly what we would expect to see given an accurate measure of drafting skill.  Teams that draft better should, on average, perform better on the field.

Here is a graphic showing each team’s Adjusted AV per Draft Point, with the Eagles highlighted in red.

Screen Shot 2013-01-11 at 4.15.42 PM

So what did we learn?  The Eagles actually have been pretty good at using draft picks since 1999 (and Detroit has been absolutely terrible).  Keep in mind that this just measures a team’s ability to find productive players with each pick. It doesn’t account for whether picks achieved success while with the team that drafted them.  For instance, the Eagles get credit for Derrick Burgess, even though most of his success came with another team.

Also remember that this is per pick, not total production (i.e. New England had the 4th highest total Adjusted AV, but also used the second most picks to get there).

I’ll be digging further into the data to see what else we can get out of it, but I believe we can drop the whole “Andy Reid sucked at drafting” meme.  It’s also a good reminder that as much as some fans hated Reid, over his tenure here, most other franchises were much worse.


Importance of First Round (Chart as promised)

Below is the chart I promised yesterday.  The data is from Pro-football-reference.com and it does not include the supplemental draft.  The data is total occurrences, not individual players.  So 108 All-Pro mentions includes multiples from players who made it more than once; it does NOT mean 108 different players made the All-Pro 1st team.

Screen Shot 2013-01-10 at 2.25.04 PM

I doubt anyone is overly surprised, but it certainly illustrates the importance of 1st round picks.  Also keep in mind that there were less 1st round picks made overall than any other round other than the 2nd.  So on a percentage basis, the data would be even more skewed towards the first round.

Obviously there is some skew to consider, since a players get longer/more opportunities if they are drafted early.  However, given how many variables go into talent evaluation and performance projection, it’s pretty clear to see that NFL scouts do a very good job of identifying the most talented players.

It is extremely rare for an elite player to drop beyond the second round.  We do not yet know if there is persistent “market-beating” talent among GMs or whether an “index-tracking” approach would be better off.

I use those terms because I believe the stock market provides a good model of how to view drafting in professional sports.  Just as it’s extremely difficult to consistently beat the market trading individual stocks, I expect it is also very difficult to draft consistently better than the “consensus” best available.  Unfortunately, without seeing every team’s draft board, we don’t know the true “consensus” rankings.  Therefore, we’ll try a few different ways of measuring draft skill, starting tomorrow.

Food for thought:

Over the subject time period, here are the five teams with the most and least draft picks (Houston not included):

Most-

Tennessee (122), Green Bay (119), New England (118), Philadelphia (116), San Fran (114).

Least-

New Orleans (83), NY Jets (84), Washington (87), Miami (96), Detroit (96)


New Orleans (


Quick draft history note

Going through draft data since 1999 (Reid’s first draft), figured I’d throw out a quick note:

– From 1999-2011, the average number of draft picks per team was just over 104.   (Note: the Texans were not included in that count since they haven’t existed that long.)

– The Eagles made 116 selections over that timeframe.  The Patriots, famous for accumulating picks, made just two more than the Eagles with 118.

– The Titans made 122 picks, leading the league.

– The Saints and Jets made the fewest picks, with 83 and 84.

In total, the players drafted from 1999-2011 were named to the All-Pro first team 171 times. 108 of those were by players drafted in the first round, or an astounding 63%.   I’ll do a graph on this soon, but needless to say, if you want an elite player, you can’t afford to miss with 1st round picks.

For instance, just 21 All-Pro first team mentions came from the second round, or just over 12%.

Note: All data came from pro-football-reference.com.

Draft Order

Putting the Rewind together, but I wanted to post a note about the draft order.  The Eagles are currently tied with the Raiders and Lions with a record of 4-11.  The draft order is decided by the final standings (with the worst team getting the best pick).  If teams have the same record, my understanding is that strength-of-schedule is the tiebreaker.   Keep in mind that having a tougher schedule ranks you higher in the final standings and therefore give you a worse draft pick.

Currently, the opponents records for the Raiders, Eagles, and Lions are as follows:

Raiders – 112-128

Eagles – 122 – 118

Lions – 136 – 102 – 2

As you can see, the gaps are wide enough that this Sunday’s games are unlikely to change the order.  Therefore, if all three teams lose, the Raiders would secure the #3 pick, the Eagles #4, and the Lions #5.

If the Raiders win (unlikely, but San Diego isn’t exactly invincible), an Eagles loss would give them the #3 pick.

So while I hate to say it, the goal for this Sunday is simple….DO NOT WIN.  The #3-#4 pick pretty much guarantees the Eagles one of the top OTs (there are two, depends on who they like better) or possibly the DT that nobody besides me is talking about (for the Eagles anyway.)

A win, however, makes things more complicated.  I haven’t calculated the SOS for every team, but there are four 5 win teams.  So winning Sunday could potentially move the Eagles draft slot from #4 to anywhere between #4-#9.  I doubt the Eagles would have a stronger SOS than all of those teams, but the overall message is pretty clear:  Losing on Sunday is FAR better for the team’s future than winning is.

As painful as it may be, anyone really hoping for a brighter future for the team should want to lose to the Giants…(on a brighter note, a Giant’s win probably doesn’t get them into the playoffs, so you don’t have to feel too bad about it.)

Andy Reid Drafts:

We’ll be taking a much more detailed look at the Draft after the season ends, but I thought I’d quickly provide a good illustration as to why the team’s performance has tailed off the last few years.  Below are all of the Eagles’ draft picks made under Andy Reid.  I did not include this past year’s since not enough time has passed to really judge any of the picks (though Cox looks like a hit).

I’ve color coded them so we can easily see where and when the good picks were made.

There’s a lot of subjectivity to “grading” players, but the general rule of thumb I used was:

Good starters for the Eagles are highlighted Green.  Complete disasters are Red.  Everyone else is Black (either mediocre or jury is still out).  You’ll notice that nobody after the second round is Red.  Beyond there it becomes very difficult to find quality starters, so the team really isn’t docked much for missing there (though not finding quality backups is another issue altogether).  Also, if a player went on to be successful, but did so for another team, they don’t count as a good pick (think Derrick Burgess or Brandon Gibson).

Screen Shot 2012-12-20 at 2.59.45 PM

Screen Shot 2012-12-20 at 3.00.34 PM

Notice anything?  Now I’m sure some will argue about how I’ve classified a few of the names on the list (Andrews and Bunkley could certainly be Red) but in general I think everyone can see the same overarching trends.   The most shocking realization is the complete lack of strong defensive players picked since 2006.    Maybe Brandon Graham’s emergence is real, in which case he might switch to Green, but there really isn’t anyone else in all that time that I’d happily call a starter.  (And don’t say Stewart Bradley, he started for just 2 seasons, only one of which was a good year)

It’s also easy to see how this happened if we take a glance at who is highlighted in Red (i.e. complete misses).  From 2007-2011, the Eagles used 2nd round picks on the following defensive legends:  Victor Abiamiri, Trevor Laws, Nate Allen, Jaiquawn Jarrett.

That, folks, is a very big reason why this is Andy Reid’s last year as coach.  It looks like he broke the trend with Cox, but too little too late.

Final note:  I do not mean to suggest that Andy Reid is bad at drafting.  My guess is that over his career he has been about average and most people don’t realize just how hard it is to accurately project talent.  The offseason draft analysis will take a look at league-wide success rates and see where Reid actually ranks and if there really are good drafters or if it’s just luck (hint: it’s probably a lot of luck).

Also, I apologize if there are any typos or misspelled names.  Lots of transcription, hopefully its all correct.