Dispelling the Chance Warmack Nonsense

I’ve been asked by a few people about my thoughts on Chance Warmack, so today I’ll attempt to provide a definitive explanation for why taking him with the 4th pick (or any high pick for that matter) is almost definitely a terrible idea (I’ll explain the one scenario that makes sense as well).

Although I have been clear about the Eagles not taking him, I haven’t fully explained, and judging by this article (Don Banks mock draft), there needs to be a reasoned analysis.

The first big point to consider is that Warmack is NOT risk-free.  No draft pick is, regardless of what scouts believe.  While some picks/positions are clearly LESS RISKY than others, every selection carries a chance (I really wish that wasn’t his name) that the player won’t pan out.

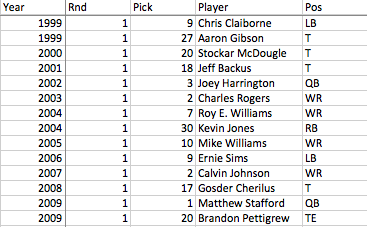
Let me provide a few quick examples.  Here are some pre-draft scouting reports, followed by the corresponding player:

One of the more versatile offensive tackles to enter the draft in a long while, [He] is a terrific prospect that will offer immediate returns as well as long-term potential. Should quickly come in and start as a left tackle for a franchise, yet could also grow into a dominant strong-side blocker. Will only get better as he physically matures and improves his skills as a run blocker. SI.com

The Player?  Robert Gallery, selected #2 overall.

“I can’t remember being in such awe of a quarterback in my decade of attending combines and pro days. [His] passing session was the most impressive of all the pro days I’ve been to. His footwork for such a big quarterback was surprising. He was nimble in his dropbacks, rolling out and throwing on the run. The ball just explodes out of his hands.” – Todd McShay

The subject?  The immortal JaMarcus Russell.

Athleticism at the…position is unmatched by any player drafted in the last decade.  Incredible vision…Surprising power and is not afraid to run people over.  Absolutely chiseled physique…good character guy…Threat to score every time he touches the ball, and he should do that a lot in the NFL…Rarely does an athlete of this caliber enter the NFL. -draftclass.com

Player?  Reggie Bush

Obviously there are a lot of players that we can look back and poke holes in, but the fact is each of the above players was considered very low risk at the time they were drafted.  I’m not saying Warmack will be a bust, odds are he’s gonna be very good, but let’s just remember that scouting reports don’t always pan out.

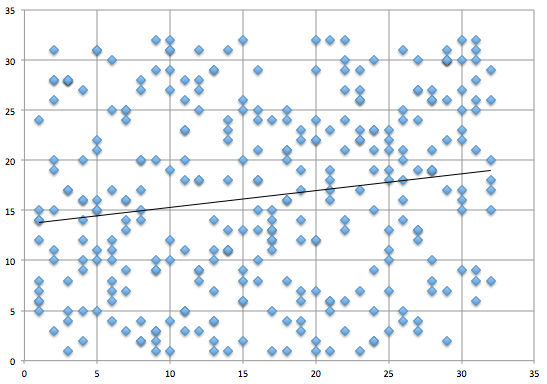
The second and more significant reason for not taking Warmack (or any guard) is Opportunity Cost. When you use a draft pick, you are not just selecting a player, you are also deciding NOT to use that pick on a different prospect(s).  You can’t evaluate each choice in a vacuum, you must look at what else is available, otherwise the whole idea of “value” gets thrown out the window.

Remember our rule of thumb regarding the draft:  Elite players come from the first round, and mostly from the top half of the first round, REGARDLESS OF POSITION (with a few exceptions like K, P, FB, etc…)

Before we fully consider that, let’s also bring our draft strategy card into the picture:Screen Shot 2013-02-28 at 2.12.35 PM

Sorry for the small font, but there’s a lot of info in there.  To refresh, the chart shows the odds of success by position and round for prospects taken in the draft from 1999-2011.

By combining our elite prospect guideline with this chart, it’s pretty easy to see why taking a guard is a bad idea in the top of the first round.  If we gauge the relative impact by position, Guards come out near the bottom (which is why so few are drafted highly).  The fact is, a dominant DE or T will have a greater effect on the game than a dominant G.  Also, there are very few opportunities to add elite players at high-value positions, with the Draft being, by far, the best route for all teams (as a result of the contract value).

Therefore, choosing Warmack means you are forgoing the RARE opportunity to add an elite player at a more valuable position.  If it was easy to find top OTs or DEs or DBs, then taking a G wouldn’t be such a big deal.  Unfortunately, if you don’t use the draft for the high value positions, it becomes VERY difficult and almost ALWAYS expensive to fill them through other avenues (FA, Trades).

I should note at this point that this does depend on the draft board.   I am a firm advocate of BPA strategy.  However, there are enough positions of higher value than G that I’m extremely confident there are better options than Warmack at #4.  Remember that we shouldn’t be ranking players individually, but rather slotting them by tiers to account for the large margin of error in player evaluations.  So looking at the tier that includes  Warmack (varies according to team board), there is a very high likelihood that, at #4, there is another player within that tier that plays a more impactful position.

Lastly, if we look at the chart, we can see that Guards are among the easiest to find late in the draft (highest probability).  In the 6th round, for example, 21% of guards selected from 1999-2011 became starters (started for at least 5 seasons or half of their time in the league if they were drafted less than 5 seasons ago).  Conversely, just 5% of DEs and 4% of DBs taken in the 6th became starters.  While players selected that late are very unlikely to be “elite” players, you’d clearly take an Elite DE/average G combo over the reverse.

To sum up before I get to the one exception scenario, the goal in the 1st round of the draft for EVERY team needs to be MAXIMIZING IMPACT.  Each year 15 teams (top 15 picks) get a reasonable shot at adding an “elite” player.  Outside of that draft choice, the opportunities to add elite players are few and far between.  Most often, the only other option is for teams to overpay in free agency, especially for premier positions.  Therefore, teams cannot squander their best opportunities to add elite players on lower-impact positions, regardless of how strong the prospect is.

I mentioned at the top that there was one (extremely unlikely) scenario where it made sense to draft Warmack:

BOTH:

– Warmack would have to be in his own tier, and CLEARLY a far better prospect than anyone else on the board.  From what I’ve seen, that is not the case.

– There would have to be NO interest in trading for the Eagles pick, eliminating that as an option.  Even a trade involving relatively less compensation than normal would be enough to move, so I really do mean that a trade would have to be nearly impossible.  Again, the odds of there being ZERO interest in anything approaching a reasonable offer for the #4 pick are very low.

OR – the subject Guard (not Warmack) would have to be so amazing as to completely redefine the Guard position.  I’m not even sure what that would look like.  Safe to say it’s not happening anytime soon.

So for the time being, ignore Don Banks and anyone else suggesting the Eagles should/will take Warmack.

Alex Smith Thoughts and ramifications for the Eagles

I already liked the Chiefs to be a drastically better team next year, and now I like them even more.  The reported trade has KC giving up this years 2nd round pick and a conditional 2014 pick.  No word on the conditions, but it’s likely going to be as high as another 2nd round pick.

Why I like the trade:

– Andy Reid is very good at identifying QBs he can win with.  That’s not the same as identifying good QBs, but from Reid’s perspective, that really doesn’t matter.  Smith is a perfect fit for the offense Reid claims to run (west-coast).  I say “claims” because there were times with the Eagles when he clearly strayed from the short-passes concept, relying on deep throws and quick strikes.

– Kansas City already had a top 5 rushing offense.  Now they add an accurate, low-risk QB, and the #1 overall pick (Joeckel has to be odds on favorite now).

– Alex Smith went 19-5-1 as a starter over the last two seasons, and this past year completed 70% of his passes.

I could go on for a thousand words, but I’ll just go on record now as having the Chiefs as my pick for a surprise team next year.  With that roster (better than record suggests) and Reid/Smith, no reason the team can’t contend for the playoffs just one year after a 2-win season.

How does it effect the Eagles?  

– Nick Foles’ value obviously drops.  KC was, by far, the most likely destination for Foles.  That is the clear negative for the Eagles.  Additionally, KC will almost certainly take Joeckel (or whoever the top OT is at draft-time), meaning the Eagles will miss out.  However, it’s doubtful the top OT in the draft was going to fall to #4 regardless, so I don’t feel so bad about that.

Also, I’ve been pretty clear that I think Foles has a legitimate chance to be a good starting QB, so keeping him isn’t exactly the worst thing IMO.

– One less team looking for a QB in the draft.  As I explained in the Vick-Insurance post, it would make a lot of sense if the Eagles had their eye on a particular QB in this year’s class.  Nassib would seem to be a good bet, but at this point we have no idea who the team really likes.  The Smith trade makes it more likely that the subject QB will be available at the Eagles pick in round 2.

– Several outlets are now reporting that San Fran is an obvious candidate to move up in the draft.  As I’ve demonstrated before, elite players come almost entirely from the 1st round of the draft, and within the first round, they are predominantly found in the top 15.  The toughest aspect of being perennial contender (like San Fran hopes to be) is the inability to continue adding elite players in the draft (because to don’t get top 15 picks).  With San Fran’s ammo, they can rectify that this year.

I mention that because the Eagles, at #4, would seem to be an obvious trade partner.  At #4, the 49ers could get a top DT (Floyd or Star, depending on the heart condition).  If the Eagles don’t see any prospects that absolutely love at #4, the team should absolutely trade down, and the top pick in the 2nd round would be a pretty attractive trade chip.  In fact, this would allow them to take a QB prospect at the right spot in the draft (value-wise), while allowing them to use the other 2nd round pick on the best available defensive player.

Pure speculation at this point, but the Chiefs, Jaguars, and Raiders all seem unlikely to trade down, given their respective needs.  That would leave the Eagles with the top “gettable” pick for any team looking to move up for a top prospect.

Judging by the current prospect evaluations (and what we learned from our previous draft analyses), that trade outlook might be the best possible scenario for the Eagles.

Turns out Andy Reid may not be quite finished helping the Eagles out…

Round 2: Luck vs. Skill in the NFL Draft

Round 1 looked at historical draft performance and persistence based purely on total production as defined by CarAv.  Today we’ll make an adjustment to the model and rerun the analysis to see if anything changes.

For reference, Round 1 found absolutely no correlation in team performance from one year to the next.

The adjustment for round 2 is accounting for draft position. Using the default NFL Draft Chart, I assigned a draft points value to every player selected from 1999-2009.  I then summed up the total draft points used by each team each year, and divided that number by the total CarAv to arrive at a Points per CarAv value, which I then used to rank teams each year.

This should sound very familiar, as it is similar to the method I used in our first draft performance ranking.  However, while that analysis looked at best performance over the whole length of time, this is only concerned with performance each individual year.  As such, we don’t have to adjust for the cumulative nature of CarAv, so the rankings are a bit different.

Before we start parsing the results, here is the new ranking:Screen Shot 2013-02-26 at 12.48.19 PM

This one definitely passes the eye test.  At the top of the board are Indy, Baltimore, Green Bay, Pittsburgh, and the Giants.  Notice anything in common?

Meanwhile, at the bottom of the board are Detroit, Oakland, Cleveland, and Arizona.

So before digging in, it appears to be a reasonable ranking according to what we know of each team’s performance.

The Caveat – Using this system accounts for teams that perennially pick at the end of the draft (or the beginning), that way a team like the Patriots doesn’t get penalized for not finding similar quality players as a team like Cleveland, which, on average, picks much higher in the draft.  However, using the NFL Draft Value Chart does have a drawback.  The  chart is HEAVILY skewed towards the top of the first round.  For instance, the #1 pick is worth 3,000 points while the last pick in the draft is worth just 2.  The upshot is that using it to adjust for team draft position skews the results in favor of teams who do not have a lot of Draft Points (i.e. good teams that don’t pick high in the draft or teams that don’t have 1st round picks).  This is an area that I will try to adjust for in a future analysis.

Luck vs. Skill – Remember that if the draft is mostly skill, there should be positive correlation between team performance one year and the next.  How much correlation? That’s up for serious debate.  Regardless, here is the chart followed by the correlation value:Screen Shot 2013-02-26 at 1.02.14 PM

Doesn’t look like much, so I added a trendline to make it clearer.  The value is .167.  Not huge, but significant, and certainly a different story from the last look, which showed no connection.

If we take a step back, this comes out where I imagined the luck vs. skill argument to be when I started the original analysis.  I believe that there is obviously skill involved in the draft, but that luck is far more determinant of team success in this area of the NFL.  In general, my theory is that GM skill is illustrated by moving around the draft to maximize value/odds, and not necessarily in selecting players.  A lot more to do to support that, but I think this analysis is a step in the right direction.

Other notes from the analysis:

– It should come as no surprise that, according to this analysis, the Eagles 2002 draft remains its best.  Overall, the team’s average ranking over the subject time period was 15th.

– The Eagles were one of the most schizophrenic teams when it comes to draft performance, with a more volatile ranking than all but 3 teams (Jets, Miami, and Denver). The Broncos were least consistent.

– By this measure, the Eagles worst draft during the Andy Reid Era was 2003, when the team spent 26.71 draft points per CarAv.  For comparison, in 2002 (best draft), the team spent just 6.15 draft points per CarAv.  For those who don’t remember, 2003 was the Jerome McDougle, L.J. Smith draft.

– Over the subject timeframe, the Eagles have spent 3.74 draft points LESS than the league average per CarAV, which ranks 9th best in the league. (Chart below)

– The Colts spent 8.70 LESS draft points per CarAV than league average, while the Lions spent 13.05 points MORE than league average…

– The Detroit Lions have been shockingly inept when it comes to the draft.  The teams average ranking is 26th, but for a clearer illustration, here are the Lions 1st round picks from 1999-2009:

Screen Shot 2013-02-26 at 1.18.30 PM


Remember the post on how important it is to hit in the first round?  Needless to say, the Lions blew it…repeatedly.  To be fair, the team’s most recent #1s look OK (Suh, Fairley)…if you forget about Jahvid Best.

– The Patriots have fallen off dramatically.  From 1999-2003 the team’s average ranking was 10.6.  From 2004-2009 its average ranking jumped to 19.

– While the above analysis looked at average ranking, here is a chart showing performance over the whole time period, as defined by average draft points per CarAV minus league average. (So average team performance versus league average). Negative numbers = better performance.

Screen Shot 2013-02-26 at 1.46.47 PM

There’s a lot more I can do now that I’ve put the information together (which took much longer than I expected).  So expect to see a few more points from this analysis.

Overall, the evidence still stands heavily in luck’s corner in its fight with skill for the soul of the NFL Draft, though it’s fair to say skill has landed a couple jabs.


Scattered thoughts

– Historical Draft Performance

The last post was a pretty broad look at draft performance.  I’m currently making a few adjustments to the analysis that will hopefully provide a more accurate ranking system (though the existing version passes the eye test).  If we get an accurate system, it’s a small step to mine it for performance persistence (skill).  Adjusting for draft position is the big addition, but I’m also looking at relative magnitude (team share of all production available in draft).  If you have any other ideas for making a more accurate ranking system let me know in the comments and I’ll see if I can work it in.

– Sean Smith Interest

This is exactly the type of fake news you should avoid.  The Eagles are interested in the top CB available at the right price?  Shocking.  Saying you’re interested in a top FA but don’t want to get in a bidding war is ridiculous.  That’s how free agency works (for the top players).  However, the Eagles do need to add a CB, preferably one that can start, and adding a mid-level guy in FA would make me feel a lot better about the roster for next year.  If they really do like Smith, they’ve got the cap space to make the move and win a bidding war.

– Nnamdi

Anyone who was against tagging DRC should be completely aghast at the potential for bringing Nnamdi back with a restructured deal.  From what I saw, most people don’t like DRC because of his inconsistent effort.  I challenge you to watch Nnamdi’s tape from this year and tell me you think he was playing hard.  All that talk about players giving up was heavily pointed at Nnamdi, so bringing him back is certainly a knock against the “change the culture” plan.  Almost every player is attractive at the right price, including Nnamdi, but I’d rather tag DRC and pay him $10 mil for one year than bring back Nnamdi at half the price (he’s guaranteed $4 mil, so any renegotiation has to be higher or he wouldn’t accept).  If they do bring him back, he’s going to need safety help, since it was abundantly clear last year that he doesn’t have the speed to stay with fast WRs.

– Nightmares of the 2009 draft

The general draft discussion seems to have settled on the “deep class but no elites” theme.  Allow me to translate: “there are elite players in this class, but we (scouts) have no idea who they are”.  This is definitely bad news for the Eagles, as it diminishes the value of their pick, but don’t believe any story that says there aren’t elite players in this year’s draft. The nightmare scenario for teams at the top is a repeat of 2009.  Here is the top 15 from that year, with pro bowlers highlighted yellow:

Screen Shot 2013-02-25 at 2.17.42 PM

There are a few nice players in there, but the top 5 is a relative wasteland.  However, taken later in the first round were Clay Matthews and Percy Harvin.  And Shady was available in the second round.  While I doubt this year will be as weak as 2009, it is definitely a cautionary comparison as we get closer to the draft.

Rest assured, there will be elite players available at #4.  Whether or not the Eagles (or any other team) can identify them is another story.

 – Geno Smith

Not a fit for the Eagles, and I’m definitely not a scout, but this guy ran a 4.59 and, more importantly, completed 67% of his college passes.  The last time a QB was not selected in the top 5 was 2000, and that may have been because one year earlier 5 QBs were taken in the top 15.  If you’re looking for a guy that might sneak into the top of the board (and all Eagles fans should be), this is your best bet.


Luck vs. Skill in the NFL Draft

Today I’m going to take a shot at divining the relative importance of luck versus skill in the NFL draft.  This is a complicated subject, and as such I’ll probably try a few different methods over the next few weeks.

Before I get started, I’d like to note that this is a different analysis than the previous draft performance evaluation I did.  Whereas that attempted to grade teams according to how efficiently they used draft resources, this breakdown is purely about maximizing production.

Ranking the teams:

The first step I took was to go back through each draft and rank team performance each year.  I used the Pro-football-reference.com CarAV stat to gauge individual player production, then added each to get a measure of every team’s draft class by year.  I then ranked each team according to that production for each year and used those rankings to arrive at an average draft performance ranking.  This table should make things a bit clearer:

Screen Shot 2013-02-22 at 2.56.22 PM

I know it’s tough to see, but those with good eyesight will find annual draft rankings for each team from 1999-2009.  The one big note here is that the CarAv numbers do not include this year’s statistics (I haven’t updated my database yet).  So players who broke-out this year will not be fully accounted for.  Also, this does not account for different numbers of draft picks, so teams that trade picks for players will be undercounted here.  This is ONLY a measure of total production.

As you can hopefully see, the Eagles performed quite well by this measure (as they did in our other draft analysis).  Here the team is ranked 8th with an average ranking of 14th.  The team’s best draft came in 2002, when the Eagles ranked 1st overall (the Brown, Sheppard, Lewis, Westbrook draft).

Other strong years for the Eagles were 2005, when they ranked 3rd overall (Patterson, Herremans, Cole) and 2009 when the team ranked 5th (Shady, Maclin).

Low points for the Eagles were 2003 and 2004 (ranked 28th and 30th).

Also, notice Super Bowl winners Green Bay, Indy, Baltimore, NYG, and Pittsburgh all placed in the top ten.

FYI, if you are examining the chart, you shouldn’t get too hung up on the 2009 rankings (or even 2008), as those are most subject to change once I add this year’s data.

Luck Vs. Skill:

Now that we have annual rankings, we can look to see if performing well one year gives any indication of performing well the following year.  If the draft is mostly skill, then those front offices that are “good” at drafting should be consistently ranked towards the top, with “bad” drafters consistently at the bottom.  Theoretically we’d see less consistency among the “bad” drafters since presumably being bad would lead either a change in strategy or a change in decision-makers.

The are some obvious caveats before I get to the numbers.  I did not account for changes in front office personnel.  The CarAv measure is far from perfect, as we’ve discussed before, so the rankings are bit subjective.  Additionally, not every team is trying to maximize production.  Some use draft picks to fill roster holes, so judging teams by player production doesn’t give them credit if they have other goals in mind (whether they should have any goal besides maximizing production is another story).

Below is the chart, but let me make something abundantly clear before I show it to you.  I AM NOT SUGGESTING THE DRAFT IS COMPLETELY LUCK.  As I just mentioned, there are a lot of caveats to this type of breakdown.  Also, as I said at the top, there are a number of different ways to look at the subject, so we can’t jump to conclusions from just one.

Still…

Screen Shot 2013-02-22 at 3.27.07 PM

Pretty much the definition of no relationship.

I also looked at multi-year averages in an attempt to get rid of some of the noise caused by a random bad/good year.  Below is the same chart, using average rankings from 99-01, 02-04,05-07,08-09 instead of individual years.

Screen Shot 2013-02-22 at 3.51.39 PM

Yet again, nothing there.

Again, this doesn’t mean there is NO skill in drafting, it’s just a starting point that suggests there MIGHT BE a lot of luck (and certainly a lot more than GMs would like people to think).  I’m going to try to account for some of the holes and weaknesses in this analysis, and I’ll repost when I finish.  There is a lot of potential noise here.

One more chart:Screen Shot 2013-02-22 at 4.19.17 PM

This is the frequency chart of our rankings.  Sure looks a bit Normal doesn’t it? (Normal=random).  The standard deviation is 3.37, meaning if it’s normally distributed we would expect about 68% of the values to be between 13-19 (inclusive).  In our table, 22 out of 32 are within that range….or 68.75%.

Additionally, we’d expect 95% of the values to fall within 2 standard deviations (outside the 10-22 range in our table).  We have 30/32…or 93.75%.

What this means (I could be wrong, I’m not a statistician) is that if luck was the sole determining factor for the draft performance rankings, you’d get a distribution that looks A LOT like the one we see above.

Lot’s more to do on this subject, but for now its Luck 1 – Skill 0.

Persistence of sacks

Yesterday I mentioned that sack differential and turnover differential have a similar correlation to winning.  However, I also said that despite the relatively equal importance of both, teams should focus more on the sack numbers, as that measure is likely much less random (luck-based).  Today I wanted to illustrate that:

First we’ll look at the persistence of both sack differential and turnovers.  We’ll run the same correlation analysis as we have previously done, this time looking at whether one year’s data point is related to the corresponding data point the following year.  If the value is high (absolute value), then the measure is less random, whereas if there is no correlation then it is largely determined by chance (luck).

Here is the chart for sack differential, remember the data set comprises the last 10 seasons for all 32 teams. Note that in this analysis I have not used 2012/2013 pairs because, obviously, that data doesn’t yet exist.  The Y-axis is sack differential one year, the X-axis is sack differential the following year.

Screen Shot 2013-02-20 at 10.07.43 AM

I’ve included the trend line because without it it’s tough to see the relationship.  The correlation value is .29.  Not huge, but significant.  However, by itself it doesn’t tell us too much.  We’ll look at turnover differential persistence now, then we can compare the two.

Screen Shot 2013-02-20 at 10.12.59 AM

The value here is .11.  So there is some persistence here, but not nearly as much as we saw in the sack differential.  This tells us that although both turnovers and sacks are very important when it comes to winning, sacks are much less luck-based, meaning there is a lot more teams can do to effect the measure.  Given the choice, teams should look to improve line-play over trying to force/prevent turnovers. (I realize they’re not mutually exclusive concepts, we’re operating in a vacuum here).

A common theme in this blog is how important the efficient allocation of limited resources is when it comes to putting together a football team.  It’s vital that teams understand what is luck and what isn’t, so they know where to focus their efforts in order to maximize the impact of those efforts.

I’m assuming little of this is very surprising to readers here.  We can, however, take the analysis one step further.  Sack differential (and turnover differential) includes both offensive and defensive numbers.  What happens if we break them out?

I looked at both sacks and sacks allowed, to see if there was a noticeable difference in persistence.  First the charts, then the numbers, then interpretation.

Screen Shot 2013-02-20 at 10.25.11 AM

Screen Shot 2013-02-20 at 10.26.55 AM

Here are the values:

Sacks: .23

Sacks Allowed: .38

I don’t know about you, but I’m a bit surprised at how large the difference is.  There are a TON of variables to consider here.  Both sacks and sacks allowed can be greatly effected by the QB, scheme, line-play, schedule, etc…  Regardless, the above analysis shows that teams appear to have much greater control over how many sacks they allow as compared to how many sacks they create.  This makes some sense, in that the offense has control of every potential sack situation (QBs have a lot more control than defensive players by virtue of having the ball and being able to throw it away.)

In yesterday’s post, I talked about looking at LOS play as a continuum, rather than viewing the OL and DL as discrete units.  If we continue with that train of thought, and apply the above analysis, it certainly appears as though teams should pay more attention to the OL than the DL.  The goal of preventing sacks on offense is much easier to achieve than the goal of creating them on defense.

Therefore, all other things being equal, I’d much rather have a great OL than a great DL.  This has obvious implications for the Eagles.  There is a general consensus that the team will be looking at either OT or DT with the #4 pick in the draft.  IMO, the analysis here would support leaning towards the OT.  Note that we’d still have to evaluate it in the context of the Default Draft Strategy card I put together a few weeks back (which we’ll do once all the scouting shakes out).

For general reference, not everything I show will be counterintuitive or incredibly surprising.  I believe it’s important, though, to illustrate concepts that we take for granted or that have a clear logic to them, if for no other reason then to confirm their validity and hopefully get a better sense for their magnitude and/or context.

I’m going to spend most of today and tomorrow in a car, so I probably wont be able to get anything up tomorrow (or respond to comments).  Be back on Friday though.  Please do comment, as I think that’s extremely important for both developing ideas and challenging my assertions.  Not everything I do is right (shocking), but if nobody points it out or argues, I probably won’t realize it.

DRC decision, other thoughts, and a look at Sack Differential

Hope everyone enjoyed the holiday weekend.  I’ve got some random thoughts to get out before they get too stale, followed by a quick look at the importance of sacks:

DRC:  I would have tagged DRC, and it would have been an easy decision.  In my mind, the only possible reason for not doing so is if DRC was actively undermining the coaches.  I know a lot of people have resorted to calling DRC a “locker room cancer” and such, but I just don’t get the sense he was that big of a problem.

Last year the entire team fell apart.  The coaches appeared to be undermining each other. Two were fired midseason and it became clear that the head coach would be let go after the season ended.  Is it really a surprise that this led to a team “quitting” on itself?  I’m not trying to excuse that type of play, but the fact is almost the entire team was guilty, and it’s reasonable to think that in a better atmosphere, DRC will return to somewhat consistent play.

He was very bad for a lot of last year, and clearly is not worth $10.7 million.  However, the Eagles DONT NEED THE CAP SPACE.  It really doesn’t matter how much you’re paying him, since it’s only a one year commitment and it doesn’t preclude the team from doing anything else.  Worst case scenario: he sucks again and is gone after next year.

As it stands, it looks like the Eagles will not bring him back.  That means the team is now looking for an entire starting DB corps.  Maybe in a better line-up Nate Allen is acceptable.  Maybe in a great line-up Kurt Coleman can be covered for.  That still leaves 3 starting spots.  I know Howie has claimed to be fully committed to BPA (best player available) in the draft, but it’s going to be extremely tempting to take someone like Dee Milner.  If that ends up being a reach, then the Eagles have blown a huge opportunity to kick-start the next phase of the franchise.

If they don’t draft Millner (or another top prospect), where is the team going to find 2 starting CBs?  I’ve mentioned before that this is not a 1 year process.  Still, I was hoping the team would use its resources to band-aid a few of the holes it couldn’t fix this offseason.  DRC fits this role perfectly (band-aid).

Draft Watching:  It’s fun to read about all of the draft prospects and compare the “big boards”, but remember, at this point most of it’s useless.  The boards are going to change, some dramatically, so don’t get too caught up in things like “Floyd has passed Star” or “no QB’s are worth 1st round picks”.  We’ll probably get a very different story closer to draft day, after all the interviews are done and teams have done a lot more film work.

I do like looking at the National Football Posts rankings, though.  They claim that their evaluations will not be affected by the combine, only by prospect interviews and character issues from here on in.  They’ve got Nassib ranked #1 overall…(he’s the guy the Eagles likely have their eyes on in the Mike Vick-as-insurance scenario).  If this ranking holds, safe to say he won’t be there for the Eagles in round 2.

When it gets closer to the draft I’ll pull together a “consensus” prospect ranking, and we can use that with our Draft Strategy Chart to look at what the Eagles should do.

Nick Foles:  He will probably be traded.  Again, ignore what the “Eagles sources” are saying.  Given the supposed weakness in this year’s QB draft class, holding on to Foles until draft day and then auctioning him off will maximize his value.  Some team will be desperate for a QB and see their top choice gone.  If things fall the right way, the Eagles can definitely get a 2nd round pick for Foles.  At the very least, he’s should garner a 3rd + a later round pick (and IMO he’s worth a lot more than that).

OG’s in the first round:  I don’t care what Mike Mayock says.  I don’t care if Chance Warmack will immediately be the best guard in football.  Choosing a Guard in the first round is a dramatic misallocation of resources.  The draft is not just about finding prospects who will play.  It’s about maximizing the VALUE of every pick.

Sacks:  This relationship will be fairly obvious, but it’s not a stat I see referenced very often (sack differential). Obviously getting sacked is bad and sacking the other QB is good, but the overall sack differential (sacks-sacks allowed) is HIGHLY correlated with winning.   The only Super Bowl champion in the last 10 years with a negative regular season sack differential were the Ravens this year (-1).  Here is the chart, with Sack Differential on the y-axis (and SB winners in yellow):

Screen Shot 2013-02-19 at 11.22.09 AM

The correlation value is .62, a very big number.  For reference, this is about the same as the value we found for TO margin (.64).  However, I’d argue that sacks differential is MUCH easier to effect than TO margin. (I’ll do a persistence post as a follow-up).  The idea here is to view OL and DL play as more of a continuum rather than discrete units.  Overall, you want to win the LOS (line of scrimmage).  That could mean EITHER allowing fewer sacks on offense or creating more on defense (I’m intentionally ignoring the run game here).  Ideally you will be good at both, but it’s the net effect that we are looking for.

So for example, rather than fixate on either the OL or DL in the draft, the Eagles should take whoever will add the most to EITHER unit.  Right now, NT is a bigger immediate need than anything on the OL, but if the team finds an OT that adds more than the available NT’s, it should draft the OT.  Given the choice between a Great OL/Bad DL combo and a decent OL/DL combo, it may in fact be better to go with the first choice, which runs counter to popular draft strategy.  Teams typically focus on improving weaknesses, when they should focus on BIGGEST IMPACT.  So choosing to take an area of strength and make it dominant (say the 49ers taking an OL) may be a better strategy than trying to go from mediocre to good at another position group.  This is of course all relative (and near impossible to accurately quantify), but it’s more support for taking the BPA rather than need.

The defensive ranking dilema

The last post raised a couple of issues (through the comments and twitter) with the Yards Allowed stat.  Clearly it’s not a perfect measure of defense.  As a result, I am pulling together some other defensive metrics and will run the same analysis, in hopes of shedding some light on the relative importance of defense.

In the meantime though, let’s look at why Yards Allowed is a flawed measure.  Hint: We have a problem we have faced before.  That is, teams that are losing by a lot will throw more often, gaining more yards and distorting the defensive ranking of the winning team.

Before we get to that though, we need to examine just how big the potential problem is.  In my previous post on Pass Play %, I hypothesized that there is some skew, but that when looking at every play run in the NFL every year, relatively few of them are done by teams focused on anything except maximizing points scored, which should minimize the effects on the overall data set.

To get a better look, I put together a new analysis, comparing points scored to the ratio of run/pass yards allowed.  The hypothesis is that teams that score a lot of points will force their opponents to pass more, resulting in a positive correlation between points scored and % of Pass yards allowed.  I expect there to be a positive result, as there’s a pretty logical case for correlation.  The real question is how strong the result is; if it’s weak than my prior statement regarding overall skew effects may still stand, if it’s strong then we have to re-evaluate (and do a lot more work).

Here is the chart.  Note the Y axis is just Pass Yards Allowed/Total Yards Allowed.

Screen Shot 2013-02-15 at 2.05.06 PM

Dammit.   The correlation value is .40, so moderate, but definitely a little higher than I expected.  Unfortunately, this means we’ve got some work to do if we want to remove the noise resulting from this issue, which will be my goal for the next couple weeks, interspersed with other topics for which I’ve found interesting data.

We’ll attack it from two angles.  First, as I mentioned at the top, we can use other defensive metrics that indicate strong defense but aren’t as susceptible to the same problem.

Also, we can try to use a better metric for overall defense.  There are some interesting stats out there on sites like Football Outsiders that we might be able to use.  I’ve got a few in mind but let me know if you have any particular favorites.  Let me caution you though, stats that look really complicated my be subject to over-fitting, which would lead to really powerful results in analyses like the one above but actually tell us very little useful information.

We can also try to create our own, though I’ll only do that if people are really interested.  The idea of a relatively simple stat that incorporates some major defensive measurables sounds intriguing though.  If you’ve seen something like this, let me know so I don’t waste time duplicating it.

Yes, QB play is MUCH more important than Defense

Over at Igglesblitz today, Tommy Lawlor mentioned that QB play and coaching are much more important than people realize, specifically citing the Packers defensive performance and record for 2010 and 2011.  Basically, the defense got A LOT worse while the record got better.

Here’s the link.

I figured I’d add some stats to the point to further illustrate it, because it’s both true and very important.  Unable to quantify coaching, we’ll focus on the QB.

Here are the charts for both Passer Rating vs. Wins and Yards Allowed vs. Wins.

Screen Shot 2013-02-13 at 4.37.00 PMScreen Shot 2013-02-13 at 4.41.59 PM

If you look at the slope of both lines (really the absolute value of each), its clear the above slope is much greater, hence a greater correlation.  Note: Tried my best to un-bias the effects of the different scales so it’d be visually clear.  Here are the correlation values:

Passer Rating:  .67

Yards Allowed: -.376

This is particularly relevant given the Eagles current situation, with QB uncertainty and a defense in need of serious upgrades (or significant improvement in current players).  In general, the play of Vick/Foles/Rookie? will be MUCH more important than the performance of the defense next year.

Another somewhat counterintuitive truth (at least regarding the magnitude of the difference in importance).  It also means the Eagles could use this draft, free agency, and scheme change to engineer a dramatic defensive improvement and still end up out of contention if the QB play isn’t good.