Scattered thoughts

– Historical Draft Performance

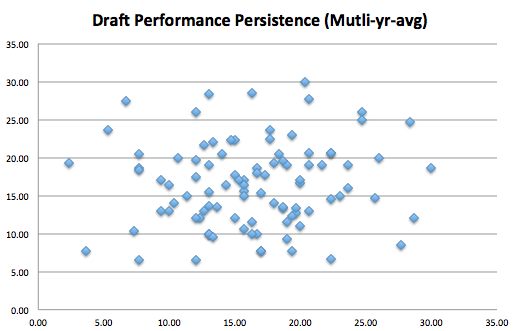
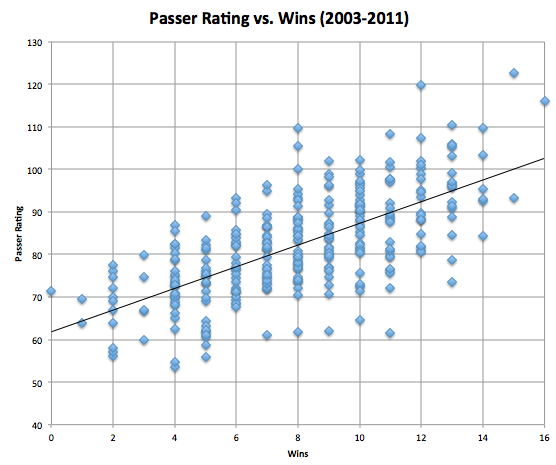
The last post was a pretty broad look at draft performance.  I’m currently making a few adjustments to the analysis that will hopefully provide a more accurate ranking system (though the existing version passes the eye test).  If we get an accurate system, it’s a small step to mine it for performance persistence (skill).  Adjusting for draft position is the big addition, but I’m also looking at relative magnitude (team share of all production available in draft).  If you have any other ideas for making a more accurate ranking system let me know in the comments and I’ll see if I can work it in.

– Sean Smith Interest

This is exactly the type of fake news you should avoid.  The Eagles are interested in the top CB available at the right price?  Shocking.  Saying you’re interested in a top FA but don’t want to get in a bidding war is ridiculous.  That’s how free agency works (for the top players).  However, the Eagles do need to add a CB, preferably one that can start, and adding a mid-level guy in FA would make me feel a lot better about the roster for next year.  If they really do like Smith, they’ve got the cap space to make the move and win a bidding war.

– Nnamdi

Anyone who was against tagging DRC should be completely aghast at the potential for bringing Nnamdi back with a restructured deal.  From what I saw, most people don’t like DRC because of his inconsistent effort.  I challenge you to watch Nnamdi’s tape from this year and tell me you think he was playing hard.  All that talk about players giving up was heavily pointed at Nnamdi, so bringing him back is certainly a knock against the “change the culture” plan.  Almost every player is attractive at the right price, including Nnamdi, but I’d rather tag DRC and pay him $10 mil for one year than bring back Nnamdi at half the price (he’s guaranteed $4 mil, so any renegotiation has to be higher or he wouldn’t accept).  If they do bring him back, he’s going to need safety help, since it was abundantly clear last year that he doesn’t have the speed to stay with fast WRs.

– Nightmares of the 2009 draft

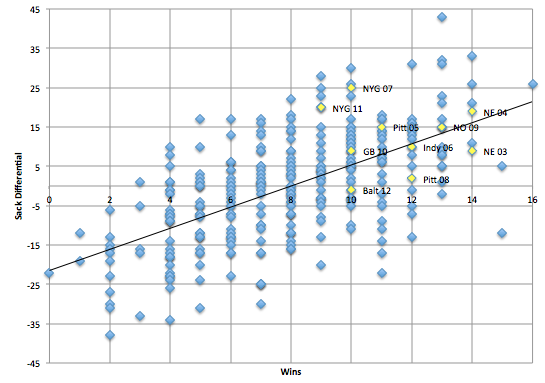
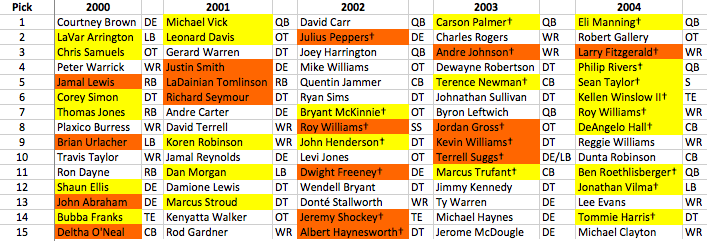
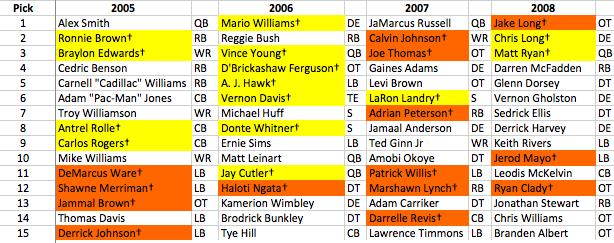
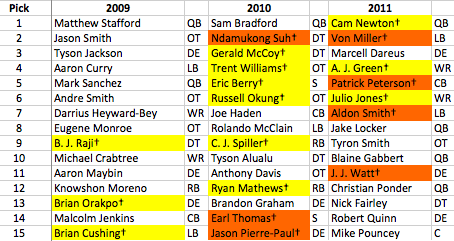
The general draft discussion seems to have settled on the “deep class but no elites” theme.  Allow me to translate: “there are elite players in this class, but we (scouts) have no idea who they are”.  This is definitely bad news for the Eagles, as it diminishes the value of their pick, but don’t believe any story that says there aren’t elite players in this year’s draft. The nightmare scenario for teams at the top is a repeat of 2009.  Here is the top 15 from that year, with pro bowlers highlighted yellow:

Screen Shot 2013-02-25 at 2.17.42 PM

There are a few nice players in there, but the top 5 is a relative wasteland.  However, taken later in the first round were Clay Matthews and Percy Harvin.  And Shady was available in the second round.  While I doubt this year will be as weak as 2009, it is definitely a cautionary comparison as we get closer to the draft.

Rest assured, there will be elite players available at #4.  Whether or not the Eagles (or any other team) can identify them is another story.

 – Geno Smith

Not a fit for the Eagles, and I’m definitely not a scout, but this guy ran a 4.59 and, more importantly, completed 67% of his college passes.  The last time a QB was not selected in the top 5 was 2000, and that may have been because one year earlier 5 QBs were taken in the top 15.  If you’re looking for a guy that might sneak into the top of the board (and all Eagles fans should be), this is your best bet.


Luck vs. Skill in the NFL Draft

Today I’m going to take a shot at divining the relative importance of luck versus skill in the NFL draft.  This is a complicated subject, and as such I’ll probably try a few different methods over the next few weeks.

Before I get started, I’d like to note that this is a different analysis than the previous draft performance evaluation I did.  Whereas that attempted to grade teams according to how efficiently they used draft resources, this breakdown is purely about maximizing production.

Ranking the teams:

The first step I took was to go back through each draft and rank team performance each year.  I used the Pro-football-reference.com CarAV stat to gauge individual player production, then added each to get a measure of every team’s draft class by year.  I then ranked each team according to that production for each year and used those rankings to arrive at an average draft performance ranking.  This table should make things a bit clearer:

Screen Shot 2013-02-22 at 2.56.22 PM

I know it’s tough to see, but those with good eyesight will find annual draft rankings for each team from 1999-2009.  The one big note here is that the CarAv numbers do not include this year’s statistics (I haven’t updated my database yet).  So players who broke-out this year will not be fully accounted for.  Also, this does not account for different numbers of draft picks, so teams that trade picks for players will be undercounted here.  This is ONLY a measure of total production.

As you can hopefully see, the Eagles performed quite well by this measure (as they did in our other draft analysis).  Here the team is ranked 8th with an average ranking of 14th.  The team’s best draft came in 2002, when the Eagles ranked 1st overall (the Brown, Sheppard, Lewis, Westbrook draft).

Other strong years for the Eagles were 2005, when they ranked 3rd overall (Patterson, Herremans, Cole) and 2009 when the team ranked 5th (Shady, Maclin).

Low points for the Eagles were 2003 and 2004 (ranked 28th and 30th).

Also, notice Super Bowl winners Green Bay, Indy, Baltimore, NYG, and Pittsburgh all placed in the top ten.

FYI, if you are examining the chart, you shouldn’t get too hung up on the 2009 rankings (or even 2008), as those are most subject to change once I add this year’s data.

Luck Vs. Skill:

Now that we have annual rankings, we can look to see if performing well one year gives any indication of performing well the following year.  If the draft is mostly skill, then those front offices that are “good” at drafting should be consistently ranked towards the top, with “bad” drafters consistently at the bottom.  Theoretically we’d see less consistency among the “bad” drafters since presumably being bad would lead either a change in strategy or a change in decision-makers.

The are some obvious caveats before I get to the numbers.  I did not account for changes in front office personnel.  The CarAv measure is far from perfect, as we’ve discussed before, so the rankings are bit subjective.  Additionally, not every team is trying to maximize production.  Some use draft picks to fill roster holes, so judging teams by player production doesn’t give them credit if they have other goals in mind (whether they should have any goal besides maximizing production is another story).

Below is the chart, but let me make something abundantly clear before I show it to you.  I AM NOT SUGGESTING THE DRAFT IS COMPLETELY LUCK.  As I just mentioned, there are a lot of caveats to this type of breakdown.  Also, as I said at the top, there are a number of different ways to look at the subject, so we can’t jump to conclusions from just one.

Still…

Screen Shot 2013-02-22 at 3.27.07 PM

Pretty much the definition of no relationship.

I also looked at multi-year averages in an attempt to get rid of some of the noise caused by a random bad/good year.  Below is the same chart, using average rankings from 99-01, 02-04,05-07,08-09 instead of individual years.

Screen Shot 2013-02-22 at 3.51.39 PM

Yet again, nothing there.

Again, this doesn’t mean there is NO skill in drafting, it’s just a starting point that suggests there MIGHT BE a lot of luck (and certainly a lot more than GMs would like people to think).  I’m going to try to account for some of the holes and weaknesses in this analysis, and I’ll repost when I finish.  There is a lot of potential noise here.

One more chart:Screen Shot 2013-02-22 at 4.19.17 PM

This is the frequency chart of our rankings.  Sure looks a bit Normal doesn’t it? (Normal=random).  The standard deviation is 3.37, meaning if it’s normally distributed we would expect about 68% of the values to be between 13-19 (inclusive).  In our table, 22 out of 32 are within that range….or 68.75%.

Additionally, we’d expect 95% of the values to fall within 2 standard deviations (outside the 10-22 range in our table).  We have 30/32…or 93.75%.

What this means (I could be wrong, I’m not a statistician) is that if luck was the sole determining factor for the draft performance rankings, you’d get a distribution that looks A LOT like the one we see above.

Lot’s more to do on this subject, but for now its Luck 1 – Skill 0.

Persistence of sacks

Yesterday I mentioned that sack differential and turnover differential have a similar correlation to winning.  However, I also said that despite the relatively equal importance of both, teams should focus more on the sack numbers, as that measure is likely much less random (luck-based).  Today I wanted to illustrate that:

First we’ll look at the persistence of both sack differential and turnovers.  We’ll run the same correlation analysis as we have previously done, this time looking at whether one year’s data point is related to the corresponding data point the following year.  If the value is high (absolute value), then the measure is less random, whereas if there is no correlation then it is largely determined by chance (luck).

Here is the chart for sack differential, remember the data set comprises the last 10 seasons for all 32 teams. Note that in this analysis I have not used 2012/2013 pairs because, obviously, that data doesn’t yet exist.  The Y-axis is sack differential one year, the X-axis is sack differential the following year.

Screen Shot 2013-02-20 at 10.07.43 AM

I’ve included the trend line because without it it’s tough to see the relationship.  The correlation value is .29.  Not huge, but significant.  However, by itself it doesn’t tell us too much.  We’ll look at turnover differential persistence now, then we can compare the two.

Screen Shot 2013-02-20 at 10.12.59 AM

The value here is .11.  So there is some persistence here, but not nearly as much as we saw in the sack differential.  This tells us that although both turnovers and sacks are very important when it comes to winning, sacks are much less luck-based, meaning there is a lot more teams can do to effect the measure.  Given the choice, teams should look to improve line-play over trying to force/prevent turnovers. (I realize they’re not mutually exclusive concepts, we’re operating in a vacuum here).

A common theme in this blog is how important the efficient allocation of limited resources is when it comes to putting together a football team.  It’s vital that teams understand what is luck and what isn’t, so they know where to focus their efforts in order to maximize the impact of those efforts.

I’m assuming little of this is very surprising to readers here.  We can, however, take the analysis one step further.  Sack differential (and turnover differential) includes both offensive and defensive numbers.  What happens if we break them out?

I looked at both sacks and sacks allowed, to see if there was a noticeable difference in persistence.  First the charts, then the numbers, then interpretation.

Screen Shot 2013-02-20 at 10.25.11 AM

Screen Shot 2013-02-20 at 10.26.55 AM

Here are the values:

Sacks: .23

Sacks Allowed: .38

I don’t know about you, but I’m a bit surprised at how large the difference is.  There are a TON of variables to consider here.  Both sacks and sacks allowed can be greatly effected by the QB, scheme, line-play, schedule, etc…  Regardless, the above analysis shows that teams appear to have much greater control over how many sacks they allow as compared to how many sacks they create.  This makes some sense, in that the offense has control of every potential sack situation (QBs have a lot more control than defensive players by virtue of having the ball and being able to throw it away.)

In yesterday’s post, I talked about looking at LOS play as a continuum, rather than viewing the OL and DL as discrete units.  If we continue with that train of thought, and apply the above analysis, it certainly appears as though teams should pay more attention to the OL than the DL.  The goal of preventing sacks on offense is much easier to achieve than the goal of creating them on defense.

Therefore, all other things being equal, I’d much rather have a great OL than a great DL.  This has obvious implications for the Eagles.  There is a general consensus that the team will be looking at either OT or DT with the #4 pick in the draft.  IMO, the analysis here would support leaning towards the OT.  Note that we’d still have to evaluate it in the context of the Default Draft Strategy card I put together a few weeks back (which we’ll do once all the scouting shakes out).

For general reference, not everything I show will be counterintuitive or incredibly surprising.  I believe it’s important, though, to illustrate concepts that we take for granted or that have a clear logic to them, if for no other reason then to confirm their validity and hopefully get a better sense for their magnitude and/or context.

I’m going to spend most of today and tomorrow in a car, so I probably wont be able to get anything up tomorrow (or respond to comments).  Be back on Friday though.  Please do comment, as I think that’s extremely important for both developing ideas and challenging my assertions.  Not everything I do is right (shocking), but if nobody points it out or argues, I probably won’t realize it.

DRC decision, other thoughts, and a look at Sack Differential

Hope everyone enjoyed the holiday weekend.  I’ve got some random thoughts to get out before they get too stale, followed by a quick look at the importance of sacks:

DRC:  I would have tagged DRC, and it would have been an easy decision.  In my mind, the only possible reason for not doing so is if DRC was actively undermining the coaches.  I know a lot of people have resorted to calling DRC a “locker room cancer” and such, but I just don’t get the sense he was that big of a problem.

Last year the entire team fell apart.  The coaches appeared to be undermining each other. Two were fired midseason and it became clear that the head coach would be let go after the season ended.  Is it really a surprise that this led to a team “quitting” on itself?  I’m not trying to excuse that type of play, but the fact is almost the entire team was guilty, and it’s reasonable to think that in a better atmosphere, DRC will return to somewhat consistent play.

He was very bad for a lot of last year, and clearly is not worth $10.7 million.  However, the Eagles DONT NEED THE CAP SPACE.  It really doesn’t matter how much you’re paying him, since it’s only a one year commitment and it doesn’t preclude the team from doing anything else.  Worst case scenario: he sucks again and is gone after next year.

As it stands, it looks like the Eagles will not bring him back.  That means the team is now looking for an entire starting DB corps.  Maybe in a better line-up Nate Allen is acceptable.  Maybe in a great line-up Kurt Coleman can be covered for.  That still leaves 3 starting spots.  I know Howie has claimed to be fully committed to BPA (best player available) in the draft, but it’s going to be extremely tempting to take someone like Dee Milner.  If that ends up being a reach, then the Eagles have blown a huge opportunity to kick-start the next phase of the franchise.

If they don’t draft Millner (or another top prospect), where is the team going to find 2 starting CBs?  I’ve mentioned before that this is not a 1 year process.  Still, I was hoping the team would use its resources to band-aid a few of the holes it couldn’t fix this offseason.  DRC fits this role perfectly (band-aid).

Draft Watching:  It’s fun to read about all of the draft prospects and compare the “big boards”, but remember, at this point most of it’s useless.  The boards are going to change, some dramatically, so don’t get too caught up in things like “Floyd has passed Star” or “no QB’s are worth 1st round picks”.  We’ll probably get a very different story closer to draft day, after all the interviews are done and teams have done a lot more film work.

I do like looking at the National Football Posts rankings, though.  They claim that their evaluations will not be affected by the combine, only by prospect interviews and character issues from here on in.  They’ve got Nassib ranked #1 overall…(he’s the guy the Eagles likely have their eyes on in the Mike Vick-as-insurance scenario).  If this ranking holds, safe to say he won’t be there for the Eagles in round 2.

When it gets closer to the draft I’ll pull together a “consensus” prospect ranking, and we can use that with our Draft Strategy Chart to look at what the Eagles should do.

Nick Foles:  He will probably be traded.  Again, ignore what the “Eagles sources” are saying.  Given the supposed weakness in this year’s QB draft class, holding on to Foles until draft day and then auctioning him off will maximize his value.  Some team will be desperate for a QB and see their top choice gone.  If things fall the right way, the Eagles can definitely get a 2nd round pick for Foles.  At the very least, he’s should garner a 3rd + a later round pick (and IMO he’s worth a lot more than that).

OG’s in the first round:  I don’t care what Mike Mayock says.  I don’t care if Chance Warmack will immediately be the best guard in football.  Choosing a Guard in the first round is a dramatic misallocation of resources.  The draft is not just about finding prospects who will play.  It’s about maximizing the VALUE of every pick.

Sacks:  This relationship will be fairly obvious, but it’s not a stat I see referenced very often (sack differential). Obviously getting sacked is bad and sacking the other QB is good, but the overall sack differential (sacks-sacks allowed) is HIGHLY correlated with winning.   The only Super Bowl champion in the last 10 years with a negative regular season sack differential were the Ravens this year (-1).  Here is the chart, with Sack Differential on the y-axis (and SB winners in yellow):

Screen Shot 2013-02-19 at 11.22.09 AM

The correlation value is .62, a very big number.  For reference, this is about the same as the value we found for TO margin (.64).  However, I’d argue that sacks differential is MUCH easier to effect than TO margin. (I’ll do a persistence post as a follow-up).  The idea here is to view OL and DL play as more of a continuum rather than discrete units.  Overall, you want to win the LOS (line of scrimmage).  That could mean EITHER allowing fewer sacks on offense or creating more on defense (I’m intentionally ignoring the run game here).  Ideally you will be good at both, but it’s the net effect that we are looking for.

So for example, rather than fixate on either the OL or DL in the draft, the Eagles should take whoever will add the most to EITHER unit.  Right now, NT is a bigger immediate need than anything on the OL, but if the team finds an OT that adds more than the available NT’s, it should draft the OT.  Given the choice between a Great OL/Bad DL combo and a decent OL/DL combo, it may in fact be better to go with the first choice, which runs counter to popular draft strategy.  Teams typically focus on improving weaknesses, when they should focus on BIGGEST IMPACT.  So choosing to take an area of strength and make it dominant (say the 49ers taking an OL) may be a better strategy than trying to go from mediocre to good at another position group.  This is of course all relative (and near impossible to accurately quantify), but it’s more support for taking the BPA rather than need.

The defensive ranking dilema

The last post raised a couple of issues (through the comments and twitter) with the Yards Allowed stat.  Clearly it’s not a perfect measure of defense.  As a result, I am pulling together some other defensive metrics and will run the same analysis, in hopes of shedding some light on the relative importance of defense.

In the meantime though, let’s look at why Yards Allowed is a flawed measure.  Hint: We have a problem we have faced before.  That is, teams that are losing by a lot will throw more often, gaining more yards and distorting the defensive ranking of the winning team.

Before we get to that though, we need to examine just how big the potential problem is.  In my previous post on Pass Play %, I hypothesized that there is some skew, but that when looking at every play run in the NFL every year, relatively few of them are done by teams focused on anything except maximizing points scored, which should minimize the effects on the overall data set.

To get a better look, I put together a new analysis, comparing points scored to the ratio of run/pass yards allowed.  The hypothesis is that teams that score a lot of points will force their opponents to pass more, resulting in a positive correlation between points scored and % of Pass yards allowed.  I expect there to be a positive result, as there’s a pretty logical case for correlation.  The real question is how strong the result is; if it’s weak than my prior statement regarding overall skew effects may still stand, if it’s strong then we have to re-evaluate (and do a lot more work).

Here is the chart.  Note the Y axis is just Pass Yards Allowed/Total Yards Allowed.

Screen Shot 2013-02-15 at 2.05.06 PM

Dammit.   The correlation value is .40, so moderate, but definitely a little higher than I expected.  Unfortunately, this means we’ve got some work to do if we want to remove the noise resulting from this issue, which will be my goal for the next couple weeks, interspersed with other topics for which I’ve found interesting data.

We’ll attack it from two angles.  First, as I mentioned at the top, we can use other defensive metrics that indicate strong defense but aren’t as susceptible to the same problem.

Also, we can try to use a better metric for overall defense.  There are some interesting stats out there on sites like Football Outsiders that we might be able to use.  I’ve got a few in mind but let me know if you have any particular favorites.  Let me caution you though, stats that look really complicated my be subject to over-fitting, which would lead to really powerful results in analyses like the one above but actually tell us very little useful information.

We can also try to create our own, though I’ll only do that if people are really interested.  The idea of a relatively simple stat that incorporates some major defensive measurables sounds intriguing though.  If you’ve seen something like this, let me know so I don’t waste time duplicating it.

Yes, QB play is MUCH more important than Defense

Over at Igglesblitz today, Tommy Lawlor mentioned that QB play and coaching are much more important than people realize, specifically citing the Packers defensive performance and record for 2010 and 2011.  Basically, the defense got A LOT worse while the record got better.

Here’s the link.

I figured I’d add some stats to the point to further illustrate it, because it’s both true and very important.  Unable to quantify coaching, we’ll focus on the QB.

Here are the charts for both Passer Rating vs. Wins and Yards Allowed vs. Wins.

Screen Shot 2013-02-13 at 4.37.00 PMScreen Shot 2013-02-13 at 4.41.59 PM

If you look at the slope of both lines (really the absolute value of each), its clear the above slope is much greater, hence a greater correlation.  Note: Tried my best to un-bias the effects of the different scales so it’d be visually clear.  Here are the correlation values:

Passer Rating:  .67

Yards Allowed: -.376

This is particularly relevant given the Eagles current situation, with QB uncertainty and a defense in need of serious upgrades (or significant improvement in current players).  In general, the play of Vick/Foles/Rookie? will be MUCH more important than the performance of the defense next year.

Another somewhat counterintuitive truth (at least regarding the magnitude of the difference in importance).  It also means the Eagles could use this draft, free agency, and scheme change to engineer a dramatic defensive improvement and still end up out of contention if the QB play isn’t good.


Let’s talk about Vick

Most of you can probably guess that I was shocked and disappointed at yesterday’s announcement that the Eagles have restructured Vick’s deal for a year.  To be abundantly clear: I think it’s a bad move.  However, there are a lot of different aspects to this decision, which I’ll endeavor to discuss here, some of which may be quite positive/hopeful.

– Chip Kelly clearly isn’t enamored with Foles.  Not a huge surprise, due to Foles’ relative lack of mobility, but I was hoping Chip would value the accuracy and poise more highly than he apparently has.  Also, I’m not buying the whole “open competition” comment.  Foles and Vick could not be more different as quarterbacks.  As a result, whichever “system” Kelly puts into place will tilt heavily towards one of them.  If the offense relies on the read-option, I don’t see any way Foles would win a competition for the starting job, he’s just not a fit for that scheme.

Also, the rumored discussions with Dennis Dixon should be added to the puzzle here.  In total, it’s clear that despite Chip’s professed flexibility, he really does want a truly mobile quarterback that can threaten defenses with his legs.

If I was Andy Reid, I would already be calling the Eagles and making an offer for Foles (or waiting to see if I could sign Alex Smith, then making a play for Foles).

– That doesn’t mean he’s in love with Vick.  My current belief is that Kelly doesn’t like either Vick or Foles as his permanent QB.  However, he has a specific system that he wants to install, and Vick was as close to a “fit” as there was on the market.  The fact that Vick wanted to stay here and was willing to rework his deal made that option very attractive.  Under this scenario, Kelly gets to fully install his system year 1 with Vick as the caretaker, rather than adapting it to suit Foles’ skills and then restarting when he finds “his guy”.  This makes some sense to me, though it suggests Kelly is heavily invested in his scheme, which makes me nervous considering he’s never tried it in the NFL.  In this case, it’s also possible the Eagles have their eye on a couple of QBs in the draft, and if they get one of them, can cut Vick before the season starts.  Vick gives the team insurance and means they don’t have to reach or overpay in the draft for a rookie.

– Maybe Chip is reading this blog.  Over a number of posts, I’ve explained why this past season the Eagles, in all likelihood, underperformed their “true success rate”.  The team was beset by injuries that decimated the OL, arguably the most important position group behind the QB.  Additionally, the Eagles had terrible luck when it came to turnovers (both giving/receiving and recovering).  Add in the near-historic special-teams ineptitude and it’s quite possible Chip reviewed last season and decided the potential is there for a much better football team than we saw this season.  For those of you looking for hope, this is the theory for you.  Predictions, for the most part, are worthless, especially when it comes to sports.  However, I’m going to make a couple here that I am extremely confident in, each of which bodes well for the team (I’ve mentioned them before):

1) The Eagles will not lose 22 fumbles next year or have a TO Differential of -24.  I’ve explained that fumbling the ball is largely random, and this year the Eagles caught the tail of that distribution.  Of the last 320 NFL team seasons, the 2012 Eagles had more lost fumbles than 99.4% of them (only one team had more).  THAT WILL NOT HAPPEN AGAIN NEXT YEAR.

2) In a related note, the Eagles recovered just 35% of all fumbles last season.  This number is almost completely random and over the long-term should be around 50%.  Though it’s certainly possible for the team to be unlucky again next year, I’m going to predict that the Eagles will recover MORE THAN 35% of all fumbles next year.

3) The Eagles this year had the worst relative field position BY FAR at -6.67 yards (a result of turnovers and terrible special teams).  A previous post of mine showed little persistence in this measure from year-to-year, therefore there is no reason to believe the Eagles will be that bad again next year.  So…the Eagles will have SIGNIFICANTLY BETTER average field position next year.

I apologize for repeating these, but they are vital pieces of evidence towards my most hopeful Chip Kelly/Vick/Eagles scenario.  None of these predictions require any great insight, just a cursory exploration of recent historical statistics and basic analysis.  It is quite possible (likely in fact), that Kelly and/or Roseman has reviewed these numbers and arrived at the same conclusions.

If so, it is entirely reasonable for Kelly to believe that combining better luck with a healthier OL, the #4 pick in the draft, and a few positional upgrades to the defense (hard not to find upgrades since they were so bad last year) will result in a significantly better team and one that can compete for both a playoff spot and a division title.

– Grace-period utilization.  Due to the performance of the team this year, it’s clear that Chip Kelly is not expected to perform a miraculous one-year turnaround.  He knows he has, in essence, a free year.  I mentioned early on in the coaching process that regardless of Kelly’s motives, he had to be salivating at the thought of Shady and Bryce Brown together in the back field.  Add in a healthy D-Jax, and you’ve got the type of speed Kelly prized at Oregon (and is VERY difficult to collect in the NFL).  In light of this, Chip might be thinking he has nothing to lose by trying to shoot the moon by adding Vick to this line-up.  I’m seeing a few people talking about Vick losing a step, but I don’t agree with it.  I’ve been pretty clear about Vick’s shortcomings as a QB, but speed is one area I am not concerned about.  Even at 85% of his prime-speed, Vick is fast enough to devastate defenses.

If Kelly has been given explicit guarantees of his job security (i.e. low expectations for this year) from Lurie, and I bet he has, then he really has nothing to lose by trying to go for it with Vick for 1 year.  The only cost here is impeding Foles’ development, but as I mentioned above, I don’t think Kelly cares about that and wouldn’t be surprised if Foles gets traded.

– Run-heavy option offense.  The biggest problem with Vick, outside of his fragility, is his propensity for turnovers.  However, Kelly might believe he can solve that problem fairly easily. How?  Don’t throw the ball.  Shurmur has already alluded to a run-heavy attack, and with Shady and BB, that should be the strategy.  It’s possible, though, that he’s underselling just how run-heavy the offense could be.  Could the Eagles try to run a Georgia Tech-style triple option in the NFL?  Why not?  Kelly has already stated that the only reasoning he won’t accept is “that’s the way it’s always been done”, which BTW is my absolute favorite thing about him.  With the speed in the Eagles backfield, a healthy OL (a healthy Peters especially), and perhaps a stud OT with the #4 pick, Kelly might believe he has the necessary ingredients to make an extremely run-heavy option offense work in the NFL.

If Vick doesn’t throw the ball, he can’t throw interceptions.  Fumbles are another story, but IMO they are much less of an issue than interceptions (both more random and easier to fix).

Concluding – Hopefully the thoughts above have given you a few new things to consider.  In any case, the Eagles will be interesting and entertaining, which at the end of the day is why the team exists.  We can complain all we want about not having a Super Bowl, but at least the team isn’t boring.  Would you rather be a Bucs fan?  If I was in charge, I would have already cut ties with Vick, but in exploring the situation, I can see a few strands of logic in the decision to keep him.  The fact is Kelly is coming into the league with such a good reputation, that anything he does right now deserves the benefit of the doubt.  Don’t worry, there will be plenty of time to tear him up later.


Positional Breakdown of the top 15

After my last post about the historical odds of selecting an All-Pro caliber player in the top 5 versus 11-15, there were several comments about the potential effects of positional skew, so I will address those today.  For example, Quarterbacks are much more likely to be taken in the top 5 than anywhere else in the top 15 picks, so that could affect the overall All-Pro odds.

Before we get to some charts, let me note that one of the reasons I didn’t address this in the last post is that, when broken down by position, the sample sizes get very small.  Hence, we have to be careful not to jump to conclusions.  However, the skew effects by position are real and potentially very large, so it’s worth looking into.

I split the top of the draft into three segments, 1-5, 6-10, and 11-15.  Below are charts illustrating the positional breakdown for each.  We are looking at all drafts from 1995-2011.  The data labels are a bit ugly, but I wanted to show both the values and percentages by position.  Unfortunately, the colors do not match up by chart, so you’ll have to actually compare numbers if you want to dig in.

Screen Shot 2013-02-11 at 1.29.55 PMScreen Shot 2013-02-11 at 1.30.02 PMScreen Shot 2013-02-11 at 1.30.08 PM


We can see pretty clearly that there is a big difference in positional distribution.  Before we re-evaluate the All-Pro odds, its worth noting:

– QBs, not surprisingly, are much more likely to get taken in the top 5.  The premium on the position means teams are much more competitive for them and therefore have to use more draft resources (i.e. higher picks) in order to get them.

– Wide receivers show a very strange pick distribution, with 9 selected in the top five, 18 going between picks 6-10, and just 6 selected from picks 11-15.  Haven’t yet come up with a reasonable hypothesis for this (mainly the drop-off from 18 to 6) but it may just be random.

So how does this effect our “elite” player odds?

Well it depends on the position, obviously.  The overall thesis from the last post was that teams are no more likely to find All-Pro caliber players in the top five than they are to find them with picks 11-15.  Overall, the data bears that out.  However, if you are looking for an All-Pro quarterback, its pretty clear that you need to take them in the top 5, if only because  top graded QBs don’t last very long (so most “1st Round” QBs go in the top 5).

What happens when we look at positions that don’t exhibit great frequency variation by pick?

First, let’s look at Defensive Ends.  In the above charts we can see that from 1995-2011, 11 DEs were taken in the top 5, 9 were selected from 6-10, and 14 went between picks 11 and 15.  Were the top 5 picks any more likely to become elite players?

Screen Shot 2013-02-11 at 1.54.23 PM


Not really according to the data, but since the samples are small, we should probably stick to saying it’s “unclear”.  In any case, this chart certainly supports the notion that it’s probably better to trade down from the top 5 (at least if the team is set on choosing a DE).

Now let’s look at OTs, another position for which there is relative consistency in terms of frequency by draft pick.

Screen Shot 2013-02-11 at 1.59.10 PM


Again it’s unclear.  Here the odds in the top 5 are clearly better than from 11-15, but with just 8 picks in the latter range, we’re really taking a leap to infer anything significant.  Also, the odds here are better between 6-10 than from 1-5.

Outside of QBs, which are so skewed by frequency that we can’t do much with the data, the only position that appears to show a significant decline in odds of success as you move later in the top 15 is Wide Receiver, and the numbers here are shocking.

Screen Shot 2013-02-11 at 2.06.13 PM

To make it a little more interesting, here are the 6 WRs that were selected between 11 and 15:  Yatil Green, Troy Edwards, Rod Gardner, Donte Stallworth, Lee Evans, Michael Clayton.

I’m guessing most people here have only heard of 3-4 of them…

I could go position by position and give you the All-Pro chart for each, but I don’t think it’d be that valuable.  Some positions show slight odds declines, but remember, the question isn’t just “Are the odds better with a top 5 pick?”, it’s “is the difference in odds great enough to outweigh the compensation gained by trading down?”

In general, my previous point stands:  Teams would be better off trading down from the top 5 (while remaining in the top 15).  This doesn’t hold if you are taking a QB, but for everyone else, nothing I’ve seen contradicts this strategy.

But how could this be?  I admit it doesn’t make a lot of intuitive sense.  All of the “elite” players chosen between 11-15 were available with picks 1-5, so shouldn’t the odds have been better there? They should, but they’re not, mainly because NFL scouting isn’t perfect.

Overall, NFL scouts appear to be very good at segmenting players by general ability (tiers if you will).  That’s why elite players are predominantly selected in the first round and almost never slip past the second round.  HOWEVER, scouts do not appear to be good at sub-sorting those tiers.  So they can pick out the handful of DEs (or whatever position you want) that are the best, but ranking the players within that group is extremely difficult.  This is where the problem of false precision comes into play.  If teams would recognize that limitation, they would consistently trade down, selecting the last available player in the best “tier”.  GMs and scouts, though, appear to believe they can reasonably predict which individual player is going to be better,  leading them to use draft resources inefficiently.

If you play fantasy football, you should be familiar with this.  I’m betting at least some of you sort players by tier prior to each season, and draft accordingly.  So you don’t get hung up on which QB is the “best”, you just make sure you get one from the best group, understanding that it’s impossible to predict exactly who among that group will have the most successful season.

I’m going to do a deeper analysis of this concept soon and look at the relative performance of players according to order drafted (for instance, does the 1st player taken at any position outperform the next player taken at the same position), but for now, the Star/Joeckel/trade-down strategy remains (assuming those players are as highly regarded as currently indicated, Joeckel seems to be losing some ground to other OTs).


Big evidence for trading down with a top 5 pick.

Having some trouble with the Game Rewind program, so that’ll have to wait, but what I’ve done instead is far more interesting anyway.

We’ve explained pretty clearly that “elite” players come almost exclusively from the first round. Additionally, it was my expectation that the top 5 picks would see a much higher percentage of All-Pros/Pro Bowlers taken than in the rest of the round.   THIS IS WRONG!

I’ve been operating under the assumption that the Eagles at #4, must get an All-Pro player, because teams rarely get to pick that high in the draft.  However, it turns out the odds of getting an elite player are really no greater in the top-5 than in the top 15.  Here are the numbers:

I looked at every draft from 1995-2011 (slightly different time-frame than I typically use), counting how many All-Pros and Pro Bowlers came from each pick (insert normal caveat about Pro Bowl designation here).  Please note that if a player counts as an All-Pro, he does NOT also count as a Pro Bowler. So…

Screen Shot 2013-02-08 at 12.09.30 PM

Odds of getting an All-Pro player is no different in the top 5 than in picks 11-15.

Here is the same chart, with additional rows showing the comparison of the top 15 picks versus the rest of the 1st round.

Screen Shot 2013-02-08 at 12.13.16 PM

As you can see above, there is little difference within the top 15 picks (the Pro Bowl drop-off is notable, but the All-Pro designation is a lot more valuable IMO).  However, there is a HUGE drop-off after pick 15.   Admittedly pick 15 is an arbitrary place to split the first round, but it does appear to be close to (if not equal to) the actual inflection point when it comes to a dramatic shift in the odds of getting an elite player.

So what does this mean for the Eagles?  Well it depends on your viewpoint, but it certainly supports the notion that the Eagles’ optimal strategy would be to trade down from 4, picking up extra picks while staying in the top 15.  In fact, given how high the pick is, the team could probably trade down twice and still remain in the top 15.

If the team is blown away by either Joeckel or Lotulelei (my two current favorites for the team, with the DT ahead by a nose) and one of them is available, then the Eagles make that pick.  However, if there are ANY reservations about either, or if neither is still on the board, than the right move is to trade down to the bottom of the top 10 and either take the best available, or trade down another couple picks and then take the best available player.

I realize the All-Pro and Pro Bowl designations are a bit subjective, but creating any other criteria in order to identify “elite” or “impact” players would arguably be just as subjective, so this is what we’re going with.

For those who are interested, here are the draft picks I looked at, with All-Pro’s highlighted red and Pro Bowlers highlighted yellow.

Screen Shot 2013-02-08 at 12.25.59 PM

Screen Shot 2013-02-08 at 12.26.50 PM

Screen Shot 2013-02-08 at 12.27.31 PM

Screen Shot 2013-02-08 at 12.28.07 PM