QB Performance Frequency Distributions

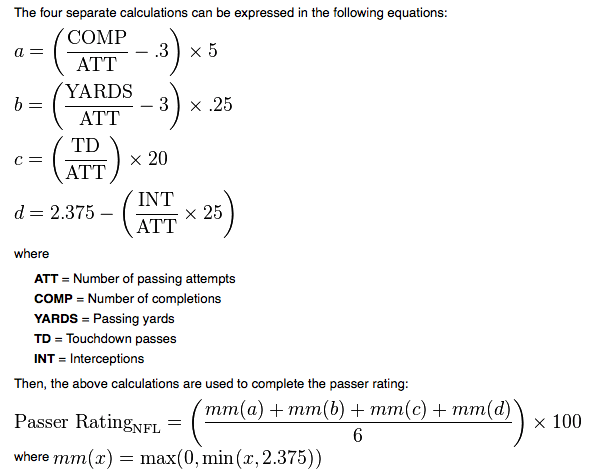
Ok, so a couple of weeks ago I posted about how often great QBs have bad performances. Today, let’s take a more detailed look at things.  The overall question is, are quarterbacks equally likely to outperform or underperform their long-term average QB rating in any individual game?  Stated differently, are the individual performance distributions symmetrical?  Are they Normal?

Let’s start at the top.  Here’s the graph for Peyton Manning.  Note that the X-Axis labels show the UPPER Bound of each bar.  So the “60” label means that bar corresponds to games where the player’s rating was between 50 and 60.  Also, this is all games with at least 10 pass attempts.  Remember that these are NOT weighted numbers, so they’ll be different from the career measures for each player.  This helps to minimize the skew effects of games with a lot of pass attempts (garbage time yards in a blowout loss for example) as well as increase the weight of great games with relatively few attempts (when a team has a big lead early perhaps).  Realistically, we just want to know what level of performance we’re likely to get in the NEXT SINGLE game.

Screen Shot 2013-11-27 at 4.26.10 PM

That looks pretty Normal.  The Mean is 97.45 (note that this is NOT his long-term average, since it’s not weighted by attempts).  The Median is 95.6.  Obviously, those are crazy-good numbers.  That’s why he’s a HOFer.

Big-picture, if players generally follow a Normal distribution, then we can tell a lot about Nick Foles from relatively fewer games.  So Peyton’s chart is really encouraging.

But here’s Drew Brees:

Screen Shot 2013-11-29 at 10.54.36 AM

Not nearly as neat as Peyton’s.  The Mean is 95.17, the median is 92.4, and there’s some clear skew to the distribution.  Going back to the last post (linked above), notice that Brees has had more games with ratings between 60-80 than he has games with ratings between 80-100.  Overall, his performance, though still amazing, is less predictable than Manning’s.  The standard deviation of Brees’ game log is 29 (rounded) while Manning’s is 27.  Illustrated differently, we can look at the range covering the middle 50% of performances:

Manning:  79.9-112.2

Brees:  72.8-116.7

Again, both great, but Brees is less predictable.  We could raise some interesting strategic questions here as far as which one you want in which situation, but I’ll save that for another day.  For now, just imagine tying it back to our “David Equation” (that’s what I’m calling it now).  Brees might not be as good, but his higher-variance play might be preferable for an underdog team, while you’d rather have Manning if you’re the favorite.

Now let’s take a step down and look at some non-future-HOFers.

Here’s Sam Bradford:

Screen Shot 2013-11-29 at 11.04.18 AM

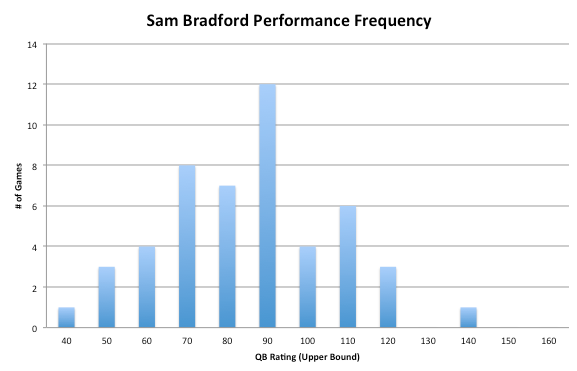
Much uglier, as expected.  The mean is 80.48, the median is 81.2.  The standard deviation is actually much lower than either Manning or Brees, at just 21. His middle-50% range is:

66.3 – 91.3.

That’s what a bad QB looks like.  Now we should probably caveat all of this by saying it’s a bit unfair to evaluate the QBs in a vacuum, with no regard to the talent level they’re working with.  That’s the case with just about every NFL evaluation, it’s just the nature of the game.  Still, Bradford hasn’t been good enough, and I’m skeptical he ever will be…

How about Eli? (You knew I couldn’t leave him out)

Screen Shot 2013-11-29 at 11.41.26 AM


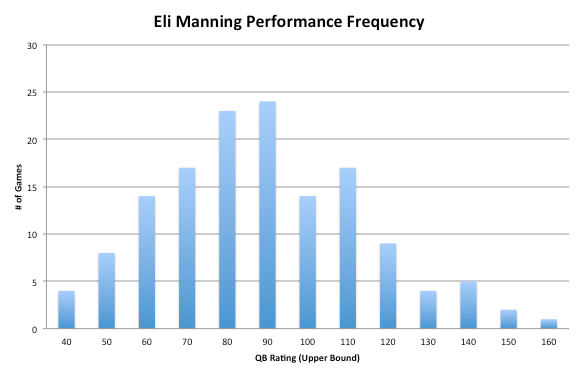
Mean of 82, Median of 81.65.  Standard deviation of 27.3.  Hmmm…those numbers look vaguely familiar.  What were Sam Bradford’s again?  (mean of 80.48, median of 81.2, stdev of 21).

Interesting.  Future HOFer Eli Manning’s average a median performance are almost identical to secret-bust Sam Bradford (secret because nobody seems willing to say it outright.  I will, Bradford is a bust, unequivocally.  Closing in on 2000 pass attempts, he has a com % below 60 and a Rating below 80).

What about Eli’s middle-50 range?  63.6 – 100.7.

That’s just about the definition of mediocre (and maybe even a bit worse, we’ll see later).

Before I move on, let me repeat one thing.

Eli Manning’s MEDIAN performance is a rating of 81.65.  So HALF of his starts are WORSE than that.

Going back to the initial question I posed:  Are individual QB performance distributions symmetrical?  Almost, though we have to grade it as inconclusive since I only looked at a few QBs.  So we might be able to use that to infer some info about Foles.  Clearly, though, they’re not Normal… There’s a lot more we can do with this type of data, but I’m going to have to wait for another day to start on it.

Also, as is usually the case, I think I stumbled onto something more interesting (the middle-50 ranges).  So rather than go through each QB and post a chart of they’re distributions, I’m going to end this post now and start making a table of every starting QB’s Middle-50 range.  Then we can start talking about which is “best” in a given situation, with some real data to go from.

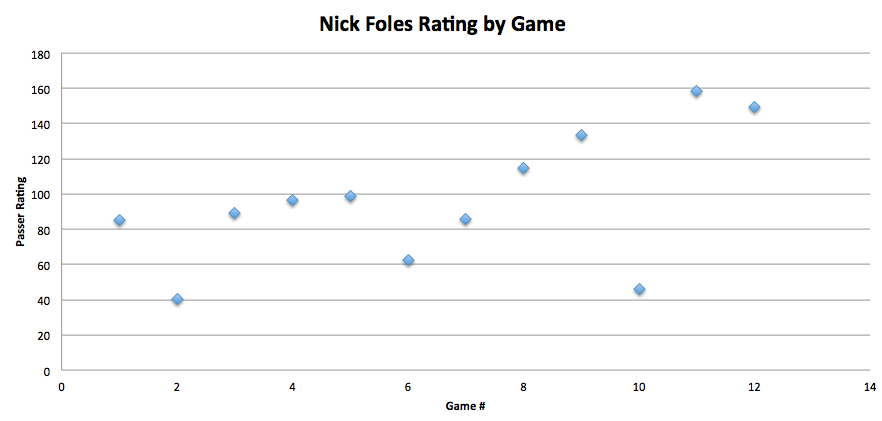
Before I go, here’s Nick Foles.  He has just 11 qualifying games, so small sample is an understatement, but it’s fun to look anyway.

Screen Shot 2013-11-29 at 11.59.26 AM


Average is 97.2, median is 96.6.  Standard deviation is 35.8.

And here’s Mike Vick.

Screen Shot 2013-11-29 at 12.02.51 PM


Average is 80.9, Median is 83.6.  That’s 2 points BETTER than Eli’s median performance…. Vick’s standard deviation is 28.6.

Happy Thanksgiving

Revisiting PreSeason Projections: Overrated Teams

Sticking with the preseason review today (no better time to do it than a bye week, other than after the season ends, of course).  This time lets revisit the list of overrated and underrated teams I posted before the season started and see how things stand.

Overrated

The original post is here.  Below, I’ve included the summary table.

To refresh, I simply took the Football Outsiders projections and compared them to the Vegas lines to see where the biggest differences were and what they could tell us about the expected performance of teams.  As you can see, pretty much nailed this one. The most overrated teams, by this measure, were Atlanta and Minnesota.

Atlanta, of course, is currently 2-9 and arguably the biggest disappointment in the league this year (though I’d obviously argue that they shouldn’t have been so highly rated to begin with.

Minnesota was another gimme.  Anyone taking the Over (7.5 wins) for this team was either crazy or stupid.  Specifically, I said:

I have the Vikings in the 4-5 win range, which is even lower than FO.  While there are a number of explanations (including the points above), it really comes down to Christian Ponder versus a very tough schedule.  I think it’s likely to be a train wreck.

To date, the Vikings are 2-8-1.  Ponder hasn’t exactly been a train wreck, but with 9 interceptions (to 7 TDs) and a rating of 78.7, he hasn’t been good either.

Miami started the season strong, winning the first 3 games, but has lost 6 of 8 since then.  Currently at 5 wins, the Dolphins are likely to surpass the FO projection, and may even get to the 8 wins O/U (I doubt it though).

All told, you’d have done pretty well by following this chart.  Certainly regarding the teams identified as the most significant projection dislocations.  Said differently, if you looked at the original post and took the under on the Vikings and Falcons, you’re pretty happy now.

The Eagles, of course, are not on this list.  FO projected the team to win 7.8 games, while the O/U was set at 7.5, making them Underrated, though only marginally so.  My personal projection was for 9 wins, which still looks pretty good.

Busy week (exams approaching), but I’m hoping to post performance distributions for prominent QBs to continue our discussion (in more detail) about reasonable expectations, so look for that sometime in the next couple of days.

Checking in with Preseason projections

The bye week is a good time to revisit our preseason projections, so today, let’s look back at how I though the season would play out.  If you remember, I took two different approaches.  First, I used a basic, back-of-the-envelope points for and against projection matrix.  The base-case assumption there was 9 wins, though the average outcome of the matrix was a bit higher (9.1 wins).  Here is the matrix:

After I did that, I went through the schedule and tried to come up with benchmarks, the clearing of which were (a) reasonable, and (b) would lead to 9 wins.

Let’s start with the win projection.

The base case projection (9 wins) was built from an assumption that the Eagles would produce points at a level 15% better than the league average and allow them at a level 5% worse than league average.  Over the course of the season, I projected that to equate to an overall point differential of +37, which I plugged into the Pythagorean projection model to get to 9 wins.

Through 11 games, the Eagles’ point differential is +16.  They’ve scored 276 points and allowed 260.  Based on that, my projection looks pretty good.  If the Eagles kept up at that exact pace, they’d end up with a point differential of about +23, just two TDs from the +37 projection.

However, I think it’s instructive to dig a bit deeper and take a look at how each side (point production and points allow) has compared to our expectations.

As I said above, I expected the Eagles to score 15% more points than the league average.  To date, the team as averaged just over 25 points per game.  The league average (including the Eagles), is currently 23.4 points per game, meaning the Eagles have scored 6.8% more points than the league average.  That means the Eagles offense (technically “point production” to include defense and STs) has been worse than I expected, by approximately 1.8 points per game.

However, some of that can be attributed to the Matt Barkley game, as I obviously didn’t plan on him getting a start this year, and we can also assume that the offense would have scored at least a few more points if it hadn’t been playing with big leads (especially against the Redskins).

On defense, I expected the team to be 5% worse than league average.  Thus far, they’ve allowed roughly 23.6 points per game.  The NFL average, as we saw above, is 23.4 points per game, meaning the Eagles have been worse than average, as expected, but by a very small margin (less than 1%).

Stepping back, the offense has been slightly worse than expected, though I think we know why, and the defense has been slightly better than expected.  Overall, though, the base-case projection looks to be pretty damn close.

The Benchmarks

I then tried to game out the season, and assign benchmarks for various portions.  So how do the Eagles look when compared to the roadmap I set out?  Well it just so happens that I set one of the benchmarks to the Bye week (naturally).  If you check the link (up top), you’ll see that, for the team to get to 9 wins, I felt it had to have a record of at least 5-6 at the Bye week.

Of course, the Eagles have exceeded that by one win, and currently stand at 6-5.

Rather than re-hash how we got here, I’m just going to look forward.  Things didn’t go exactly to plan, but the general path is far from what I expected.  The key, of course, is what happens now.

In my pre-season roadmap, I called the section after the Bye week “The Dessert”.  Based on the team projections, it looked to be the easiest section of the schedule, and I somewhat aggressively said that 4-1 would be a reasonable expectation of performance for the Eagles through this stretch.  Has anything changed?  Let’s go through them:

Cardinals – Their 6-4, but have a point differential of just +2.  They’ve won their past 3 games, but have faced Atlanta, Houston, and Jacksonville over that span.  They feature a good defense and a mediocre offense.

Lions – A bit schizophrenic, as usual.  Hard to peg how they matchup against the Eagles.  The downfield passing game (Stafford to Johnson) looks to be a terrible matchup for the Eagles, but it’s not as if the Lions’ defense has impressed (ranked 22nd by DVOA).

@ Vikings – Not a good team and it’s offense revolves around the rushing game, which he Eagles have had success against.

Bears – By DVOA, this is the toughest game remaining on the schedule.  The Bears rank 5th overall by Football Outsiders.  Similar to the Lions, the primary matchup concern for the Eagles will be a great, big, WR (Marshall).

@ Dallas – Already looks to be the key game of the year and has a good chance of deciding the division (and probably the only shot at a playoff spot).  Lost to Dallas once already, so have to account for that.  However, Dallas’ other wins have come against the Giants, Rams, Redskins, and Vikings.  Not one of them ranks higher than 20th by DVOA.  Call me unconvinced…(not that the Eagles’ win resume is that impressive either).

Remember that the Eagles outperformed my projection before the bye week, so the team only needs to win 3 games to get to 9 wins.  Can it?  Absolutely.  Will it?  I think so.  Beating the Vikings means you need to got 2-2 against the Cardinals, Lions, Bears, and Cowboys.  As far as I’m concerned, those teams all count as “mediocre”, though the Bears are on the upper edge.

If we break that up even further, the immediate question becomes:

Can the Eagles get one win from their next two games? (Cardinals and Lions).

If the answer is yes, then 9 wins still looks like a likely outcome.  (and the answer IS yes)

Notes from Yesterday

Just a few notes from yesterday’s game:

– I don’t understand Chip’s decision to dial down the offense in the second half.  It makes complete sense to become more conservative and to take fewer risks when you have a lead (think equation).  HOWEVER, when the opposing team is basically begging for you to take a shot, you should take it.

Early in the game, it was clear the Eagles were going to take shots downfield when they had Cooper matched up one-on-one with a DB with no safety over top.  It almost led to an early TD (Cooper lost sight of the ball).  Anyway, late in the game the Redskins were packing 8 in the box and playing a single deep safety.  That means you’ve got both D-Jax and Cooper against a CB, and the safety can only help on one of them.

Somehow, a situation Chip was hoping for and targeting early in the game lost its appeal.  Keep in mind that this is not a high-risk play.  Throwing it deep to Cooper when he’s in single coverage is very unlikely to produce an outcome worse than an incomplete pass.

Given that we saw this exact same situation play out last time the team played the Redskins, after which Chip claimed he learned his lesson, I’m worried this will be a recurring issue.  Obviously, that would necessitate having big leads, which would be awesome, but it’s still a bad habit.  My only guess as to the reasoning is that Chip still doesn’t fully trust Foles.

– Overall a good win, but let’s remember that the Redskins aren’t a good team.  We’ll learn a LOT more about the team when it faces Arizona and Detroit after the bye week.  To date, the Eagles “best” win came against a Green Bay team playing with its 3rd string QB.  It remains to be seen whether the Eagles rank within the “mediocre” division of the NFL.  They’ve lost against Dallas and San Diego…which would suggest they’re at the bottom of that subset of teams.  If so, they’ll have trouble against the Cardinals.

– Still researching the topic, but safe to say that Nick Foles is at least close to doing something unprecedented.

He now has a career rating of 97.6, with 22 TDs and just 5 interceptions.  He’s also rushed for 3 TDs.

His rating this season is currently 128.  The single-season record is 122.5 (Aaron Rodgers).

Under Chip Kelly, he’s seen significant playing time in 6 games…he’s won 5 of them.

His career interception rate is now 1.2%.  The NFL Record for a career rate is 1.7% (Aaron Rodgers…yeah, he’s really good).

As I showed at the end of last week, few QBs have, at ANY point in their careers, had a career rating that as high as Foles does now.  The fact that Foles has it 15 appearances and 11 starts into his career is a very good sign.

Naturally, it’s a safe bet that Foles won’t maintain this level of play.  The next question, though, is:

What are the odds a “bad” QB could have a stretch of games like this?

How about a “mediocre” QB?

We could probably turn to Bayesian analysis to help out, but for now, it’s enough to know that the odds of either situation aren’t very good.  When you then consider that fact that he’s doing it to start his career, I think it’s safe to say Foles’ odds are now pointing heavily in favor of at least “solid NFL starter” and potentially much higher.

– Last point.  Chip was correct in going for it on 4th and 1.  There’s just not much to gain from punting the ball there, especially in comparison to the relatively high likelihood of maintaining possession.  I was much more concerned about the play-call.  It looked like a delayed handoff, which would be an inexplicable call (especially to Bryce Brown).  However, it may also have just been a miscommunication.  Unfortunately, the announcers had already stopped calling the game and were too busy to bother talking about it.  I don’t think we even got a replay.  I’ll have to review the film, but my first impression was: right strategy, wrong play.


P.S. It’s week 12 (practically) and the Eagles are entering their bye week in first place.

Tracking QB Rating over time

Limited commentary with this post, because it’s somewhat self-explanatory.  I decided to go back and calculate an on-going QB Rating for several prominent players to see how each would have looked, statistically, after every appearance made.  Obviously, this relates to Nick Foles.  Basically, I cannot think of a single QB who has had a start to his career anywhere near as good as Foles has (statistically) and then NOT gone on to have a good career.  However, I figured it would be instructive to look at some successful QBs and see how they progressed over time.  Below is the chart.

Before we get there, though, a PSA: The NFL QB Rating calculation, while useful, is very convoluted.  Almost nobody knows it or has even seen it, so for your education, here it is (from Wikipedia):

Screen Shot 2013-11-15 at 7.16.13 PM

Fun stuff, eh?

Anyway, back to the subject.  Here’s the graph, I suggest you click to enlarge:

Screen Shot 2013-11-15 at 7.10.31 PM

I only included the first 100 appearances (NOT starts) for each player.  Note that this is an ongoing calculation, so it becomes less susceptible to change with every appearance.  I’m hesitant to draw any conclusions from such a small sample size, but including other QBs (I originally included Vick, Brady, Brees, and Josh Freeman) makes the graph too hard to read.

In any case, I’m going to build the sample from here to see if we can divine a good idea of when, regarding Foles, we can exhale.  For now, just take note of how “poorly” each of the included QBs played to start their careers.  And because you knew I would, I included Foles below, along with Brady and Brees.  Notice that none of these guys had as high a QB rating after 14 appearances as Foles does.  Moreover, among these guys, Foles tracks most closely with…Tom Brady.   I know attempts would be a more helpful measure, but I don’t have data for that, so…this:

Screen Shot 2013-11-15 at 7.31.08 PM


Update: Should have noted this originally, but the chart doesn’t account for the general offensive inflation the league has seen since guys like Peyton started their careers. Regardless, the adjustment would only involve shifting Foles’ line down slightly, and would’t significantly change how things look.  The trend, obviously, would remain the same.

How often do good QBs have bad games?

Another game, another great statistical performance from Nick Foles.  This one was certainly luckier than some of his previous gems, but that’s hardly a good reason for writing it off completely.  While thinking through his performance, I decided to look at the topic referenced in the title to this post.  Before that, some quick notes on Foles:

– With each game, Foles’ sample size grows, and the odds of him being a “fluke” decline.  As promised, here’s his updated QB Rating by game chart:Screen Shot 2013-11-11 at 6.33.27 PM

– Eagles fans might not fully appreciate this, but having a QB whose “bad” games don’t involve a lot of turnovers is not a bad place to be.  McNabb never turned the ball over, but perhaps Vick has given you some perspective.  Most “bad” QB games are a lot uglier than we’ve seen from Foles.

– Going back to our strategic equation (E = R ((60 – T) / 60) + C), and applying it to yesterday’s game, we can see that Foles’ relatively underwhelming performance might have been the result of very rational decision-making.  When Seneca Wallace left the game, leaving Scott Tolzien to lead the Packers, the Relative Strength swung largely towards the Eagles.  As a result, they became the strong favorite, meaning they should be playing a LOW-variance game.  For Foles, this meant avoiding turnovers at all costs.  I don’t know whether this was actually the case or not (probably not), but Foles would have been completely justified in not throwing to WRs unless they were VERY open.  After grabbing a lead, it became somewhat clear that the best chance for the Packers to win lay in the Eagles turning the ball over.  If Foles/Kelly made a conscious decision to go with low-risk plays, then the result would look underwhelming but, in fact, be the right strategic call.

– Of course, Foles DID throw one ball into coverage, but it was on a deep throw.  While I have not confirmed on the replay, my initial take on the play was somewhat different from most others.  In my view, he did NOT throw “into double-coverage”.  He under-threw D-Jax, the result of which gave a second defender time to get into the play.  That seems like a slight difference, but it’s important.  There are two aspects to the play:

1) the decision to throw the ball (mental)

2) the actual throw (physical)

I think Foles got the first half 100% correct, he just messed up the execution.  In general, a slightly under thrown deep-ball is a lot more defensible than a decision to throw into actual double-coverage.

Ok, enough about Foles.  In thinking through the odds/fluke/sample-size piece, I decided it would be interesting to provide some context to the QB expectations discussion.  I did a little of this when I talked about McNabb’s HOF credentials, but today I’ll do it in more detail.

The overall point is that most fans (I think), overrate the consistency of “great” QBs and set their expectations for the position too high.  Great QBs have bad games, and as we’ll see (I hope), they happen more often than you’d think.

Setting it up

First we need to define our parameters.  I’m going to use QB Rating, with all relevant caveats acknowledged.  For our categories, I’m using the following:

Great: 105+

Good: 95-104

Decent: 85-94

Poor: 75-84

Bad: < 75

Below are charts for a selection of QBs.  I only included starts with at least 10 pass attempts.  Sorry for the blurriness, click for a clearer picture.

Screen Shot 2013-11-11 at 7.28.02 PM

Take a good look, cause there’s a lot of good information in there.  Most important, of course, is the frequency of “bad” games (rating of worse than 75).

– Tom Brady has a “bad” game roughly 25% of the time.

– Drew Brees has a “bad” game nearly 1/3 of the time.

– Even Peyton Manning doesn’t crack a rating of 75 in almost 20% of his starts.

That doesn’t even include the incidence of “poor” games either.  When you add that in, you can start to see the point I’m trying to make.  Even the best QBs in the league have what fans would consider a bad game fairly often.  Now they do, obviously, provide a high rate of “great” games as well, that’s what makes them “great quarterbacks”.

A couple more notes:

– Tony Romo compares favorably too both Drew Brees and Tom Brady (commence vomiting now)

– FutureHallOfFamer Eli Manning’s starts have resulted in either “bad” or “poor” performances more than half the time (54%).  Let that sink in….if you randomly picked a game from Eli’s career, you’re more likely to get a poor/bad game than a decent/good/great game.  It’s not too late to kill his HOF candidacy…

So next time Nick Foles has a bad game (like that’s every going to happen again), remember this post.  Even the greatest QBs have bad games, and it happens more often than you’d think.

Eagles vs. Packers: Breaking Down the Odds

Below is a repost of the weekly odds column I do at BGN

Nailed it last week, though I wasn’t very confident in my Over pick. Starting to see a trend here; when the Eagles get competent QB play, they hit the over. Whether they’ll get decent play from the QB each week is a tough prediction to make though.

This week, we’ve got some issues breaking down the line. Prior to the Rodgers injury, the Packers were favored by 10 points. Now they’re favored by just 1.

From a pure handicapping perspective, this would have been a lot easier with Rodgers healthy. Of course, we all want the Eagles to win, and playing against Seneca Wallace instead is a huge break.

So…the lines

Eagles +1

47

The Spread

As you can imagine, getting 1 point isn’t a huge advantage, so we’re basically trying to figure out which team is more likely to win. If it’s 50/50, then you take the point. Anything else, and you take the team more likely to win. First, lets consult Football Outsiders.

– The Packers rank 10th overall by DVOA, the Eagles rank 16th.

– The Packers offense is the team’s biggest strength, coming in 2nd by DVOA (23.5%). The Eagles are relatively close behind, ranking 6th overall on offense (14.8%).

– The Packers rank 26th by DVOA on defense (7.1%), while the Eagles rank 30th (13.4%)

– The teams have nearly identical special teams rankings, coming in 25th (GB) and 26th (PHI), with a DVOA difference of just 0.9%.

Without the injury to Rodgers, it’s a clear advantage for GB. However, I think 10 points was a bit excessive, and frankly might have rather taken the Eagles in that situation getting 10 points instead of taking them now against Wallace with just 1 point. But it is what it is, so lets work with what we’ve got. First question:

Will Nick Foles provide decent or better QB play? If so, then the Eagles will score plenty. The Packers defense, as illustrated above, isn’t good. I should also note that, in the FO DVOA rankings, Green Bay is just one spot above Oakland. So while we shouldn’t expect 7 TDs again, it’s completely reasonable to expect a good performance, and something on the order of 30 points. In the games in which the Eagles QB has played reasonably well, the Eagles have scored 33, 30, 36, 31, and 49 points. Going against a bad defense, I’m comfortable with setting a 28-35 point expectation from the Eagles. Unfortunately, if bad Foles shows up, they may not hit 10 points. I’m assuming we’ll see decent-not-spectacular Foles.

How should we view Seneca Wallace? Seneca Wallace is NOT a complete unknown. The guy has been in the league since 2005 and has played in parts of 64 games, starting 21 of them. In that time, he has a Rating of 80.6, a completion percentage of 59.1%, an interception rate of 2.4%, and a sack rate of 7%.

Overall, that amounts to a slightly below average QB.

Replacing Rodgers, who is, at this point, putting up the greatest statistical career ever for a QB with a slightly below average QB is a massive difference. But how much?

Well if we expect a performance in line with his career averages, we’re essentially looking at this years’ Alex Smith, with a slightly higher propensity for interceptions. Against Smith, the Eagles allowed 26 points. However, 7 points came from Eric Berry’s pick-six. Now the rest of the Packers offense is better than the Chiefs, but not by that much. The difference really is mostly Rodgers. The Packers receivers look to present a bigger challenge than the Chiefs did, so we should adjust upwards there, since the Eagles weakness has been through the air. How much is Nelson/Cobb instead of Bowe/Avery worth? A few points? Lets be extra conservative and call it 7. So we’re looking at a rough range of 24-30 points. (I’m writing off Lacy-Charles as a wash, not because that’s fair, but because it makes our estimate even more conservative and gives us a greater margin of confidence).

Since I had the Eagles at a range of 28-35 points, that means take the Eagles +1. Just know that the high-variance nature of Foles’ play means it’s a relatively binary outcome. If Foles can deliver the ball with some accuracy, I like the Eagles. I think it’s more likely than not that we see an at-least-decent Foles. Therefore, take the point.

The Over/Under

The line is 47. Taking the mid-point of the ranges I set above gives us around 58 points. That’s a big difference. Usually, when the difference is that big, it means either we did something wrong or one of our assumptions is way off. If it’s neither, than we need a good explanation of why “the market” is off. What’s my story?

– Overreaction to Wallace’s poor showing in relief (11 of 19 with an interception). Wallace will likely be better than the general public expects. Remember we have a pretty good sample on him (783 career attempts).

– Still underestimating Nick Foles. If I wasn’t from Philadelphia and I wasn’t paying as close attention as I have been, I’d likely dismiss Foles as well. He just doesn’t have the pedigree. Of course, the people paying close attention know the truth; Foles has been a pretty damn good QB so far. He had a terrible performance against Dallas, and I think people are likely still giving that significant weight. In fact, I think his record-tying performance last week might actually work AGAINST him. It was so cartoonish that it’s easy to dismiss as a fluke. “Nick Foles playing the best game ever by a QB? C’mon. He just got lucky.” Conversely, if he had played really well, but only thrown 4 TDs, I think the story would be harder to write off. It doesn’t make any logical sense, but remember we’re dealing with people, logic doesn’t always apply.

Also, Eagles games this year have failed to hit 47 points just 3 times. Once was against the Chiefs (great defense) and the other two were the Barkley game and the bad-Foles game. Every other game has hit at least 51 points.

Also, the Eagles are 5-0 against the O/U on the road this season. I don’t actually put much weight into this fact, but it’s a nice confidence boost.

Conclusion

I like the Over 47 most.

I like the Eagles +1

It all hinges on Nick Foles. That sounds obvious, and it is, but the key nuance is that Nick Foles doesn’t need to be great, or even very good. If he just does what a decent QB should do (hit open men and not make stupid mistakes/TOs), that should be enough. I think the odds favor him reaching that level of play.

You can follow me @EaglesRewind

Notes on Nick Foles

Been swamped the past few days, hence the lateness of this post.  I originally intended to just post my normal post-game notes, but I think at this point everyone has already read enough about that game.  It was awesome, encouraging, etc.., but it was also against the Raiders, so let’s try to contain ourselves just a bit.

I do, though, want to talk more about Nick Foles (of course).  A few points:

– First, I promised to update this chart (Foles’ rating by game), so here it is:

Screen Shot 2013-11-07 at 9.23.18 AM

You can come to your own conclusions.  Remember, I only included games in which Foles threw at least 10 passes.

Nick Foles DID play last year.  In some of the write-ups about him that I’ve seen, its as though the kid’s first action came this season.  It didn’t.  He played in 7 games last year and had 265 pass attempts.  He finished with a QB Rating of 79.1, which as I’ve showed, is VERY good for a rookie.  He did benefit from some dropped interceptions, so have to discount the rating, but he ALSO played behind a bad O-Line and, at times, didn’t have his best “weapons”.

So it’s not as if his performance over the past few weeks came out of nowhere (both good and bad).  Over the entire offseason, I tried to emphasize that Foles’ performance as a rookie was strong, and while he wasn’t (and still isn’t) the definite “answer”, his play certainly should have earned him a chance to start.

– What exactly are Foles’ strengths and weaknesses?  Coming into this year, I thought we had Foles pegged.  He showed good pocket awareness and was very accurate on the short-intermediate throws.  The big question marks involved his arm strength.  He struggled a bit on sideline throws and while he was able to get the ball downfield, his accuracy on those throws was poor.

Well….the past two starts for Foles have completely undercut those assumptions.  Against Dallas, his short-throw accuracy was terrible and his awareness was severely lacking.  Conversely, against the Raiders, he clearly demonstrated an ability to not only push the ball downfield on deep throws, but to do so with good accuracy.  I mentioned at the end of last year and over the offseason that the deep-throw accuracy was something he SHOULD be able to improve upon, whether through better technique or actual strength-training.  It’s possible what we saw against the Raiders was an outgrowth of that type of improvement.

Overall, we essentially have to completely rebuild our assumptions about him.  Barring another Cowboys-like performance, I’d be surprised if Foles didn’t start the rest of the way, so we should get plenty of chances to refine our expectations, but for now we’re back to square one.  Theoretically, he CAN do everything (except run fast).  But we need to know which parts of his game are consistent enough to be called “strengths” and which ones are inconsistent enough to be called “weaknesses”.

– How does he stack up when compared to other notable QBs?  I wanted to do a full post on this, but it looks like ChipWagon beat me to it, at least partially.  However, let me take an abbreviated crack at it.  Here is Nick Foles, in comparison to notable quarterbacks over similar Pass Attempt samples to start their careers.  Note, this is by no means a representative sample.  I picked QBs who are both successful and had a similar number of attempts their first year in the league (so I didn’t have to calculate).  Big note here is that Foles’ numbers are over parts of the first 2 seasons, whereas the rest came from 1 season (I did include the 3 attempts Brady had his rookie season).

Screen Shot 2013-11-07 at 9.37.29 AM

So…yeah, pretty good.  The interception rate in particular is phenomenal.  Remember that Foles benefited from a relatively high number of dropped INTs last year.  However, this year I don’t recall seeing many, though I haven’t seen the actual count from Football Outsiders (I don’t think it’s available until year-end, if I’m wrong about this please tell me).  Also, despite Foles famous lack of speed, his sack rate is either better or comparable to every player in that table other than Matt Ryan.  To beat a dead horse, POCKET mobility and awareness is much more important that straight line speed or rushing ability.

The biggest caveat, of course, is that we’re looking at these numbers after perhaps the greatest statistical performance by a QB in the history of the NFL.  That’s  a bad time to do it, but I didn’t want to wait.  To rectify, I’ll update Foles’ numbers after this week and maybe each week from here on so we can get a continuing look at how he stacks up.

Eagles vs. Raiders: Pre-Game Notes

We’re entering the second half of the Eagles schedule, and I think it’s safe to say that while some questions have been answered (Chip’s offense works, Barkley fell for a reason,    Cole/Graham are not the answer at OLB, etc…) many more persist.  Unfortunately, the Eagles look like they’re too good to secure a top draft pick and too bad to really threaten anyone in the playoffs.  still plenty of time for that to change, but for now, it’s best to focus on the questions we CAN answer, or should be able to.  For today, mine look like this:

– What’s Nick Foles’ ceiling?  Let’s start with the obvious one.  He’s either a starting caliber QB with good accuracy and the ability to consistently pilot the team on scoring drives, a solid backup who can step in for short stretches and avoid turnovers, or completely overmatched (see Dallas game).  We’re not going to answer that definitively today, but every start Foles gets is another piece of evidence with which to judge his potential.  I don’t think he’s Chip Kelly’s “guy”, but if he plays well he may have some trade value or at least provide a viable enough option that Chip can take his time to find “his guy” instead of reaching for one in next year’s draft.

– What’s Bennie Logan’s deal?  I didn’t like this pick when the Eagles made it, but that was more value-based than commentary on Logan’s potential.  With Sopoaga gone, Logan knows the job is his if he can handle it.  He’s still a bit undersized, so he might deserve some leeway until he fully adjusts; but make no mistake, the clock’s ticking.  I don’t know how Davis or Kelly feel about the NT position, but in my opinion, it’s an area where you can’t settle for just adequate.  So keep an eye on Logan and see how often he “flashes” above-average potential.

– Is the defensive improvement an aberration, or has Davis figured a few things out?  A lot of people are claiming the Eagles have turned a corner of defense…I’m not so sure.  They’ve benefited from facing some very bad offenses recently (Giants twice, Bucs). Of course, you can only beat who you play, so we can’t write the performances off entirely, but it’s something to keep an mind.  Unfortunately (for an answer, not for the Eagles), Oakland isn’t a very good offense either.  They’ve looked a bit more dangerous with Pryor under center, but they still rank 28th overall in DVOA (Football Outsiders).  In particular, the Raiders’ passing game has struggled (30th by DVOA).  So, if the Eagles really have improved on defense, they should have another strong game today.  However, even if they do, we should probably still be skeptical.

– What is Chip Kelly’s strategic philosophy?  I thought he’d be more “aggressive”, making higher-risk calls when the associated return warranted it (think optimizing expected points).  I also thought he’d be more aggressive on 4th downs.  That hasn’t really panned out, but we don’t know exactly why.  My guess is that if he had “his guy” at QB, we’d see a lot more of that stuff.  This team’s got a lot of weaknesses, and it’s possible Chip just doesn’t trust it enough to execute.  Or, I and many others just misread Kelly and he’ll be much more conventional when it comes to strategic decisions than I’d hoped.  This question, in particular, will not be answerable for quite some time. However, it’s arguably the most important one I’ve posed here, so we’ve got to look for hints of an answer every game.

I’ll leave it there for now.  As far as the game goes, I think it’s simple, if Foles can split the difference between his performances against the Bucs and Cowboys, the Eagles win.  If he’s worse, they lose, barring a corresponding bad game from Pryor.  Meanwhile, the Cowboys play the Vikings, so a loss today for the Eagles will probably leave them 2 games out of the division race.

Nick Foles: Information assimilation

I was hoping to make this post about the equation I drew up earlier, particularly how to think about assimilating new information into the model.  Given this week’s Eagles scenario, though, I think it’ll be helpful to apply similar thinking to a real world example first, then go back to the model.

The “real world” example is, of course, Nick Foles.

His last start was terrible.  He looked completely overmatched and showed none of the strengths we had previously seen him use (pocket presence and accuracy in particular).  That’s not really up for debate.  However, there’s a BIG difference between knowing that information and using that information.  The issue is, what does this performance tell us about Nick Foles’ skill/ability in general?

To answer that with any confidence, we have to frame it correctly.  That means using ALL of our information, not just last game.  For example, here’s a chart that shows Nick Foles’ passer rating by game.  I’ve only included games in which he had at least 10 pass attempts.

Screen Shot 2013-11-01 at 10.04.46 AM

What do we see?

– Well most shocking to me is that the Cowboys game wasn’t actually Foles’ worst game (by passer rating).

– The sample size (look at the X-axis labels) is still very small.  He’s only seen significant time in 10 games.  That means, regardless of what you think his performance to date says, you shouldn’t have that much confidence in it.

When put in context, last week looks like an extreme outlier.  This is why it’s important to view everything together, rather than focus on one particular event.

Insert Passer Rating disclaimer here.

So we’ve got a general idea of the larger picture.  Now let’s take a sightly different approach.  First, let’s use what we KNEW about Foles BEFORE the Cowboys game to see just how likely the Cowboys result was.  Caution: Extremely over-simplified statistical analysis here.  It’s illustrative, not definitive.  There are definitely some more robust tools we can apply and some data adjustments we can make to increase confidence, but that’s a post for another day.  Apologies in advance to the statisticians out there.

Prior to that game, Foles career Passer Rating was 87.13.  Let’s assume, for a moment, that 87.13 is Foles’ “true” ability.  It probably isn’t (small sample), but IF IT IS, we want to know how likely the Cowboys game result was.  To do that, we’ll need not just his rating, but the standard deviation as well, which for Foles, was 27.03.

Given those to pieces of information, and assuming a Normal distribution (not necessarily a safe assumption) of potential outcomes, we can calculate what the odds were of Foles performing that badly.  Now, this doesn’t account for defensive strength, but I’m trying to keep things relatively simple.

In a Normal distribution, roughly 68% of the data will fall within one standard deviation of the mean.

Here, the mean is 87.13, so we would expect, if that’s Foles “true” ability, that 68% of his starts would result in a Passer Rating between 60 and 114 (rounded).

Now, Foles ended the Cowboys game with a Rating of 46.2, which is roughly 1.5 standard deviations (27.03) away from the mean (87.13).  1.5 is the Z-Score.

Cutting to the chase, that tells us that, given our assumptions, the odds of Foles performing that poorly against the Cowboys was just 6.5%.

We can’t stop there, of course.  Just getting the result isn’t enough.  We then have to go back and view the observed outcome in light of its probability and our assumptions.  Basically, there are two ways of viewing this:

– Foles performance was a result of random chance.  Given what we knew, he had a 6.5% chance of playing that poorly, and it just happened to hit.

OR

– Our initial assumption was wrong.  Foles’ “true” Rating is worse than 87, which means the likelihood of him playing that poorly was actually higher (potentially much higher) than 6.5%.  This one is attractive, because it let’s us increase the odds of occurrence for the event we witnessed.

I’m not yet ready to answer that question, but this is the real crux of the post, and the overall point I am trying to make.  If you actually want to KNOW what’s going on, you have to examine all of the information, and try to reconcile it.  Most fans, of course, have no interest in doing this.  They’ll trust their “gut”, which usually results in them using the most recent event and discarding almost everything else.  Think about the euphoria after the Bucs game.  If you go back to the chart at the top of the post, it’s clear that was an outlier as well, though it was part of the overall uptrend and not as serious as the Cowboys game.

A big part of objective analysis is accepting that there’s usually a real chance that you’re wrong.  In this example, we can view this from both sides.  Foles supporters, while pointing to the “bad luck” explanation, HAVE to accept that fact that the second explanation, “bad Foles”, may be true.  Similarly, Foles detractors can point to the “bad Foles” explanation and use the Cowboys game as proof that the Foles supporter were wrong.  However, they too must recognize the potential validity of the alternative explanation.  It’s possible (6.5% in our basic analysis), that it was simply a bad game.

Reconciling those two sides is mandatory for anyone try to learn the truth.  As I tried to explain in the short disclaimer above, the example I used was extremely simplistic.  It doesn’t account for things like quality of competition, potential for improvement, etc.   There’s also the Normal distribution assumption and the small sample issue.  There are things we can do to address a lot of those problems, I just didn’t have time to do it all for today’s post.

Going back to the larger topic of Information Assimilation, hopefully you can see how this type of analysis can be applied to the R value in our equation.  And for anyone still skeptical as to the applicability of that model, I give you this:

Screen Shot 2013-11-01 at 11.30.04 AM

Look at the score by quarter and tell me E = R ((60 – T) / 60) + C isn’t important.