FA thoughts and the 2010 2nd Round

Was asked to post the 2010 2nd round table, so here it is.  Still waiting for FA news.  I think it’s best to ignore the “rumors”, hence no speculation here.  In general though, my FA plan would be:

– Add depth (everywhere) with low-priced veterans on 1-2 year deals.

– Add a NT. Doesn’t have to be a great one (not many of those in the NFL), but a huge need if the team is moving to a 3-4.  This wouldn’t preclude taking one in the draft, but even then you need a back-up and it would be nice to not be overly reliant on Dixon.

– MAYBE add one marquee guy, as long as he is relatively young (<26-27).  Plenty of cap space, so if the team loves a guy like Smith or Long then take a shot.  Key is to pick the one they really like and let the others go.

– Don’t tie up cap space beyond this year.  This is a massive transition for the Eagles, and the fact is that Howie/Chip themselves don’t know how it’s going to shake out.  They key is to bolster the roster while maintaining cap flexibility for the next couple years.  With so many moving parts, it’s impossible to say who fits and who doesn’t, so throwing big money around is very risky.

Conversely, if you preserve space until the rest of the foundation is together, you have a much clearer picture of where your needs are and which impact FAs fit the team best.

Patience is the key, though it remains to be seen if the Eagles new front office has any.

Oh, and I wouldn’t consider, even for a moment, giving up the #4 pick for Revis.

Now the 2010 draft table:Screen Shot 2013-03-12 at 1.17.08 PM

As noted by a commenter yesterday, TJ Ward has had a pretty good start to his career and was drafted 1 spot after Nate Allen.  This system has Ward as one of the biggest reaches; he had one of the lowest included prospect ratings.

– Taylor Mays presents an interesting case.  His aggregate scouting rating was pretty good, hence the high rating here.  However, I remember a LOT of commentators downgrading him.  He may be a good case of why the system needs more sets of ratings.  My guess is there were a lot or scouts who did not score him as highly as ESPN or NFL.com.

– Torell Troup looks like a big mistake by the Bills, though injuries have wrecked his career, so its hard to judge him.  It’s worth noting that Terrance Cody and Linval Joseph were both ranked significantly higher and available at the Bills pick.

– Regarding Cody (since he came up yesterday as well), he’s been pretty inconsistent, and was supplanted by Kemoeatu in the starting line-up, but PFF actually graded him better last year than Kemoeatu.

Also, I realized I didn’t do a good job of showing the big picture.  No individual player’s ranking will be perfect in any system.  The goal is to create a system that, overall, does a better job of valuing players.  Here is a table showing the actual first round of 2010 with the PVM top 32.  We’ll delve deeper into this type of comparison some other time, for now you can analyze/compare them and make up your own mind.

Screen Shot 2013-03-12 at 1.48.50 PM

One last note:  This system is by no means a finished product.  To that end, if you have an idea for improving it, please let me know.  No pride of ownership here, I just want to create the best system possible.

Revisiting the 2010 NFL Draft with PVM Multiplier

As of this writing, the Eagles haven’t made any FA news, so I’ll continue with our draft talk. Today we will look at the 2010 NFL Draft (B-Graham year).  For those of you who noticed, I’ve skipped 2011 for two reasons:  2010 is more interesting, and I can only find 1 set of prospect ratings for 2011.

I haven’t really emphasized this yet, but a MAJOR part of the PVM ranking system is the consensus prospect ratings.  The average rating is far more important than the PVM adjustment.  As a result, if I have only one set of ratings the rankings will not be nearly as valuable.  To that end, if any of you know where I can find 2011 prospect grades/ratings (numerical), please either email me, tweet me, or respond via comments.  I still hope to find another set to work with (right now I only have ESPN’s).

In the meantime, here are the top 32 prospects for 2010 via the PVM system.  For these, I used ESPN and NFL.com ratings, though the NFL.com ratings had to be adjusted to a 100 points scale.  Remember, the right-most column is the player’s actual draft pick minus his PVM Rank.  So players with a negative number were drafted HIGHER than their PVM Ranking.  Only players chosen in the top 2 rounds are included in the analysis.Screen Shot 2013-03-11 at 2.51.20 PM

I’ll break this down so it’s easier to see in a second, but a couple of big notes first:

– Jimmy Clausen shoots WAY up the board.  While the PVM adjustment helped, this is mainly due to the fact that his average rating was 92.27.

– CJ Spiller jumps into the top 5.

– Brandon Graham, regardless of the trade involved, appears to have been taken right where he should have.  However, both JPP and Derrick Morgan rank higher and were on the board when the Eagles picked.

To be fair, all three players were taken by the 16th pick (Eagles originally has the 24th), so had the team not traded up there was a strong chance they would not have been able to choose any of them.

– The biggest “overdraft” in the top ten belongs to Rolando McClain, narrowly beating Trent Williams.  Needless to say I feel pretty good about the PVM system here…

Now let’s take a narrower look.  Here are the most OVERDRAFTED:Screen Shot 2013-03-11 at 3.01.15 PM

Really like this one for obvious reasons.

– Tyson Alualu and Tim Tebow stand out as the worst “value” picks in the first round.  Tebow, even with the positional impact bump, rated as the 44th prospect (he was taken 25th).  The Jaguars, picking Aluala, were derided (correctly) at the time.  If I remember correctly, the Jags justified it by saying he was the best guy on their board.  However, it was pretty clear at the time that they could have traded down and still got him.

It’s a valuable reminder that there is a lot more to “winning the draft” than just setting your board more accurately than other teams (better scouting).  As I’ve explained, the “skill” portion of the draft involves moving around so you get the guys you like at draft spots where they offer maximum value.

– Nate Allen’s here as well, drafted 12 spots ahead of where the PVM ranking has him.  This was a 100% “need pick” and clearly hasn’t worked out the way the Eagles hoped.

– Conversely, Anthony Davis has worked out for the 49ers, despite being taken 12 spots ahead of where he was ranked.

One big note here that, although obvious, I feel compelled to explain:  Every team will have their own individual position values, which means each team’s PVM Board (if they made one) will look different from the one above.  For that reason, it’s tough to grade teams on individual picks because we don’t know what their internal positional ratings are.  It’s possible that the 49ers place a higher premium on OT than the rest of the league (likely in fact).  In that scenario, their PVM board (with no regard for scouting), may have had Anthony Davis (and Iupati) ranked higher, which might justify taking both OL well ahead of their rankings above.

Prior to this year’s draft, I hope to compile individual PVM ratings for each team.  It will probably be very “noisy” due to various contract issues, but it also might help us infer what teams might do.  Perhaps I’ll even put an “ideal” mock draft up, showing what each team should do with their picks under this system.

Now back to 2010.  Here are the most UNDERDRAFTED players:Screen Shot 2013-03-11 at 3.30.30 PM

Some BIG hits here as well as some BIG misses.

– Clausen I mentioned above.  Though he appears to be a miss, the idea here is that at the time of the draft, his potential upside warranted a much higher draft choice than 48 overall.  That said, it’s conceivable that he has just been lost behind Cam Newton and can still be a productive player on the right team (though I’m not holding my breath).

– Sean Lee and Dez Bryant both fly up the board here.  Bryant ranked #10 overall by PVM.

– At the bottom of that chart we can see JPP and Derrick Morgan, who both ranked as top 10 prospects by PVM.

– Charles Brown jumps a full round by PVM, though it’s still unclear how his career will pan out (injured his knee this year).

– Terrence Cody and Sergio Kindle both rank high, and coincidentally or not, were both selected by the Ravens.  Though neither player has played up to their projections, it’s interesting to note the Ravens’ multiple selections. I’ll be keeping my eye on which teams show up more/less on the over/under-draft lists.  In theory, teams that are applying a system of this type should find their way onto the under list with some frequency.

That’s all for today.  Hopefully we’ll have some Eagles FA news to discuss soon.  Again, if anyone knows anywhere to get past prospect rankings, please let me know.


Applying PVM to 2012 Draft

Yesterday I unveiled the Positional Draft Multiplier (“PVM”), an attempt to adjust prospect rankings by relative positional importance.  If you haven’t yet read that post, I encourage you to do that before continuing here.

While I won’t re-explain the entire process here, I will say that, in essence, the PVM uses the consensus prospect rankings and adds an “impact bonus”, the size of which varies by position.  For example, QBs have a much bigger impact on games than Centers do, so the bonus for QBs is bigger.

Today, I’ll apply the system to last year’s draft.  Please note that this will not be a direct comparison to this year’s rankings, due to the fact that I can’t find NFP’s ratings for last year.  For today’s post, I’ve only used ESPN and NFL.com’s ratings to arrive at the “consensus rating”.  Also, it’s obviously too early to judge any of these players, so while I think the below tables will be interesting, their full value won’t be apparent until at least next year.  I hope to go back a few more years with the same analysis next week.

First, here are last year’s prospect rankings re-ordered according to PVM Rating (only players drafted in the top 2 rounds were included).  The right-most column is the difference between the player’s PVM ranking and actual draft spot.  I’ve calculated it so that a positive number means the player was UNDERDRAFTED according to the system (so positive means a “steal”).  A negative number means the player was a reach.

To reiterate, this isn’t meant to be a ranking according to which players are best or most likely to pan out, just a better measure of potential Risk vs. Reward.

Screen Shot 2013-03-08 at 10.53.25 AMScreen Shot 2013-03-08 at 11.05.19 AM

Take some time to look through those tables, there’s plenty of info there.  Actually very little change in the top ten, with the only big shifts resulting from Mark Barron and Stephen Gilmore falling.  Fletcher Cox appears to have been a good value pick by the Eagles, taken 3 spots later than his PVM Rank suggested.

To make things a bit clearer, below are two tables illustrating which players were most under/over drafted.

Let’s start with the good:Screen Shot 2013-03-08 at 11.09.03 AM

No surprise to see a QB at the top of the list.  Due to the structure of the system, QBs receive, by far, the most benefit.  However, note that on an absolute basis, the scout’s ratings still count for much more.

Notables-

– Lavonte David jumps out immediately.  According to PVM, he should have been the 38th overall prospect, but fell to the 58th pick and ended up having a superb rookie year.

– Vinny Curry makes an appearance high on the list, falling 19 spots from his PVM Ranking.  Let’s hope Chip Kelly finds a way to realize the potential most scouts think he has.

– Cordy Glenn, though not widely known, had a good rookie year as well, ranking as the #31 overall OT for 2012 by Pro Football Focus.  #31 might not sound great, but remember there are 64 starting OTs in the league.  To be better than half of them in your first year is a good sign.

– Kelechi Osemele was ranked #36 overall by PFF, ahead of more famous players like Jake Long, Michael Oher, and Jermon Bushrod.

Now for the bad:

Screen Shot 2013-03-08 at 11.25.58 AM

Bruce Irvin leads the pack by a longshot, drafted 39 spots ahead of his PVM Ranking.  While he did record 8 sacks (ESPN), impressive for a rookie, he was weak against the run and received a negative grade overall by PFF.

– Derek Wolfe had a similar rookie year, though he was strong against the run and weak against the pass (according to PFF).  Overall, PFF has him as the 54th overall 4-3 DE.

– A.J. Jenkins might be the most anonymous first rounder in last year’s class.  Be honest, did you know anything about him prior to seeing him in the table?  Yes, he played for a great team, but he couldn’t even get on the field and registered ZERO catches.  Obviously, he’s got plenty of time to turn his career around, but it’s safe to say if the 49ers had a do-over, they wouldn’t repeat that pick.

– Mychal Kendricks shows up here, though a 10 pick difference that late in the draft isn’t that surprising.  However, if you look closely you’ll see Dont’a Hightower, while also over drafted, was ranked significantly higher than Kendricks by PVM.  For what it’s worth, PFF had Hightower as the 8th overall 4-3 OLB….Kendricks ranked 42nd.  (Lavonte David was #5)

As I said in the beginning, it’s way to early to judge last year’s draft class.  I hope to do this same post with several other draft classes (provided I can find pre-draft ratings to use).  While the PVM Ranking is interesting, and I believe is has a lot of value, the overarching theory I want to advance is:

When teams go against the prevailing wisdom in the draft (consensus ratings), they are wrong much more often than they are right.

So the big question is, can we, without any particular scouting insight, use only consensus ratings and logical adjustments (like positional value) to come up with a rankings system that is as good or better than average team’s proprietary board?  I think we can (though it obviously won’t be easy).

Prospect Rankings via Positional Value Multiplier

Today, with the help of a collaborator, I’ll give you prospect rankings for the NFL Draft that you won’t find anywhere else.  As I’ve explained before, I am not a scout and have not watched film on every top prospect in this year’s draft. However, I believe what I’ll show you today is more useful than any individual scout’s ranking.

First things first, big thanks to George Laevsky (JD from Georgetown) for the help.  He came up with the idea and name for the Positional Value Multiplier and worked with me on compiling/computing the necessary data.

To keep this clean, I’ll explain it in 3 sections.  First I’ll tell you what we did, then I’ll tell you how we did it, then I’ll show you the results.  That way, if you want to skip the middle section you can.

What We Did:

The overall aim of this project was to apply a positional value modifier to the consensus prospect rankings, with the hopes of generating a more accurate system of ranking value.  We compiled a composite prospect rating for each player (through the first couple rounds) and then adjusted for positional importance according to last seasons’ league-wide positional salary distribution.

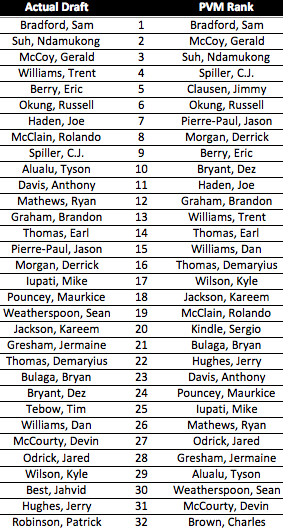
Before we go into the How details, here is the consensus prospect ranking using ratings from Scouts Inc (ESPN), the National Football Post, and NFL.com.  Note: NFP uses a different grading scale, so those scores were adjusted to give us an apples-to-apples rating.

Screen Shot 2013-03-07 at 11.19.43 AMThat graphic alone is pretty interesting, particularly when the ratings diverge (see Ryan Nassib at the bottom), but we’ll look at that some other time.

For today’s post, we have to adjust.

How We Did It:

I mentioned last week that no BPA ranking is complete without an adjustment for relative positional value.  For example (an extreme one), if a QB and K both carry a 95 rating, you’d obviously choose the QB first.  The question is, how do we measure relative importance by position?

While there is no bullet-proof method of doing so, the salary distribution in the NFL is as good a place as any to divine information from.  In theory, since the NFL has a salary cap, the distribution of limited funds between positions will give us an idea of how the league, on average, values different positions in relation to each other.

We pulled salary cap information from this awesome graphic featured in the Guardian at the end of January.  It’s not perfect (reflects cap hits from last season and misses some IR guys), but in general I believe it’s as good a breakdown as any for our purposes today.  After adjusting for the number of players by position, we calculated a Positional Value Multiplier (“PVM”) for each major position (FB, K, P not included).  We then applied that multiplier to the above consensus rankings.

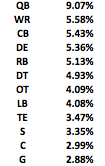
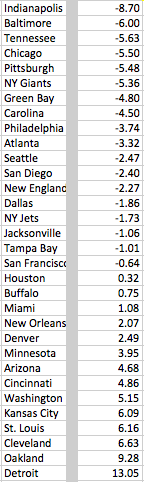
Here are the multiplier values we arrived at, in order from largest to smallest:

Screen Shot 2013-03-07 at 11.26.43 AM

For the most part these make a lot of sense, based on what’s “common knowledge”.  QBs are, by far, the most important position.  However, the relative rankings of WRs and RBs certainly surprised me, though due to the noise in the data, it’s best not to get hung up on the minute differences in values above.  Instead, we can see there are some clear “tiers” (I feel like I am using that term a lot).

Tier 1 – QBs

Tier 2 – WR, CB, DE, RB, DT

Tier 3 – OT, LB, TE, S

Tier 4 – C, G

The only thing in those rankings that immediately draws my attention is the OT position in the 3rd tier.  But that data is what it is, we can debate the reasons later.

Now that we have the PVM values, we can apply it to the prospect rankings.

The Results:

Screen Shot 2013-03-07 at 11.42.44 AM

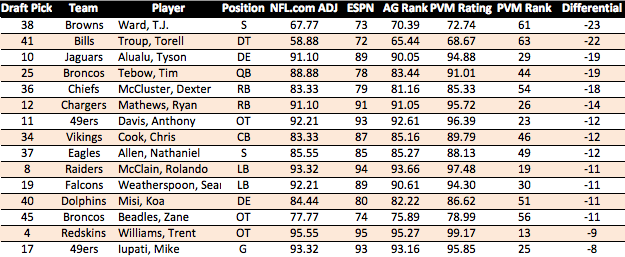
Some very interesting movement.  The right-most column shows the effects of the positional modifier.  The AG Rank column is the pre-adjustment consensus ranking.

Notes:

– Dee Milliner jumps two places to become the top overall prospect.

– Chance Warmack, though he drops 3 spots, remains a top 5 prospect, damaging my belief that a G in the top 15 picks is a very poor decision.

– QBs, as expected, benefit the most.  Geno Smith jumps 11 spots to become a top ten prospect, while Nassib and Barkley move into the middle of the first round.

– The biggest jump overall comes from Tyler Wilson (20 spots), who moves from the middle of the second round to the end of the first.

– Zach Ertz (TE) and Jonathan Cyprien (S) are hurt the most, falling out of the first round, and therefore off the chart above.

One last thing: I want to be perfectly clear about the value of this analysis.  The idea here is that BPA is an overly simplistic and flawed method of drafting by its current definition.  For example, while Geno Smith (19th consensus) may be a worse prospect than Kenny Vaccaro (9th consensus), with lower odds of success, the potential payoff is so much greater for Smith that he becomes a better choice (at least as shown here).  Hitting on a QB offers a MUCH greater reward than hitting on a S (or really any other position), so it makes complete sense that QBs are perennially “over-drafted”.

In essence, what we are showing here is that they are not, in fact, “over-drafted”.  Yes, they might have greater odds of failure, but that does not make them bad picks.  Remember, you have to look at both Risk AND Reward, balancing the two.  The above rankings is an effort to do that in a method as simple and transparent as possible.

Over the past few months, I’ve tried to advance the idea that the “consensus” forecast should carry a large degree of inertia within NFL front offices.  Imagine the above rankings as equivalent to a total market stock index.  For anyone going against the total market index, they must believe VERY STRONGLY that they have better information or better analysis than the rest of the market.  It should function in much the same way in the NFL (and all professional sports leagues).  The idea is NOT that teams should blindly follow the “market”, just that they should hold their own evaluations up to very high scrutiny before acting on them, especially when they largely conflict with available data.

I’ll be examining this in a lot more detail, which may or may not lead to more posts on the subject.  In any case, this should give everyone something to think about come draft day.

For what it’s worth, my subjective pick for the Eagles would still be Lotulelei/Joeckel.  However, unless I adjust the PVM formula (or if the consensus ratings change), it looks like Dee Millner is now, objectively, in the lead.

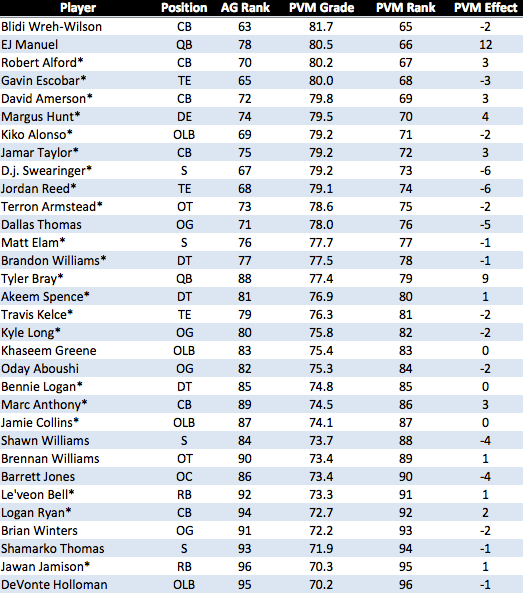
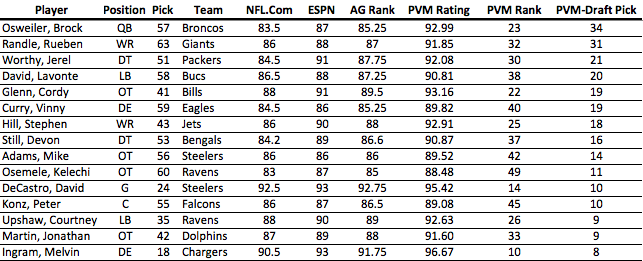
UPDATED: Also, below is the same analysis for the rest of the players we looked at:

Screen Shot 2013-03-07 at 3.06.03 PM

Screen Shot 2013-03-07 at 3.08.36 PM


How often do “Can’t Miss” prospects miss?

I previously stated that “no prospect is risk-free”.  Today we’ll look into just what that means.

The Data:

I went back through every draft from 2005-2011 and compiled the Scouts Inc. grades on each player taken in the first round.  According to the Scouts Inc. grading scale, any prospect with a 90+ grade projects as a potential “elite player”.  Recognizing that 10 points on a 100 point scale is a pretty big range, I will only look at prospects rated 95 or better.  Theoretically, these players should be the absolute best of the “elite” prospects and should carry a very low miss rate.  We’ll look at each rating and assign players to 1 of 3 categories:  Hit (Those who can be considered elite players), Bust (completely non-productive players), and everyone else.  Forewarning, I’m going to err on the positive side but feel free to assign your own if you disagree.  At the end, we’ll total up the categories and see what happens.

Note: These types of breakdowns typically devolve into parsing Hits/Busts, as everyone will have their own opinions on which players belong in which categories.  This is not my goal.  My hope is that while there will be disagreements over a few of the ratings, the overall numbers will provide useful insight.  Remember, this is not an individual player analysis, it’s an attempt to draw insight into the broader “elite prospect” pool.  One or two ratings changes won’t matter that much.

Also, we are much more interested in the “Busts”, so moving players from “Hits” to “Everyone Else” or vice-versa doesn’t really effect what we are looking at.

The 99s:

We’ll begin with the absolute best, those players receiving a 99 pre-draft grade.  Here they are:

Screen Shot 2013-03-05 at 3.57.01 PM

Hits: Aaron Rodgers, Calvin Johnson, Andrew Luck (a bit early but remember we’re being generous).

Busts: None

The 98s: 

Screen Shot 2013-03-05 at 4.12.37 PM

Hits: Ferguson, Thomas, Peterson, Jake Long (on the edge due to last year), Matt Ryan, Gerald McCoy

Busts: Adam Jones, JaMarcus Russell, Matt Leinart

The 97s:

Screen Shot 2013-03-05 at 4.18.24 PM

Hits: Suh, Von Miller, A.J. Green, Patrick Peterson, RG3, Marcell Dareus

Busts: Mike Williams, Brady Quinn, Jason Smith, Curry

The 96s:

Screen Shot 2013-03-05 at 4.30.11 PM

Hits: Ngata, Keuckly

Busts: Sims, Quinn, Rivers, Gabbert, Maybin

The 95s:

Screen Shot 2013-03-05 at 4.37.02 PM

Hits: Merriman (was elite while on roids, so i guess that counts), Willis, Revis, Earl Thomas (ugh)

Busts: Travis Johnson, David Pollack, Alex Barron, Jamaal Anderson, Amobi Okoye, Derrick Harvey

The Totals:

The 99s:  Hits – 3/5, Busts – 0

The 98s: Hits – 6/14, Busts – 3/14

The 97s: Hits – 6/21. Busts – 3 4/23

The 96s: Hits – 2/21. Busts – 4 5/21

The 95s: Hits – 4/30, Busts – 6/30

In looking at those totals, it’s clear that there is actually a difference in success odds for each discrete rating, which really surprises me (though it’s hardly enough data to confirm). In general, there is a clear decrease in Hit odds and corresponding increase in Bust odds as you move from 99 to 95.

However, it also clearly shows what I was originally hoping to illustrate: There is no such thing as a risk-free prospect.  I realize that none of the 99s rated as busts, but since there are only 5 of them, and given the Edwards and Bush careers, I think its safe to say we will see a 99 bust at some point.

In total there were 93 prospects included that rated 95 or better.  Of these, I rated 16 18 as Busts, or 19.35%.

So examining the absolute best of the best prospects, almost 20% of them end up busting.     I realize this is a very subjective breakdown, but even with a few changes either way, the overarching point remains, even the best prospects have a significant chance of complete failure.

Round 2: Luck vs. Skill in the NFL Draft

Round 1 looked at historical draft performance and persistence based purely on total production as defined by CarAv.  Today we’ll make an adjustment to the model and rerun the analysis to see if anything changes.

For reference, Round 1 found absolutely no correlation in team performance from one year to the next.

The adjustment for round 2 is accounting for draft position. Using the default NFL Draft Chart, I assigned a draft points value to every player selected from 1999-2009.  I then summed up the total draft points used by each team each year, and divided that number by the total CarAv to arrive at a Points per CarAv value, which I then used to rank teams each year.

This should sound very familiar, as it is similar to the method I used in our first draft performance ranking.  However, while that analysis looked at best performance over the whole length of time, this is only concerned with performance each individual year.  As such, we don’t have to adjust for the cumulative nature of CarAv, so the rankings are a bit different.

Before we start parsing the results, here is the new ranking:Screen Shot 2013-02-26 at 12.48.19 PM

This one definitely passes the eye test.  At the top of the board are Indy, Baltimore, Green Bay, Pittsburgh, and the Giants.  Notice anything in common?

Meanwhile, at the bottom of the board are Detroit, Oakland, Cleveland, and Arizona.

So before digging in, it appears to be a reasonable ranking according to what we know of each team’s performance.

The Caveat – Using this system accounts for teams that perennially pick at the end of the draft (or the beginning), that way a team like the Patriots doesn’t get penalized for not finding similar quality players as a team like Cleveland, which, on average, picks much higher in the draft.  However, using the NFL Draft Value Chart does have a drawback.  The  chart is HEAVILY skewed towards the top of the first round.  For instance, the #1 pick is worth 3,000 points while the last pick in the draft is worth just 2.  The upshot is that using it to adjust for team draft position skews the results in favor of teams who do not have a lot of Draft Points (i.e. good teams that don’t pick high in the draft or teams that don’t have 1st round picks).  This is an area that I will try to adjust for in a future analysis.

Luck vs. Skill – Remember that if the draft is mostly skill, there should be positive correlation between team performance one year and the next.  How much correlation? That’s up for serious debate.  Regardless, here is the chart followed by the correlation value:Screen Shot 2013-02-26 at 1.02.14 PM

Doesn’t look like much, so I added a trendline to make it clearer.  The value is .167.  Not huge, but significant, and certainly a different story from the last look, which showed no connection.

If we take a step back, this comes out where I imagined the luck vs. skill argument to be when I started the original analysis.  I believe that there is obviously skill involved in the draft, but that luck is far more determinant of team success in this area of the NFL.  In general, my theory is that GM skill is illustrated by moving around the draft to maximize value/odds, and not necessarily in selecting players.  A lot more to do to support that, but I think this analysis is a step in the right direction.

Other notes from the analysis:

– It should come as no surprise that, according to this analysis, the Eagles 2002 draft remains its best.  Overall, the team’s average ranking over the subject time period was 15th.

– The Eagles were one of the most schizophrenic teams when it comes to draft performance, with a more volatile ranking than all but 3 teams (Jets, Miami, and Denver). The Broncos were least consistent.

– By this measure, the Eagles worst draft during the Andy Reid Era was 2003, when the team spent 26.71 draft points per CarAv.  For comparison, in 2002 (best draft), the team spent just 6.15 draft points per CarAv.  For those who don’t remember, 2003 was the Jerome McDougle, L.J. Smith draft.

– Over the subject timeframe, the Eagles have spent 3.74 draft points LESS than the league average per CarAV, which ranks 9th best in the league. (Chart below)

– The Colts spent 8.70 LESS draft points per CarAV than league average, while the Lions spent 13.05 points MORE than league average…

– The Detroit Lions have been shockingly inept when it comes to the draft.  The teams average ranking is 26th, but for a clearer illustration, here are the Lions 1st round picks from 1999-2009:

Screen Shot 2013-02-26 at 1.18.30 PM


Remember the post on how important it is to hit in the first round?  Needless to say, the Lions blew it…repeatedly.  To be fair, the team’s most recent #1s look OK (Suh, Fairley)…if you forget about Jahvid Best.

– The Patriots have fallen off dramatically.  From 1999-2003 the team’s average ranking was 10.6.  From 2004-2009 its average ranking jumped to 19.

– While the above analysis looked at average ranking, here is a chart showing performance over the whole time period, as defined by average draft points per CarAV minus league average. (So average team performance versus league average). Negative numbers = better performance.

Screen Shot 2013-02-26 at 1.46.47 PM

There’s a lot more I can do now that I’ve put the information together (which took much longer than I expected).  So expect to see a few more points from this analysis.

Overall, the evidence still stands heavily in luck’s corner in its fight with skill for the soul of the NFL Draft, though it’s fair to say skill has landed a couple jabs.


Luck vs. Skill in the NFL Draft

Today I’m going to take a shot at divining the relative importance of luck versus skill in the NFL draft.  This is a complicated subject, and as such I’ll probably try a few different methods over the next few weeks.

Before I get started, I’d like to note that this is a different analysis than the previous draft performance evaluation I did.  Whereas that attempted to grade teams according to how efficiently they used draft resources, this breakdown is purely about maximizing production.

Ranking the teams:

The first step I took was to go back through each draft and rank team performance each year.  I used the Pro-football-reference.com CarAV stat to gauge individual player production, then added each to get a measure of every team’s draft class by year.  I then ranked each team according to that production for each year and used those rankings to arrive at an average draft performance ranking.  This table should make things a bit clearer:

Screen Shot 2013-02-22 at 2.56.22 PM

I know it’s tough to see, but those with good eyesight will find annual draft rankings for each team from 1999-2009.  The one big note here is that the CarAv numbers do not include this year’s statistics (I haven’t updated my database yet).  So players who broke-out this year will not be fully accounted for.  Also, this does not account for different numbers of draft picks, so teams that trade picks for players will be undercounted here.  This is ONLY a measure of total production.

As you can hopefully see, the Eagles performed quite well by this measure (as they did in our other draft analysis).  Here the team is ranked 8th with an average ranking of 14th.  The team’s best draft came in 2002, when the Eagles ranked 1st overall (the Brown, Sheppard, Lewis, Westbrook draft).

Other strong years for the Eagles were 2005, when they ranked 3rd overall (Patterson, Herremans, Cole) and 2009 when the team ranked 5th (Shady, Maclin).

Low points for the Eagles were 2003 and 2004 (ranked 28th and 30th).

Also, notice Super Bowl winners Green Bay, Indy, Baltimore, NYG, and Pittsburgh all placed in the top ten.

FYI, if you are examining the chart, you shouldn’t get too hung up on the 2009 rankings (or even 2008), as those are most subject to change once I add this year’s data.

Luck Vs. Skill:

Now that we have annual rankings, we can look to see if performing well one year gives any indication of performing well the following year.  If the draft is mostly skill, then those front offices that are “good” at drafting should be consistently ranked towards the top, with “bad” drafters consistently at the bottom.  Theoretically we’d see less consistency among the “bad” drafters since presumably being bad would lead either a change in strategy or a change in decision-makers.

The are some obvious caveats before I get to the numbers.  I did not account for changes in front office personnel.  The CarAv measure is far from perfect, as we’ve discussed before, so the rankings are bit subjective.  Additionally, not every team is trying to maximize production.  Some use draft picks to fill roster holes, so judging teams by player production doesn’t give them credit if they have other goals in mind (whether they should have any goal besides maximizing production is another story).

Below is the chart, but let me make something abundantly clear before I show it to you.  I AM NOT SUGGESTING THE DRAFT IS COMPLETELY LUCK.  As I just mentioned, there are a lot of caveats to this type of breakdown.  Also, as I said at the top, there are a number of different ways to look at the subject, so we can’t jump to conclusions from just one.

Still…

Screen Shot 2013-02-22 at 3.27.07 PM

Pretty much the definition of no relationship.

I also looked at multi-year averages in an attempt to get rid of some of the noise caused by a random bad/good year.  Below is the same chart, using average rankings from 99-01, 02-04,05-07,08-09 instead of individual years.

Screen Shot 2013-02-22 at 3.51.39 PM

Yet again, nothing there.

Again, this doesn’t mean there is NO skill in drafting, it’s just a starting point that suggests there MIGHT BE a lot of luck (and certainly a lot more than GMs would like people to think).  I’m going to try to account for some of the holes and weaknesses in this analysis, and I’ll repost when I finish.  There is a lot of potential noise here.

One more chart:Screen Shot 2013-02-22 at 4.19.17 PM

This is the frequency chart of our rankings.  Sure looks a bit Normal doesn’t it? (Normal=random).  The standard deviation is 3.37, meaning if it’s normally distributed we would expect about 68% of the values to be between 13-19 (inclusive).  In our table, 22 out of 32 are within that range….or 68.75%.

Additionally, we’d expect 95% of the values to fall within 2 standard deviations (outside the 10-22 range in our table).  We have 30/32…or 93.75%.

What this means (I could be wrong, I’m not a statistician) is that if luck was the sole determining factor for the draft performance rankings, you’d get a distribution that looks A LOT like the one we see above.

Lot’s more to do on this subject, but for now its Luck 1 – Skill 0.

Persistence of sacks

Yesterday I mentioned that sack differential and turnover differential have a similar correlation to winning.  However, I also said that despite the relatively equal importance of both, teams should focus more on the sack numbers, as that measure is likely much less random (luck-based).  Today I wanted to illustrate that:

First we’ll look at the persistence of both sack differential and turnovers.  We’ll run the same correlation analysis as we have previously done, this time looking at whether one year’s data point is related to the corresponding data point the following year.  If the value is high (absolute value), then the measure is less random, whereas if there is no correlation then it is largely determined by chance (luck).

Here is the chart for sack differential, remember the data set comprises the last 10 seasons for all 32 teams. Note that in this analysis I have not used 2012/2013 pairs because, obviously, that data doesn’t yet exist.  The Y-axis is sack differential one year, the X-axis is sack differential the following year.

Screen Shot 2013-02-20 at 10.07.43 AM

I’ve included the trend line because without it it’s tough to see the relationship.  The correlation value is .29.  Not huge, but significant.  However, by itself it doesn’t tell us too much.  We’ll look at turnover differential persistence now, then we can compare the two.

Screen Shot 2013-02-20 at 10.12.59 AM

The value here is .11.  So there is some persistence here, but not nearly as much as we saw in the sack differential.  This tells us that although both turnovers and sacks are very important when it comes to winning, sacks are much less luck-based, meaning there is a lot more teams can do to effect the measure.  Given the choice, teams should look to improve line-play over trying to force/prevent turnovers. (I realize they’re not mutually exclusive concepts, we’re operating in a vacuum here).

A common theme in this blog is how important the efficient allocation of limited resources is when it comes to putting together a football team.  It’s vital that teams understand what is luck and what isn’t, so they know where to focus their efforts in order to maximize the impact of those efforts.

I’m assuming little of this is very surprising to readers here.  We can, however, take the analysis one step further.  Sack differential (and turnover differential) includes both offensive and defensive numbers.  What happens if we break them out?

I looked at both sacks and sacks allowed, to see if there was a noticeable difference in persistence.  First the charts, then the numbers, then interpretation.

Screen Shot 2013-02-20 at 10.25.11 AM

Screen Shot 2013-02-20 at 10.26.55 AM

Here are the values:

Sacks: .23

Sacks Allowed: .38

I don’t know about you, but I’m a bit surprised at how large the difference is.  There are a TON of variables to consider here.  Both sacks and sacks allowed can be greatly effected by the QB, scheme, line-play, schedule, etc…  Regardless, the above analysis shows that teams appear to have much greater control over how many sacks they allow as compared to how many sacks they create.  This makes some sense, in that the offense has control of every potential sack situation (QBs have a lot more control than defensive players by virtue of having the ball and being able to throw it away.)

In yesterday’s post, I talked about looking at LOS play as a continuum, rather than viewing the OL and DL as discrete units.  If we continue with that train of thought, and apply the above analysis, it certainly appears as though teams should pay more attention to the OL than the DL.  The goal of preventing sacks on offense is much easier to achieve than the goal of creating them on defense.

Therefore, all other things being equal, I’d much rather have a great OL than a great DL.  This has obvious implications for the Eagles.  There is a general consensus that the team will be looking at either OT or DT with the #4 pick in the draft.  IMO, the analysis here would support leaning towards the OT.  Note that we’d still have to evaluate it in the context of the Default Draft Strategy card I put together a few weeks back (which we’ll do once all the scouting shakes out).

For general reference, not everything I show will be counterintuitive or incredibly surprising.  I believe it’s important, though, to illustrate concepts that we take for granted or that have a clear logic to them, if for no other reason then to confirm their validity and hopefully get a better sense for their magnitude and/or context.

I’m going to spend most of today and tomorrow in a car, so I probably wont be able to get anything up tomorrow (or respond to comments).  Be back on Friday though.  Please do comment, as I think that’s extremely important for both developing ideas and challenging my assertions.  Not everything I do is right (shocking), but if nobody points it out or argues, I probably won’t realize it.

DRC decision, other thoughts, and a look at Sack Differential

Hope everyone enjoyed the holiday weekend.  I’ve got some random thoughts to get out before they get too stale, followed by a quick look at the importance of sacks:

DRC:  I would have tagged DRC, and it would have been an easy decision.  In my mind, the only possible reason for not doing so is if DRC was actively undermining the coaches.  I know a lot of people have resorted to calling DRC a “locker room cancer” and such, but I just don’t get the sense he was that big of a problem.

Last year the entire team fell apart.  The coaches appeared to be undermining each other. Two were fired midseason and it became clear that the head coach would be let go after the season ended.  Is it really a surprise that this led to a team “quitting” on itself?  I’m not trying to excuse that type of play, but the fact is almost the entire team was guilty, and it’s reasonable to think that in a better atmosphere, DRC will return to somewhat consistent play.

He was very bad for a lot of last year, and clearly is not worth $10.7 million.  However, the Eagles DONT NEED THE CAP SPACE.  It really doesn’t matter how much you’re paying him, since it’s only a one year commitment and it doesn’t preclude the team from doing anything else.  Worst case scenario: he sucks again and is gone after next year.

As it stands, it looks like the Eagles will not bring him back.  That means the team is now looking for an entire starting DB corps.  Maybe in a better line-up Nate Allen is acceptable.  Maybe in a great line-up Kurt Coleman can be covered for.  That still leaves 3 starting spots.  I know Howie has claimed to be fully committed to BPA (best player available) in the draft, but it’s going to be extremely tempting to take someone like Dee Milner.  If that ends up being a reach, then the Eagles have blown a huge opportunity to kick-start the next phase of the franchise.

If they don’t draft Millner (or another top prospect), where is the team going to find 2 starting CBs?  I’ve mentioned before that this is not a 1 year process.  Still, I was hoping the team would use its resources to band-aid a few of the holes it couldn’t fix this offseason.  DRC fits this role perfectly (band-aid).

Draft Watching:  It’s fun to read about all of the draft prospects and compare the “big boards”, but remember, at this point most of it’s useless.  The boards are going to change, some dramatically, so don’t get too caught up in things like “Floyd has passed Star” or “no QB’s are worth 1st round picks”.  We’ll probably get a very different story closer to draft day, after all the interviews are done and teams have done a lot more film work.

I do like looking at the National Football Posts rankings, though.  They claim that their evaluations will not be affected by the combine, only by prospect interviews and character issues from here on in.  They’ve got Nassib ranked #1 overall…(he’s the guy the Eagles likely have their eyes on in the Mike Vick-as-insurance scenario).  If this ranking holds, safe to say he won’t be there for the Eagles in round 2.

When it gets closer to the draft I’ll pull together a “consensus” prospect ranking, and we can use that with our Draft Strategy Chart to look at what the Eagles should do.

Nick Foles:  He will probably be traded.  Again, ignore what the “Eagles sources” are saying.  Given the supposed weakness in this year’s QB draft class, holding on to Foles until draft day and then auctioning him off will maximize his value.  Some team will be desperate for a QB and see their top choice gone.  If things fall the right way, the Eagles can definitely get a 2nd round pick for Foles.  At the very least, he’s should garner a 3rd + a later round pick (and IMO he’s worth a lot more than that).

OG’s in the first round:  I don’t care what Mike Mayock says.  I don’t care if Chance Warmack will immediately be the best guard in football.  Choosing a Guard in the first round is a dramatic misallocation of resources.  The draft is not just about finding prospects who will play.  It’s about maximizing the VALUE of every pick.

Sacks:  This relationship will be fairly obvious, but it’s not a stat I see referenced very often (sack differential). Obviously getting sacked is bad and sacking the other QB is good, but the overall sack differential (sacks-sacks allowed) is HIGHLY correlated with winning.   The only Super Bowl champion in the last 10 years with a negative regular season sack differential were the Ravens this year (-1).  Here is the chart, with Sack Differential on the y-axis (and SB winners in yellow):

Screen Shot 2013-02-19 at 11.22.09 AM

The correlation value is .62, a very big number.  For reference, this is about the same as the value we found for TO margin (.64).  However, I’d argue that sacks differential is MUCH easier to effect than TO margin. (I’ll do a persistence post as a follow-up).  The idea here is to view OL and DL play as more of a continuum rather than discrete units.  Overall, you want to win the LOS (line of scrimmage).  That could mean EITHER allowing fewer sacks on offense or creating more on defense (I’m intentionally ignoring the run game here).  Ideally you will be good at both, but it’s the net effect that we are looking for.

So for example, rather than fixate on either the OL or DL in the draft, the Eagles should take whoever will add the most to EITHER unit.  Right now, NT is a bigger immediate need than anything on the OL, but if the team finds an OT that adds more than the available NT’s, it should draft the OT.  Given the choice between a Great OL/Bad DL combo and a decent OL/DL combo, it may in fact be better to go with the first choice, which runs counter to popular draft strategy.  Teams typically focus on improving weaknesses, when they should focus on BIGGEST IMPACT.  So choosing to take an area of strength and make it dominant (say the 49ers taking an OL) may be a better strategy than trying to go from mediocre to good at another position group.  This is of course all relative (and near impossible to accurately quantify), but it’s more support for taking the BPA rather than need.

The defensive ranking dilema

The last post raised a couple of issues (through the comments and twitter) with the Yards Allowed stat.  Clearly it’s not a perfect measure of defense.  As a result, I am pulling together some other defensive metrics and will run the same analysis, in hopes of shedding some light on the relative importance of defense.

In the meantime though, let’s look at why Yards Allowed is a flawed measure.  Hint: We have a problem we have faced before.  That is, teams that are losing by a lot will throw more often, gaining more yards and distorting the defensive ranking of the winning team.

Before we get to that though, we need to examine just how big the potential problem is.  In my previous post on Pass Play %, I hypothesized that there is some skew, but that when looking at every play run in the NFL every year, relatively few of them are done by teams focused on anything except maximizing points scored, which should minimize the effects on the overall data set.

To get a better look, I put together a new analysis, comparing points scored to the ratio of run/pass yards allowed.  The hypothesis is that teams that score a lot of points will force their opponents to pass more, resulting in a positive correlation between points scored and % of Pass yards allowed.  I expect there to be a positive result, as there’s a pretty logical case for correlation.  The real question is how strong the result is; if it’s weak than my prior statement regarding overall skew effects may still stand, if it’s strong then we have to re-evaluate (and do a lot more work).

Here is the chart.  Note the Y axis is just Pass Yards Allowed/Total Yards Allowed.

Screen Shot 2013-02-15 at 2.05.06 PM

Dammit.   The correlation value is .40, so moderate, but definitely a little higher than I expected.  Unfortunately, this means we’ve got some work to do if we want to remove the noise resulting from this issue, which will be my goal for the next couple weeks, interspersed with other topics for which I’ve found interesting data.

We’ll attack it from two angles.  First, as I mentioned at the top, we can use other defensive metrics that indicate strong defense but aren’t as susceptible to the same problem.

Also, we can try to use a better metric for overall defense.  There are some interesting stats out there on sites like Football Outsiders that we might be able to use.  I’ve got a few in mind but let me know if you have any particular favorites.  Let me caution you though, stats that look really complicated my be subject to over-fitting, which would lead to really powerful results in analyses like the one above but actually tell us very little useful information.

We can also try to create our own, though I’ll only do that if people are really interested.  The idea of a relatively simple stat that incorporates some major defensive measurables sounds intriguing though.  If you’ve seen something like this, let me know so I don’t waste time duplicating it.