Checking the Benchmark: The Eagles are behind, but not by much.

Before the season, I put a 9 win projection on the Eagles team.  I then went through the schedule and explained how, from my point of view, the Eagles had to perform across each stretch in order to actually achieve those 9 wins.  Well it’s now week 4, and the first benchmark I set was after the first 3 games.

Here is what I wrote; the full article can be found here.

Section 1 – The Sprint Start

3 games, 11 days.  The Eagles first stretch, in my view, comprises these 3 games (Redskins, Chargers, Chiefs).  The Chargers and Chiefs are both home games.  The Eagles, realistically, NEED to win 2 of these 3 games.  Again, it doesn’t really matter which two teams they beat (beating the Redskins would obviously help within the division).   However, the San Diego and KC games count as part of the “easy” side to the schedule.  San Diego is a mess and they’re coming across the country for an away game.  Kansas City is much improved (I think they’ll challenge for the playoffs, maybe get to 9 wins as well), and given the Andy Reid return and the McNabb ceremony, it’ll be a crazy game.

Benchmark: 2 Wins

The Eagles just finished that stretch, and only came away with 1 win.  As a result, the team is firmly off-pace.  However, there is some good news, the first of which is that the next stretch, which I labeled “the Darkness” no longer looks so difficult.  Here is what I wrote for Section 2 of the schedule:

Section 2: The Darkness

Three straight away games.  Denver, NY Giants, Tampa Bay.

This is the part of the season after which I expect a fair amount of hand-wringing.  If/when that happens, remember what we’ve said here.  The Eagles will probably lose 2 of these games, maybe even 3.  Denver is a beast; Peyton Manning against this defense is a very bad matchup.  I don’t think the Giants will be as good as most expect, but it’s still a road divisional game.  Tampa Bay is a bit of a wild card.

The key here is getting 1 win.  Again, it’s most helpful if it comes against the Giants (division) or Bucs (conference), but that’s a secondary concern.

Benchmark: 1 Win

The question now: is there any reason to believe the Eagles can win 2 of the next 3 games, bringing them back on pace?

I believe there is, and not just because the Giants look terrible and the Bucs just named Mike Glennon their starting QB.

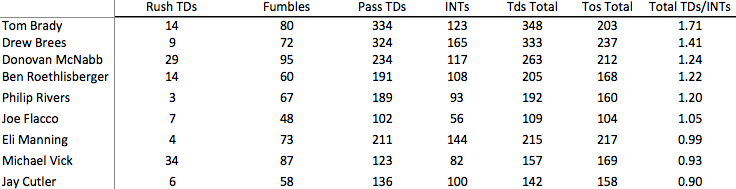
Let’s take a look at a few statistics from the season so far.  If you were reading EaglesRewind.com in the offseason, you’ll remember I did a lot of work on finding which statistics correlated most highly with winning.  The most important, outside of the obvious (points for and against), were TO Differential, which gets a lot of attention, and Sack Differential, which does not, though it’s arguably more important.

For illustrative purposes, here are two charts showing the correlation between TO Differential and Wins and Sack Differential and Wins.  For both, the data set is all NFL teams from 2003-2012, so 320 data points.

Screen Shot 2013-09-28 at 2.04.57 PM

Screen Shot 2013-09-28 at 2.11.37 PM

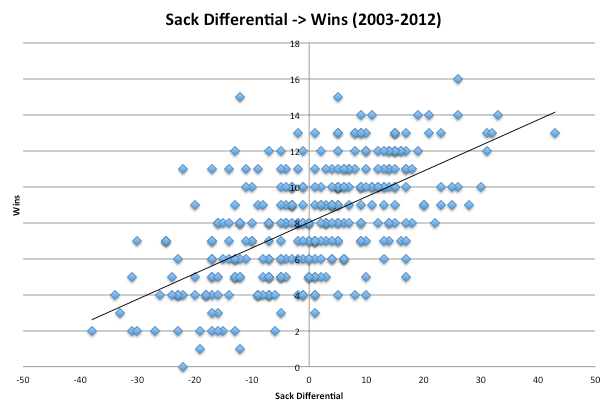
The corresponding correlations are .64 (TO Margin) and .62 (Sacks).  Obviously, each is a very important indicator of team success.  The reason I say Sack Differential is more important is because, in my view, it’s much less luck-dependent.  Whereas in TO Differential, you have things like fumble recovery % to skew the results, there is very little gray area involved in sacks (though there is some).  Overall, a team has much more control over Sack Differential and it does over TOs.

So how are the Eagles doing?

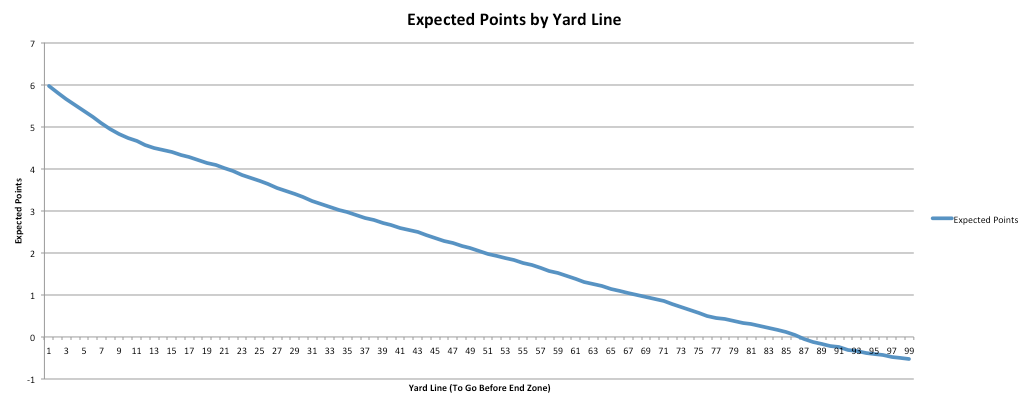
Well the team’s TO Differential is currently -2, which places it 22nd in the league.  That’s not good, but it’s not disastrous either (especially when compared to last season).  Now there are two ways to looks at this number at this point in the season.  Either it’s reasonable, because it’s close to zero, or its bad, because it means the team is “on pace” for a TO Differential of -10 to -11, which would, if you look at the chart above, correlate to a Win expectation of less than 6 wins.

I’m leaning towards the more optimistic case, and here’s why: the Eagles lost 5 turnovers against KC, and KC is one of the best defenses in the league (I know not all the TOs were on offense).  Since it’s so early in the season, single games have a large effect on the overall numbers.  The Eagles schedule has them playing just TWO more teams that rank in the top 10 defenses by Football Outsiders the rest of the year.  As I just said, it’s early, but the overall point is that the most recent event (KC) is more likely an aberration than a true indication of the Eagles’ ability.

I expect the Eagles to finish the season close to EVEN in TO Differential, though it’s a very difficult statistic to predict.  For now, just know that the team probably won’t have any more -5 TO games.  If it can finish around 0, it’d be indicative of an 8 win team (obviously).

Moving to Sacks

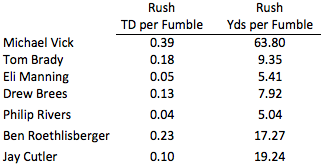
Here is the more important area.  Through 3 seasons, the Eagles’ sack differential is also -2.  That’s a bit of a disappointment.  The Offensive Line has not played up to expectations.  Granted, with Vick at QB, you have to assume a higher than average sack rate, but the hope was that a great O-Line anchored by Peters and Lane Johnson (a potential red flag that isn’t getting a lot of attention) and a “quicker” decision system from Chip Kelly would result in far fewer sacks of Michael Vick.

Through 3 games, his sack rate is 10.8% (11 sacks).  For his career, it’s just 8.7%, so clearly things are not going according to plan.  Again, we have to talk about the opposition.  KC will probably finish the year among the league leaders in sacks, and 6 of Vick’s sacks (more than half) came against the Chiefs.  That’s not normal and won’t continue.  

On the other side of the ball, the Eagles defense has come up with 9 sacks, led by Barwin and Cox, who each have 2.  The “on-pace” number is now 48 sacks, which would be a VERY good result.  Last season the Eagles had just 30 sacks, and the long term NFL average is roughly 35.  Here’s the good news: I don’t see much reason to distrust this number.

The Redskins have allowed just 6 sacks, 3 of which came against the Eagles.

The Chargers have allowed just 5 sacks, 1 of which came against the Eagles.

The Chiefs have allowed 10 sacks, but 5 of them came against the Eagles.

Against all three teams, the Eagles were able to sack the QB more than the other competition has.  As a result, it’s somewhat likely that the Eagles pass-rush (base, blitzing, whatever), will be legitimately good this year, despite what it has felt like.

If the Eagles can keep pace and finish with anywhere close to 48 sacks, it will be in very good shape, and likely to finish the year with a positive Sack Differential.  If Vick and the O-Line can keep it to between 2-3 sacks allowed per game (so similar to the Redskins/Chargers performances), it’ll finish with around 40 sacks, and a +8 differential.

Checking the chart, that’d be indicative of a 9 win team….

Summing things up

The Eagles are in better shape than people think.  The team still lacks defensive talent, but looking at the first three games together, there’s still every reason to believe that this team is a “True” 8-9 win team.  That should be good enough to contend for the division.  I fully expect people to write the team off after this week’s game against the Broncos.  However, I’d advise you to save your seats on the bandwagon, because in a couple of months, everyone’s going to be scrambling to get back on.

Either that or I’ve been blinded by homerism…


4th and 1; Gaming out Chip Kelly’s first big decision

There is a LOT to get through from Monday night’s game, but I wanted to dedicate a post to something extremely important.  Remember when I said that Chip Kelly’s biggest opportunity for truly “changing the game” lies in his 4th down decisions?  Well…

Screen Shot 2013-09-11 at 2.20.37 PM


Less than 2 minutes into the first game, Chip Kelly gets his first test.  Obviously, Chip went for it.  In fact, what I liked most about this play was that he continued to use the no-huddle.  Many coaches would have kicked a field goal in that situation.  Several other coaches would have gone for it, but would have called a TO or at least huddled up first, giving him some time to think about a play call.  Few, if any, would attack it the same way Chip did (no-huddle, no hesitation).

I’ve provided the high-level analysis for why, in general, going for it on 4th and 1 is better than kicking a field goal.  Here, though, we have a fresh, real-life example.  So let’s game it out:

Using Pro-football-reference’s play-finder, I searched for all 4th and 1 plays since 2008 season in which a team went for it.  Also, I included only regular season plays beyond the opponents’ 25 yard line and EXCLUDED all 4th quarter plays, since presumably the scoring incentives are a little different that late.  Using that search, we see:

– Teams were successful 63% of the time.

– The average gain for a successful play was 3.31 yards.

I won’t go through the step by step process again, other than to again cite AdvancedNFLStats.com for its Expected Points Concept.  For the step-by-step process, see here.  I’ll illustrate this in a table below, but for now, just know that, using the numbers above, going for it has an expected value of 2.52.

Meanwhile, the Eagles could have attempted a field goal from the 21 yard line.  Given the 10 yard end zone and the additional distance between the LOS and the hold (roughly 8 yards for Henery), that means the actual distance of the kick would have been about 39 yards.

From Bill Barnwell, we can see that the odds of making that kick are about 82%.

We also have to note that a missed kick in this situation gives the Redskins the ball at its 29 yard line (spot of the kick, not LOS).    So a missed kick, expected 18% of the time, is “worth” -0.85 expected points.

Putting that all together, we get this table:

Screen Shot 2013-09-11 at 2.46.26 PM

2.52 > 2.31

As you can see, going for it carried a higher expected value, and hence was the correct play at that point in the game.

At this point I have to note the caveat that we are using AVERAGE success rates.  For example, it’s possible (likely?) that the Eagles, by virtue of having McCoy and Jason Peters, have a better than average chance of converting 4th and 1.  It’s also possible that Alex Henery carries a significantly different average success rate (though I don’t think so).

So what we have here is a foundation, you can shift the analysis any way you like from there.  If the Eagles are better than average rushers, the expected value of going for it goes up (higher success rate).  Similarly, if the team was playing against a very good defense, we can assume that expected value would decrease (lower success rate).  Those moves, though, are all subjective, I’m merely setting the baseline.

Decisions like these are hugely important from a strategic standpoint.  The 0.21 difference in values above might not seem like much, but it’s significant.   If we think of the “gain” there in terms of an extra possession from the Eagles’ 17 yard line (worth 0.22 EP), it’s a lot easier to recognize the importance of making the right decision.

If Chip Kelly can consistently makes these calls, he’ll already being changing the game, regardless of what his offense does.  Coaches overall should be doing this, but it’s clear that, given the external pressures involved, they’re waiting for more cover.  Chip doing it successfully can serve that purpose, allowing everyone in the league to do things the “right” way, which would result in more entertaining (and optimal) football.

Or maybe it was just a one time thing and Chip will prove to be more conventional after all…


QB Fumbles; Providing some Context

The reaction to yesterday’s post was pretty strong, not here really, but over at BGN.  I realize that type of breakdown is far from perfect, but I thought it was a good illustration of the overall point I was trying to make (after seeing the data):

Yes, Vick is “inconsistent”. However, a lot of QBs that are considered “good” are also just as inconsistent if not more.  I hope to take a look at the standard deviation of performances to get a better sense of things, but the fact is, QBs, in general, have many more bad games than most fans realize.  Case in point:

Tom Brady, over his career, has recorded a passer rating of less than 80 in 31% of his starts.  Consider that for a moment.  Tom Brady is one of the best QBs of all time (if not THE best).  Still, nearly one of every three starts of his can be considered a “poor” performance (Rating less than 80).

Among the most often cited counterpoints to yesterday was the issue of Vick’s propensity to fumble.  That’s a fair point, so today I took a look at the data.  Again, it will surprise you (in a good way).

Here are the active leaders in QB Fumbles (besides Peyton Manning, who’s not included for reasons that aren’t really important here):

Screen Shot 2013-08-28 at 10.34.35 AM

Vick, as expected, leads everyone with 87 fumbles (stats are from Pro-Football-Reference.com and, I think, only represent Fumbles Lost, not all fumbles).  However, look at the complete rushing stats.

In context, things look a lot better for Vick.  Yes, he’s fumbled more than anyone else.  However, he has also provided a LOT of additional production on the ground.  Looking at the stats a little differently, we can see the differences more clearly:

Screen Shot 2013-08-28 at 10.47.10 AMThis is an admittedly simplistic view of things, but it provides necessary context for the whole “Vick fumbles so much” debate.  I feel like I need to remind everyone here that I’m far from a #TeamVick member.  I still think Foles makes more sense.  However, the Vick-Haters have gone too far.  As you can see above, Vick’s fumbles, while damaging, are not necessarily “worse” than any other QB’s.  In his career, he has run a LOT more than almost any other QB in NFL history and provided a lot of offensive production with his legs.  AS a result, he should be expected to fumble more.

We can certainly argue over how much “production” is necessary to counteract the negative value of a fumble.  Unfortunately, our data isn’t nearly as granular as it needs to be to provide a definitive answer in that respect.

What happens, though, when we view it purely in terms of TDs and TOs?

Again, simplistic but informative.  Here is a table showing a selection of QBs with their Rushing TDs, Passing TDs, INTs, and Fumbles.  I’ve also totaled the TDs and TOs and provided an overall TD/TO ratio.

Screen Shot 2013-08-28 at 11.02.04 AM

I included McNabb just to remind everyone how good he actually was.  We’re concerned with the active players though.

Vick does, in fact, come in at the bottom of the list.  However, look at his ratio (right-most column) compared to guys like Cutler and Manning.  My sense is that a lot of Vick-haters would jump at the opportunity to trade him for Eli Manning or Jay Cutler.  I wouldn’t.  In fact, the more a did into QB stats, the worse Eli Manning looks.

The point, of course, is that complaining about Vick’s fumbles may sound right, but if we put it in context, his “problem” isn’t really that bad.  He runs more than any other QB, he should be expected to fumble more.  His fumbling rate is higher than most QBs, but he also produces a lot more rushing production; perhaps we should judge his fumbling rate as though he were a RB.

Also, consider the following points:

– Vick’s TD/TO ratio with the Eagles is 1.05, the same exact ratio as Joe Flacco.

– Vick’s more than 5500 rushing yards presumably led his team to a number of field goals, meaning there’s additional upside to his rushing that isn’t accounted for here.

Hopefully that shed some light on the whole “fumble problem”.  Yes, Vick fumbles a lot.  However, focusing on that without accounting for the corresponding rushing production is an incomplete (and unfair) view.

Vick isn’t a great QB.  It does appear, though, that he’s good enough.

Finally, no posts for the rest of the week (school orientation).  4th Preseason game should be fun, but relatively inconsequential as far as the team’s 2013 performance goes.  Things to watch:  Nick Foles (of course), Matt Barkley, and the DBs.

How Inconsistent is Vick?

Occasionally, I start to write a post with an end-point in mind, only to find out that what I expected to be the case was actually far from reality.  Today is one of those occasions.  I was hoping to provide an illustration of Vick’s “Boom-or-Bust” nature.  Indeed, I have done that, but I also found some very surprising results when I compared him to other prominent QBs, albeit with a serious caveat that I’ll explain at the end.  First, let’s look at Vick by himself.

Here is a chart showing Vick’s QB Rating by start.  I’ve only included games from his Eagles career (34); he simply isn’t the same player from his Falcons days (mostly a good thing).  All numbers are from Pro-Football-Reference.com.

Screen Shot 2013-08-27 at 1.00.08 PM


To make things easier, look at this table:

Screen Shot 2013-08-27 at 1.08.01 PM

Before we talk about that table, we need some context.  Last year, Tony Romo finished 10th in the league in Passer Rating with a rating of 90.5.  Also, last year the median Rating for starting QBs (does not include spot-starters) was 84.

In light of those stats, I’m going to define “Good” play as anything about 90.  Anything less than 80 will be defined as “poor”.  Everything in between is mediocre.

See any issues?  Vick, in his time as the Eagles’ starting QB has delivered Good (or better) play 56% of the time.  However, he’s played poorly 35% of the time.  Interestingly enough, he’s had “mediocre” play in just 9% of his starts.

That’s about what I expected to find.  I assumed Vick would provide a higher percentage of Good and Poor starts, with a very low percentage of Mediocre starts.  While that appears to be the case on an absolute basis, comparing him to other QBs leads to some huge surprises.

Here is the same table (I’ve combined the 90-100 and 100+ lines), but with several other QBs included.  To keep the comparison fair, I’ve only included starts from the 2010-2012 season (between 46 or 48 games for each other QB).

Screen Shot 2013-08-27 at 2.02.48 PM

Looking at Vick’s “consistency” in context with other QBs, we can see some very favorable comparisons.  During Vick’s time with the Eagles, he has delivered “Good” performances more often and “Poor” performances less often than Eli Manning, Joe Flacco, and Tony Romo.

Vick has similar numbers (slightly worse) to Matt Ryan.

Lastly, I just want to highlight the remarkable play of both Brady and Rodgers.  That’s what having an “elite” QB gets you.  75% of the time, you know you are getting “Good” play from the position.  Also note Rodgers’ incredible avoidance of “poor” performances.  This is probably the subject for another blog post, but Aaron Rodgers might be quietly putting together the greatest QB career ever…

Summing things up, it seems as though Vick’s “inconsistency” is somewhat overblown.  On an absolute basis, that may be true.  However, it’s also true that, since coming to the Eagles, Vick has delivered “Good” QB play in an impressively high percentage of his starts.  Outside of the true top-tier of QBs (Brady, Rodgers, Brees, P. Manning), Vick compares favorably to his competition.  Additionally, looking at QB Rating ignores Vick’s rushing stats, which can only help his case in comparison to most NFL QBs.

Alright everybody, back on the bandwagon…

Run/Pass Game Theory; Optimal 3rd and 1 play selection

Today we’re going to revisit the Run/Pass play selection series I began a few weeks ago.  For those of you have didn’t see it, here are the primary articles:

Marginal Value of 1 yard on 3rd and 1

Nash Equilibrium and 3rd Down Strategy

The overall theme of the articles was that NFL play-callers are not running as often on 3rd and 1 as they should.  I supported this argument with a fair amount of evidence, using expected points and run/pass success probabilities.  However, there were a couple of holes in there.  Today I want to close one of those, refining the analysis and consequently lending it more confidence.

First, from the first link above, this is what I’m talking about:

Let’s just assume for a second the odds of success for each are equal to the Run/Pass odds we saw yesterday (I know that isn’t right, but its instructive). That means the expected payout for each is:

Run: 2.39 expected points * 70.7% success = 1.69 Expected Points

Pass: 2.65 expected points * 54.6% success = 1.45 Expected Points

For that to be correct, that expected yardage for a run on 3rd and 1 would have to be 1 yard and the expected yardage for a pass would have to be 5 yards, neither of which is likely the case.  However, as you can see, the difference in expected yardage gained would have to be very big to account for the difference in success rates.

The section in bold highlights a particularly large potential weakness, which I’ve now fixed. Using the Pro-Football-Reference play finder, I was able to provide a higher level of resolution.  For my data set, I used all 3rd and 1 plays run over the past 5 seasons.  From this, we need the following pieces of information:

– The average gain of a successful run on 3rd and 1.

– The average gain of a successful pass on 3rd and 1.

– The odds of success for a run.

– The odds of success for a pass.

Using the play-finder, we can see that the average successful run gained 4.43 yards.  The average successful pass gained 11.26 yards.

While I previously used this site for out success rates, we can now find them ourselves using Pro-Football-Reference.  Since our data set is now just 5 years, we need to update our rates.  Over that time frame, on 3rd and 1, run plays succeeded 69.3% of the time.  Pass plays were successful 57.7% of the time.

Now we have our building blocks.  Just as we did before, we can use them in combination with Expected Points (AdvancedNFLstats.com) to calculate the expected value of each (run/pass), which will tell us which is the better choice (on average for the league).

To refresh, here is the expected value of each yard line:

Screen Shot 2013-08-22 at 12.31.10 PM

Using this concept, we can calculate the value of the average gain on 3rd and 1 for both run plays and pass plays.  For example, given 3rd and 1 at the 20 yard line (opposing), a successful run can be expected to gain 4.43 yards, leaving the offense with a 1st down between the 16 and 17 yard line, which is worth 4.35 expected points.  Similarly, a successful pass will gain, on average, 11.26 yards, giving the offense a first down between the 8 and 9 yard line.  That position is worth 4.86 expected points.

However, we’re not done yet.  We need to factor in the different success rates.  Here is a table, summarizing the previous paragraph and adding the expected success rates:

Screen Shot 2013-08-22 at 12.37.29 PM

As you can see, once we factor in the expected success rates, the Run option stands out as the optimal choice.  It’s expected value is 3.01 versus an expected value of just 2.81 for the pass option.

If this sounds counterintuitive, remember the chart I gave you in the “Marginal Value” post, seen below:Screen Shot 2013-08-22 at 12.40.30 PM

The bulk of the value in any successful 3rd and 1 play lies in the first yard gained.  To that end, sacrificing additional yards in exchange for a higher success rate is typically a good trade-off.

Finally, I ran the numbers at each yard line, giving me this chart, which shows the expected value of a run and a pass at each yard line, in a 3rd and 1 situation:

Screen Shot 2013-08-22 at 12.46.22 PM

Now that’s interesting.  It’s hard to see, but the optimal play call switches from run to pass at the 53 yard line (so own 47 yard line) as you move farther away from the end zone.  Here is chart that illustrates the difference more clearly.

Values above zero mean the Run is the better option, values below the axis mean Pass:Screen Shot 2013-08-22 at 1.18.04 PM

So it looks like our overall thesis needs some updating.  Note that the lumps in the data (particularly on the right side of the chart) probably reflect statistical anomalies in the Expected Points data.  Theoretically, that should be a smooth line.  However, the magnitude of the difference isn’t that important, so it doesn’t effect the overall point.

Given recent NFL success rates on 3rd down and the expected value of a first down at each yard line, NFL teams should RUN when they are beyond their own 47 yard line, and PASS if they aren’t.  Note that the values once again converge with 13 yards to go until the end zone.  Obviously, beyond that the 11.26 average pass gain gives you a TD, which skews the results and likely isn’t representative of what happens in real life (presumably the average gain for a pass declines when you’re that close to the end zone, it kind of has to).

We can also assume that if NFL play-callers followed this analysis, the success rates would change, leading to the overall equalization in expected value of a Run versus a Pass, eliminating the inefficiency.  That point would represent the Nash Equilibrium.  However, until that happens, smart NFL teams can exploit this for an advantage.

Projecting the Eagles 2013 Record

We’ve still got 2 more preseason games and a couple of weeks before the official start of the season, but I think it’s time to actually game out what this season might look like.  I’ve said several times that I think this is a “natural” 8-9 win team (closer to 8).  However, that prediction was essentially made in a vacuum.  Now it’s time to put some real evidence behind it.  To do this, I’m going to use Pythagorean win probability, using base-case/upside/downside assumptions for both the offense and defense.


Tomorrow, I’ll take a look at the actual schedule and try to discern where, exactly, the Eagles wins SHOULD come from, setting benchmarks along the way so we can check in during the season and see how the team is doing (rather than overreact to short 2-3 game stretches).

For this analysis, we need to project how good both the Eagles offense and defense will be.  I’m going to discuss this in terms of percentage +/- league average (same look we’ve talked about before).  In both cases, we’re looking at Points (points for and against).

First, the offense.  How good can the Eagles be?

Let’s start by looking at the team’s recent performance.  Here is a table showing the previous 5 seasons:

Screen Shot 2013-08-19 at 9.46.51 AM

As you can see, the Eagles offensive production was very good over that time period.  Last season was very bad, but it stands out as an anomaly.  The offensive line was destroyed by injuries, and the Eagles best offensive player (Jason Peters, maybe 2nd best) was hurt before the season even started.  This year, the O-Line looks to be healthy (crossing fingers), plus the team has added Lane Johnson, the 4th overall pick in the draft.  Couple that with Chip Kelly’s expertise and the performances we’ve seen in the preseason thus far, and I think it’s fair to say we expect the offense to be closer to the ’09 and ’10 teams than last year’s.

Remember, we’re using 3 different cases here to get a range of expected win values.  For the offense, I’m going to set them as follows:

Upside – +30%.  Not expected, but that’s why it’s the UPSIDE case.  The 2010 Eagles were +20%, and with Chip Kelly at the helm and many of the same skill players, it’s not ridiculous to think the team could be slightly better.

Base Case – +15%.  This might be too aggressive, but I think it’s fair as a base-case expectation.  The offense is clearly the strength of this team.  Chip Kelly + Shady + DeSean + the O-Line SHOULD mean a very good offense.  I think, regardless of the Vick/Foles debate, that this team will be very good on offense.  Given that the team was +12% in 2011 and +25% in both 2009 and 2010, I think +15% is a reasonable expectation.

Downside – +5%.  Note that we are looking at the “Downside”, not the “disaster” case.  Simply put, unless the team suffers injuries to multiple offensive stars, I don’t see any way it finished below league average in points scored.  The team finished below average (<0%) just 3 times during Andy Reid’s tenure, and I expect that type of consistent offensive output to continue with Kelly.

Now the Defense.

As every fan knows, this is the side of the ball that will likely determine whether the Eagles are a playoff contender or not.  As I showed on offense, here is the defensive performance, relative to league average, over the last 5 years:

Screen Shot 2013-08-19 at 9.57.21 AM

Obviously, the defense is much harder to project.  Last year was terrible, but remember that was also greatly effected by the historically bad turnover results as well as awful special teams.  Special teams looks to be improved, and, statistically speaking, it’s close  to impossible for the team not to rebound significantly in turnover margin.  That’s a long way of saying that we should expect improvement from last year, though how much improvement is a big question.  As it is, my assumptions are:

Upside – +5%.  Not likely, but it’s within the realm of possibility that the Eagles will be slightly above average on Defense this year.  While preseason isn’t always a great indicator, it looks like the D-Line will be a bit better than I expected it to be.  The LBs are a question, but Mychal Kendricks could certainly take a big step forward this year.  Also, it looks like Patrick Chung has plugged one of the gaping holes at Safety (for at least part of the season while he’s healthy).  Bradley Fletcher looks good at CB, as does Brandon Boykin, who’s positioning himself as a contender for the biggest surprise on the team.  If what we’ve seen so far continues, then average-slightly above average is a reasonable upside case.

Base Case – -5%.  Slightly below average.  Say the words while picturing this year’s defense and I think you’ll agree it sounds about right.  If we start from last season’s performance (-22%) and factor in improved field position and turnovers, then add a less than catastrophic defensive backfield, and it’s reasonable to expect the team to move from very bad on defense to purely mediocre (on the negative side).

Downside – -15%.  This one’s easy.  Last year the Eagles were -22%.  Just about everything that could go wrong, did.  I just don’t see any reasonable scenario that results in the team being as bad or worse than it was last season.  In fact, taking the exact same quality of performance and adjusting for better turnover luck would itself lead to relatively large improvement, hence the downside case of -15%.

So where does that leave us?  Here’s the summary matrix:

Screen Shot 2013-08-19 at 10.42.20 AM

Now we need to translate that into points, then we’ll use the Pythagorean Win Probabilities to calculate or expected win range.  What should we expect the league average to be?

Here is a chart showing scoring per team, per game from 2003-2012:Screen Shot 2013-08-19 at 10.16.04 AM

Last year the average was 22.7, but as the chart shows, we should expect an increase this season.  The average annual increase over that time period is approximately .2 points per game.  Therefore, we’ll use 22.9 as our expected average for this season.

So, using the values in our matrix, we get the following:

Screen Shot 2013-08-19 at 3.33.40 PM

This chart gives us 9 potential values given our assumptions for this season.  Here they are, with expected wins included.

Screen Shot 2013-08-19 at 10.47.30 AM

The average win expectation is 9.1.  I guess I need to shift my expectations upwards.  Tomorrow, I’ll use the actual schedule to see whether the Eagles will win as many games as this analysis suggests.  However, the overall message is this: the proper expectation for Eagles fans is a team that contends for the division and at least wins a Wild Card spot.

Eagles 2012 Performance Dashboard

This is something I’ve wanted to put together for a while, and I finally got around to it.  Below is an illustration showing the Eagles’ 2012 performance, relative to long-term league averages, in a variety of statistics.  The format is far from perfect.  Ideally, I’d put this into a Tableau pop-out.   Unfortunately, that software is not available for Mac.  If someone has it and is interested in putting that together, please email me and I’ll give you the necessary data.

For today, though, we’ve got two charts.  I apologize for the small size, you might want to zoom.  Just getting it in this format took about 5 times as long as actually putting the data together.

I’ve standardized all the data using standard deviations and ordered it so that the left side is bad and the right side is good.  Please note that not all of these statistics are necessarily normally distributed.  However, this is the easiest way to get everything on one chart, which allows us to quickly identify where the team’s weaknesses and strengths were last season.  Additionally, we can quickly identify the areas for which we can expect significant improvement purely as a result of mean reversion.

In particular, you should focus on the stats for which the Eagles were more than two standard deviations WORSE than long-term league average.  All averages and standard deviations were computed using 10 years of NFL data (except for Net Field Position and FO Adjusted Games Lost, which uses 5 years of data).  The right side of the chart shows you the actual statistical measure for the 2012 Eagles for each stat (i.e. Average Net Field Position was -6.67 yards).

Screen Shot 2013-08-15 at 11.35.24 AM

Above, we can see a number of areas where the Eagles were more than 2 standard deviations worse than the long-term average.  More importantly, those areas are either predominantly luck-based, or show no year-to-year persistence.  Specifically:

– Fumble Recovery Rate

– Fumbles Lost

– Net Field Position

– T/O Differential

Eagles fans can expect significant improvement in each of these areas (obviously they’re all interrelated to a degree).

This next chart isn’t as severe, but gives a good view of just how good/bad the Eagles’ performance was last season.

Screen Shot 2013-08-15 at 11.47.13 AM

Of particular note is the last one (bottom of the chart).  That’s Football Outsiders’ measure of injury loss per team.  It’s a weighted statistic that attempts to account for the relative importance of the players lost to injury as well as the overall number of games lost.  The 2012 Eagles, while hit hard by injuries, are not outside the expected range.  The concentration of injuries along the O-Line may mean that statistic underrates the degree to which injuries hurt the team, but the point remains, health is likely not an area in which to expect dramatic improvement (already losing Maclin already stopped much of that conversation anyway).

New Predictive Formula for College QBs

If you haven’t read yesterday’s post about 4th and 1 strategy, please do.  It’s important and uses concepts that I’ll be revisiting very soon (looking at other scenarios).

For today, I’m going to give you a taste of what’s featured in the Eagles Almanac.  If you haven’t done-so already, I strongly encourage you to purchase the PDF version (only $10). The paperback is also available now.  Both can be found here.

I made two contributions, one of which is a brief synopsis of the case in favor of starting Nick Foles this year.  My other article covers in-depth what I will discuss briefly today.  Basically, I’ve created a new formula for evaluating the professional potential of college quarterbacks.

You’ll have to read the Almanac for the complete breakdown, but here are the basics.  First, a couple of key charts:

For all QBs who were drafted between 1999 and 2012 and have at least 200 NFL pass attempts:

Screen Shot 2013-08-14 at 10.29.06 AM

The correlation value is -0.289.  While many “analysts” have expounded on the importance of college completion percentage (we’ll look at that next), Wonderlic scores, or games started, very few (if any) have highlighted College Interception Rate as a statistic to use as an indicator of professional success.  I looked at a lot of statistics for this article, and found very few that had the predictive value of Interception Rate.

Now, with the same sample, college completion percentage to NFL Rating:Screen Shot 2013-08-14 at 10.36.35 AM

The correlation value here is 0.35.

As you can imagine, we can use both of those stats (with apparently predictive value) to create a new formula for predicting QB success.  You can see the complete formula in the Almanac, but here are some of the results.  As far as scale goes, all you need to know is that receiving a negative score is bad.  How bad?

Here are the QBs who received a negative score:

Screen Shot 2013-08-14 at 10.55.49 AM

Depending on your definition of a good QB, there are potentially a few “false negatives” (most notably Donovan McNabb).  However, regardless of your definition, there aren’t many.  Conversely, I think it’s safe to say that, if they could do it over again, teams would not use 1st round picks on Kyle Boller, Joey Harrington, Cade McNown, J.P. Losman, Akili Smith, and Brady Quinn.

Similarly, though they’ve had good careers, have Michael Vick and Carson Palmer lived up to #1 pick status?  Maybe, again depending on your personal opinion, but the point is it’s very debatable.

Here is the complete correlation chart for “Formula Score” and NFL Rating:Screen Shot 2013-08-14 at 10.59.39 AM

The correlation value is .363.  That doesn’t sound like much, but given what we’re tackling here (predicting human development), it’s very good.  Additionally, in the Almanac I test this formula against the popular “26-27-60” rule, with encouraging results.

Lastly, I’ll leave you with a few specific points:

– Both Nick Foles and Matt Barkley registered positive scores.

– Robert Griffin the Third had, by far, the highest score in the sample (you can see him in the far top right of the chart above).

– Geno Smith registered the highest score overall (he wasn’t in the sample).

For more detail and specific scores, get the Almanac!  If you do, you’ll also get (among other things):

– An insider’s look at Chip Kelly’s time at Oregon (perhaps the best contribution in the entire Almanac)

– Diagrammed breakdowns of a few key “Oregon Offense” plays.

– A great reflection on the Andy Reid era.

In other words, everything you need to be ready for the start of the Chip Kelly era.

NFL Teams should (almost) always “go for it” on 4th and 1

Anyone who has looked at the 4th down strategy chart above knows that going for it on 4th and 1 (trying to convert) is ALMOST ALWAYS the optimal play.  While the multi-part series of posts (Part 1 can be found here) that culminated in that chart explained the thinking behind it, it occurred to me that we didn’t actually lay out the numbers.

So here is the theory, using the concept of expected points, of why it’s usually best to go for it on 4th and 1, from nearly ANY spot on the field.  Remember that when I use expected points, I’m piggybacking off the work done by Brian Burke at AdvancedNFLStats.com  (expected points).

The overall thesis is: Possession in an NFL game is EXTREMELY valuable, and NFL coaches voluntarily surrender it far too often.  With just 1 yard to gain, the odds are heavily in the offense’s favor of gaining a first down and keeping the ball.  Despite this, “common” strategy calls for giving the ball away in these cases.  This is wrong.

Basically, we are combining what we know about the probabilities of converting 4th and 1 with the expected point values of each yard line.  By doing so, we can come up with the actual expected point trade-off for each punt/go-for-it decision.  Put more simply, just how valuable is “field position” gained by punting on 4th and 1?

Before I get to the good stuff, I want to make one caveat very clear.  I’m using NFL averages to compute the following values.  Obviously, most teams deviate from the league average to some degree.  However, if I can show that all NFL teams, in aggregate, should be more “aggressive” on 4th and 1, then it’s a fairly small step to then apply it to the Eagles specifically.  I just have to acknowledge that there is, in fact, another step there.

First, we need an expected success rate.  Using this site, which I cited for our 3rd down play-selection/game-theory discussion, we can see that over the past 10 years, all 4th and 1 plays have been successful 66.5% of the time.  Below is the output.  The 66.5% is simply the weighted average success rate.

Screen Shot 2013-08-13 at 11.30.16 AM

Second, we need to know just how much field position can be expected to be gained by a punt.  Using ESPN’s stats, we can see that last year, the median NET punting average was approximately 41 yards (between 41 and 42).

So we have our building blocks:

– Teams are successful at converting 4th and 1 yard 66.5% of the time.

– By choosing to punt, teams can be “expected” to gain approximately 41 yards of field position.

Now let’s look at expected points and put those two things in context.  Here is a graph showing the expected value of a first down at each yard line.

Screen Shot 2013-08-13 at 11.33.37 AM

Unsurprisingly, the expected value of a first down increases towards 6 points as you get closer to the goal line.  By itself, though, this chart isn’t overly helpful.  However, we can use this chart to gauge the value of an average punt in each spot.

Let’s look at the scenario of a 4th and 1 at the offense’s own 9 yard line (the worst possible field position at which this can occur).  Simplifying things, there are 3 potential outcomes.

– Punting, which we will assume results in the opposing team taking possession at the 50 yard line (41 yard kick).

– Going for it and converting.  Here, to keep things easy, we’ll assume the offense gains just 1 yard, the minimum needed to gain a 1st down.

– Going for it and failing, the result of which gives the opposing team the ball at the 9 yard line.

Applying the success rate and expected points we saw above, we come to the following values for each scenario:

Punting is worth -2.04 points, which is the expected value of a 1st down at the 50 yard line (for the other team, hence the negative).

Going for it and gaining 1 yard is worth -0.21 points, which is the value of a 1st down at the 10 yard line.  However, this only has a 66.5% chance of happening, which we’ll adjust for in a moment.

Going for it and failing is worth -4.83 points, which is the value of a 1st down for the OTHER team at the 9 yard line.

Using the 66.5%/33.5% success odds, we can calculate the expected value of going for it, that is the expected value WITHOUT KNOWING if you will succeed or fail.

Converting: -0.21 * .665 = -0.14

Failing: -4.83 * .335 = -1.62

Combined: -1.62 + -0.14 = -1.76

See why that’s a big deal?

Given a 4th and 1 at your own 9 yard line, an average punt is “worth” -2.04 points, while going for it (with average success) is “worth” -1.76.

Going for it is worth 0.28 points MORE than punting.

Hopefully one example was enough, so rather than continue, I’m just going to give you a chart.  Here is the expected value of both punting and going for it at each yard line (between the 9 and 50), assuming a 41 yard punt, a 1 yard gain if converting, and league average success rate when going for it.

Screen Shot 2013-08-13 at 12.03.20 PM

So there you have it.  As you can see, going for it is more valuable than punting regardless of field position.  As I said at the top, with just 1 yard to gain, the odds heavily favor the offense, yet they don’t seem interested in taking advantage of it.

Giving up possession of the football, regardless of whether it’s the result of a TO or punt, is bad.  It looks like teams are underrating the degree to which punting the football is a negative play.  They also seem to be under-appreciating the odds of converting in 4th and 1 situations.  As a result, “common” NFL strategy is far from optimal, leaving an opportunity for a forward thinking team to gain a significant advantage over the rest of the league.

Obviously each of these assumptions needs to be tweaked for individual teams.  However, if the league, overall, should be going for it a lot more often in 4th and 1, then by definition, many teams should going for it more often.  Here are some quick adjustments that result in “going for it” more often, with the reciprocals being adjustments that should result in punting more often:

Bad Punter – Go for it more often (lower net punting average)

Good Offense – Go for it more often (higher expected value of a first down)

Bad Defense – Go for it more often (value of OPPOSING team’s possession after a kick is higher)

Someday, we’ll see a team take advantage.  I think Chip Kelly will be more aggressive than average (closer to optimal), but far from as  “aggressive” as he should be.  Hopefully, after developing a successful track record and some credibility, he’ll have the stones to implement strategy like this more fully.

The Most Overrated Teams

Note: Only two teams today.  Let me know if you’d like to see more. Since I’m nominally Eagles focused, I’m hesitant to spend too much time on other teams.  If everyone is interested though, I’ll parse the projections for more teams.

Yesterday I showed the most “underrated” teams heading into the 2013 season, with Carolina and Washington emerging as two to keep an eye on.  I think the FO projections for both are a bit aggressive, but I still come down higher than the Bovada lines.  Today, naturally, we’re going to other way and looking at the most OVERrated teams in the league.

Here are all of the teams for which the Bovada O/U lines are higher than the FO projected wins.

Screen Shot 2013-08-08 at 11.48.55 AM

Most obvious is the number of “overrated” teams and the relative magnitude of the differences.  Simply, compared to what we say yesterday, it seems there are a lot more overrated teams than underrated.  Before we get to the specific teams, I want to illustrate a very important point about gambling lines. 

Remember what I said about the Cowboys (on Tuesday)?  I expect the O/U lines for the Cowboys to usually be artificially high as a result of the number of “homer” bets placed on the team each year.  While there are only a few teams I suspect of having such serious distortions, it’s logical to think that, throughout the entire league, lines are artificially high.

basically, fans are optimistic.  This, in turn, makes them terrible gamblers.  What’s the upshot?

If we add up all the O/U lines from Bovada, we get 262.5 wins.

So what?

There is a maximum of 256 wins available.

The Football Outsiders projections, of course, add to 256.1.

This means that, just as the chart above shows, teams are naturally more likely to be overrated than underrated.

Now let’s look at specific teams.

Atlanta

The Falcons stand out as the most significantly overrated team in the league, with a O/U 2.4 wins higher than the FO projection. The Falcons were very good last year (won 13 games).  The team kept most of its roster intact, and added Steven Jackson.  Matt Ryan is still the QB, and should be entering his prime.

In that light, expecting the team to win just 10 games this year (a decline of 3 from last season) seems very reasonable.  What gives?

– The Falcons point differential from last year points to an 11 win team.  When projecting improvements/declines for each team, its important to focus on the “true” value for the previous year, rather than the actual W/L.

– The 2012 Falcons faced the 27th toughest schedule in the league (according to FO).  In 2013, the team looks to be facing one of the top five toughest.

– Last year, Atlanta recovered 64.29% of all fumbles, including more than 72% of the opposing teams’ fumbles.  Both those measures are likely to regress.

– In the same vein, the team lost just 4 fumbles last year.  The long-term NFL average is 11.

– The division is likely to be much tougher this year.  Sean Payton is back.  Carolina, as we saw yesterday, is likely to improve substantially.  Tampa Bay, while being a bit of a wildcard, certainly appears to have made substantial roster improvements.

All in all, I’m inclined to agree with FO here.  This looks like an 8-8 team, with the potential for a serious implosion.

Minnesota

The Vikings won 10 games last year, still feature Adrian Peterson, and have a young QB that should be expected to improve.  And yet, the O/U is 7.5 and FO projects the team to record just 5.5 wins.

Using point differential, the “true value” of this team last year was actually pretty high.  Using a 2.67 exponent and the Pythagorean formula, the 2012 Vikings were a 9 win team.

So what’s the case against?  And more importantly, just how much regression should we expect?

– Christian Ponder is the “young QB”.  I’m not a fan.  I’m not going to delve into Ponder-specific stats here, but take my word that things aren’t looking good for the “Ponder is a franchise-QB” crowd.  If you’re interested but don’t want to do the research, buy the FO Almanac, they’ve got more in there.

– Adrian Peterson had a HISTORICALLY good year in 2012.  He is unlikely to replicate that this season.  He will still likely be very good, but “very good” won’t be enough to carry the team like he did last year.

– The team faced the 7th toughest schedule last season (Pro-Football-Reference), which would normally be a good sign.  However, the schedule this year looks to be even tougher.  It’s always hard to project team strength before the season, but consider the team’s non-division schedule includes games against the following teams (and Cleveland):

Seattle (@), Baltimore, Cincinnati (@), Pittsburgh (U.K), Carolina, the Giants (@), the Redskins, and the Eagles.

Not all of those teams will be as good as expected (Giants and Pittsburgh would be my picks for disappointment), but it will almost definitely be an incredibly difficult run of games.  Meanwhile, the Vikings still have to play two games against Green Bay.

– Minnesota was middle-of-the-pack in turnovers last season, and it’s recovery rate was right around 50%.  That means we should expect regression, but it also means that Turnover Luck isn’t a likely source of improvement either.

– Lastly, the team lost Percy Harvin.

Putting it all together, this could be a very ugly season for the Vikings.  As far as a personal projection goes, I have the Vikings in the 4-5 win range, which is even lower than FO.  While there are a number of explanations (including the points above), it really comes down to Christian Ponder versus a very tough schedule.  I think it’s likely to be a train wreck.

Lastly, I said yesterday that it might be instructive to simply take the average between the Bovada O/Us and the FO projections and use that as a projection for the year.  I’m still doing research regarding the relative accuracy of each, but the average looks promising.  Regardless, here are the values (remember that they’ll be slightly inflated due to the optimism distortion I mentioned at the top).

Screen Shot 2013-08-08 at 12.42.07 PM